Exploring Seasonal Variation of Indoor Radon in Campania: Preliminary Findings
Abstract
This study focuses on the indoor radon gas monitoring in 30 residences in Campania to evaluate seasonal variability. Approximately 570 CR-39 solid-state detectors were employed. Measurements were taken monthly, quarterly, semiannually, and annually, starting in October 2022 and ending in September 2023. The seasonal variability was assessed using the Gini coefficient, with quarterly and semiannual values being comparable at 6% and 7%, respectively, while the monthly measurements exhibited a higher Gini coefficient, 13%. The measurements were conducted in accordance with the UNI ISO 11665-4:2021 standard. This preliminary study investigates the seasonal variability of radon concentration in Campania. The results obtained may support future research on a larger scale.
1. Introduction
Indoor radon, a colorless and odorless radioactive gas, is released from the decay of uranium present in soil and rock. It enters buildings through cracks, gaps, and other openings, accumulating to potentially hazardous levels. Most of the radon we inhale is exhaled before it decays due to its long half-life (3.82 days). Its progeny, on the other hand, being electrically charged, can attach to dust or smoke particles in the indoor air and, during the breathing process, manage to reach the bronchial tissue. The subsequent decay (α-particles) can damage the lung epithelium [1]. Elevated radon concentrations have been linked to an increased risk of lung cancer. It is widely known in the literature that radon exposure is responsible for 3%–14% of lung cancers in various countries [2] and that there is a synergistic effect of exposure to radon and cigarette smoking. In fact, according to the World Health Organization (WHO), exposed smokers have an approximately 25 times higher risk than nonsmokers [3]. This evidence supports the need for comprehensive studies to better understand the dynamics of indoor radon levels [4–8]. Several factors contribute to the variation in indoor radon concentration, including geological characteristics, building construction, ventilation rates, and weather patterns. Geological features, such as the composition of soil and rock, can greatly influence radon release [9–11]. Buildings with poor ventilation may trap radon, leading to higher concentrations [12–15]. Additionally, seasonal changes in temperature and air pressure can impact radon infiltration rates. Different studies have observed fluctuations in indoor radon concentrations across different seasons [16–20]. These variations are often attributed to changes in indoor–outdoor temperature differentials and natural ventilation patterns. During colder months, buildings are more tightly sealed to conserve heat, leading to reduced air exchange and potentially higher radon levels. In contrast, during warmer months, the ventilation rate is increased due to open windows and doors, resulting in lower indoor radon concentrations. This research work was conducted in 30 dwellings in the Campania region and is aimed at highlighting the importance of considering seasonal variations in radon exposure risk assessment. The measurement sites are distributed over a diameter of approximately 40 km.
Understanding the seasonal variation of indoor radon concentration is crucial for effective radon risk management and public health interventions [21–24]. This paper is aimed at examining the seasonal variability in indoor radon concentration while considering meteorological parameters evaluated during the same period.
To evaluate the seasonal variability of indoor radon gas, the Lorenz curve and the Gini coefficient were also used. These methods, generally used in socioeconomic contexts to measure income inequality, were applied in this study to assess the distribution and fluctuations of radon concentrations across different seasons [25].
Several remedial actions can be adopted such as natural and/or forced ventilation, crack sealing, and the use of radon-free materials such as floor and wall coverings. The choice depends on effectiveness, cost, and expert implementation considerations [26]. Italy has an extensive literature on radon research and mitigation efforts. Furthermore, it implemented the European Directive EURATOM/59 with Legislative Decree 101/2020 subsequently integrated with Legislative Decree 203/2022 [27–29].
2. Materials and Methods
2.1. Campania Region
The measurements were performed in Campania, which is a geologically diverse region located in southern Italy. Its lithology includes a variety of lithologies, including sedimentary rocks such as limestone, clays, and volcanic rocks resulting from the activity of Vesuvius and the Campi Flegrei. This variety of rocks can affect the presence of radon, a naturally occurring radioactive gas that can be present in soil and rocks [30]. The climate in Campania is predominantly Mediterranean, characterized by hot, dry summers and mild, wet winters [31]. The region experiences a significant variation in temperatures between coastal and inland areas, with coastal regions being warmer due to the influence of the Mediterranean Sea. During the summer months, temperatures often reach highs of 30°C–35°C, while winters are milder, with average temperatures ranging from 8°C to 12°C. Precipitation is more common in the winter months, with occasional snowfall in the higher inland areas.
2.2. Evaluation of Radon Concentration
In Italy, several nonprofit awareness-raising campaigns are conducted to communicate and disseminate the risks of radon exposure as required by the specific legislation; among them are the “Researchers’ Night” and “Futuro Remoto” [32]. In addition, information on measuring instruments and methods as well as recommendations on institutions specializing in assessing radon concentrations is provided during the events. The present work was a consequence of scientific outreach events during which the general population was involved and subsequently voluntarily proposed to carry out the monitoring in their own apartments. Thirty measurement points were chosen, both for the availability received from the population and for the similarity of the building materials, so as to exclude the building material as a factor influencing radon concentrations. The monitored rooms were all made of concrete. The measurements were made with CR-39 passive solid-state detectors. In this work, approximately 570 CR-39s were used to perform monthly, quarterly, half-yearly, and annual measurements. The measures started in October 2022 and ended September 2023. To ensure the quality of the data, radon measurements were conducted according to UNI ISO 11665-4: 2021 standard [33] at the Lab. RAD radioactivity laboratory that has certification according to the ISO 9001:2015 [34] standard and accreditation according to the European Standard EN ISO/IEC 17025 [35]. In general, in order not to record the thoron contribution, CR-39s were placed about 20 cm from the interior wall, and also to reproduce a typical breathing zone, they were placed at a height between 0.8 and 2 m. In addition, to ensure the accuracy of the measurement, the detectors were placed away from ventilation systems (both hot and cold), doors, windows, and electrical devices. To evaluate the radon concentration, after the exposure, the detectors were chemically etched using a solution of 6.25 M NaOH at 98°C ± 1°C for 60 min. Then, using the Politrack system, automatic track density counting was performed [36].
N represents the track density corrected by background track density (about 10 tracks/cm2), E is the calibration factor, and T is the exposure time (in hours). The calibration factor was determined by exposing the detectors under a certified atmosphere in the range of exposure from about 150 to 4700 kBq h/m3 at the National Metrological Institute (ENEA).
A comparison exercise coordinated by the German Federal Office for Radiation Protection (BfS) was used to ensure the overall quality of the procedure and the accuracy of the measures [37].
2.3. Measurements of Environmental Parameters
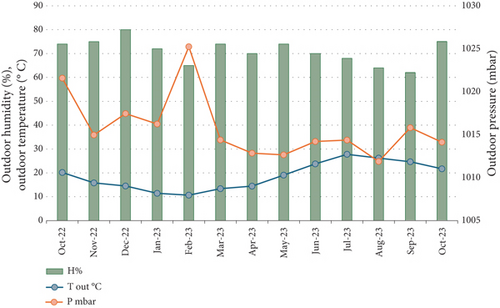
The environmental parameters were extracted from a database at the link [38], and the values of external temperature (degrees Celsius), external pressure (millibar), and external relative humidity (percentage) shown in Figure 1 concern the entire period of measurement of the indoor radon concentration.
2.3.1. Statistical Analysis
Continuous variables are reported as mean and standard deviations if normally distributed or as median and interquartile range (IQR) for nonnormal distributions. Outliers and measurements below the detector’s limits were not included in the analysis. To assess the normality of the distributions, the Shapiro–Wilk test was used while QQ plots were used to visually inspect the normality of the residuals and of the distributions. To investigate the effect of the different seasons and semesters on the log-transformed radon concentrations and evaluate the effect of the within-measurement point variability, a mixed-effects linear regression was used considering measurement points’ ID as random effect. For all analyses, p < 0.05 is considered statistically significant. The statistical analysis was conducted using STATA software and R statistical software version 4.3.1.
2.3.2. Lorentz Curve and Gini Coefficient
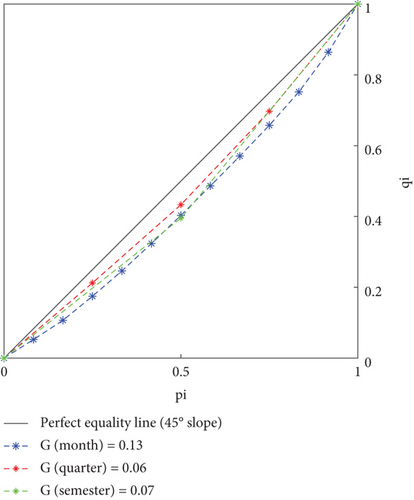
The Lorenz curve, typically used to represent income or wealth distribution, can also be applied to analyze the seasonal variability of radon levels. When applied in this context, it illustrates the distribution of radon concentrations over different times of the year.
- 1.
Collect data: Gather radon level measurements over a specified period, such as daily, weekly, or monthly readings, throughout the year.
- 2.
Sort data: Rank these measurements from the lowest to the highest radon concentrations.
- 3.
Calculate cumulative radon concentrations: Compute the cumulative percentage of radon concentrations (qi) corresponding to the cumulative percentage of time (pi).
- 4.
Plot the curve: On a graph, plot the cumulative percentage of time on the x-axis and the cumulative percentage of radon concentration on the y-axis.
The resulting Lorenz curve will illustrate how radon levels vary over time.
In particular, a 45° line from the origin (0, 0) to the point (1, 1) represents perfect equality, where radon concentration is constant throughout the year. Instead, if radon levels vary significantly with time, the Lorenz curve will bow further away from the line of equality.
3. Results and Discussion
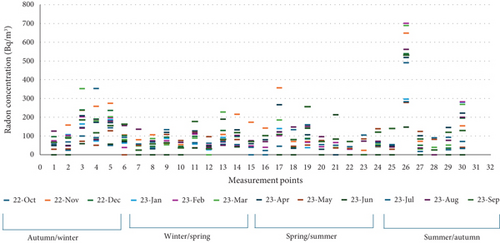
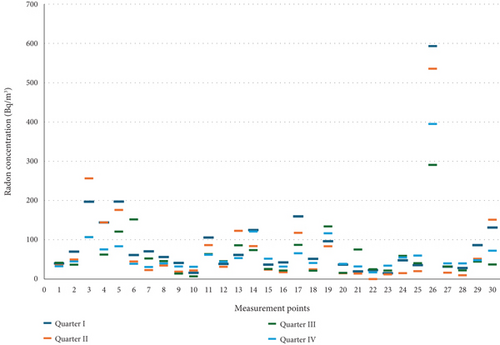
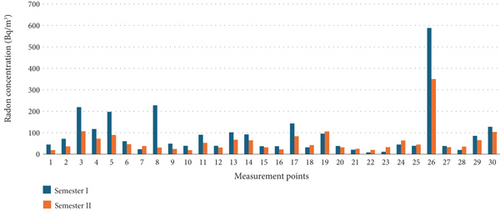
From the results acquired during monitoring, the reproducibility of radon measurements observed across monthly, quarterly, and half-yearly trends underscores the robustness of the data collection process, as reported in Figures 2, 3, and 4, respectively, and Table 1. This analysis allows for a comprehensive understanding of how radon levels fluctuate over various time scales, enhancing the reliability and depth of the study’s findings.
| Period | Median [IQR] indoor radon concentration (Bq/m3) | Mean (SD) log-transformed indoor radon concentrations | Tout (°C) | Pout (mbar) | Humidity (%) |
|---|---|---|---|---|---|
| October 2022 | 67 [54–93] | 4.33 (0.72) | 20 | 1022 | 74 |
| November 2022 | 93 [54–162] | 4.60 (0.79) | 16 | 1015 | 75 |
| December 2022 | 97 [50–192] | 4.71 (0.97) | 15 | 1017 | 80 |
| January 2023 | 97 [65–158] | 4.59 (0.70) | 11 | 1016 | 72 |
| February 2023 | 71 [47–128] | 4.47 (0.80) | 11 | 1025 | 65 |
| March 2023 | 88 [53–185] | 4.63 (0.82) | 13 | 1014 | 74 |
| April 2023 | 91 [49–152] | 4.52 (0.74) | 14 | 1013 | 70 |
| May 2023 | 75 [40–96] | 4.20 (0.58) | 19 | 1013 | 74 |
| June 2023 | 74 [50–144] | 4.41 (0.63) | 24 | 1014 | 70 |
| July 2023 | 61 [44–95] | 4.15 (0.61) | 28 | 1014 | 68 |
| August 2023 | 80 [70–137] | 4.53 (0.58) | 26 | 1012 | 64 |
| September 2023 | 91 [70–129] | 4.52 (0.67) | 25 | 1016 | 62 |
| Quarter I | 54 [37–103] | 4.09 (0.83) | 17 | 1018 | 76 |
| Quarter II | 34 [19–87] | 3.76 (1.04) | 12 | 1019 | 70 |
| Quarter III | 45 [25–75] | 3.82 (0.80) | 19 | 1013 | 71 |
| Quarter IV | 44 [35–65] | 3.94 (0.58) | 26 | 1014 | 65 |
| Semester I | 49 [38–102] | 4.08 (0.93) | 14 | 1018 | 73 |
| Semester II | 42 [32–68] | 3.84 (0.64) | 23 | 1014 | 68 |
| Year | 38 [23–80] | 3.74 (0.82) | 18 | 1016 | 71 |
Figure 2 shows the indoor radon concentrations obtained for monthly measurements for each individual dwelling. For some apartments, it was not possible to record the monthly measurement for all 12 months due to concentration values below the detection limit. This unfortunately represents a possible limit of CR-39 which is characterized by a slightly lower sensitivity than, for example, LR-115 detectors [41]. For the values obtained in the quarters and shown in Figure 3, only for one detector, Measurement Point 22 (the second quarter), was a concentration value lower than the detection limit obtained (9 Bq/m3). From Figures 2 and 3, it is immediately observed that the monthly measurements are affected by a greater variability than the quarterly ones. Indoor radon concentrations tend to be higher during the colder months compared to the warmer ones. This is often attributed to factors such as reduced ventilation in buildings during winter, leading to the accumulation of radon gas indoors. In particular, Figure 4 shows the results obtained, for each single measurement point, over two consecutive semesters (autumn/winter and spring/summer). Descriptively, it is possible to observe that in almost all cases the indoor radon concentration values are higher in the cold period (first semester) than in the hot period (second semester). In nine cases in which this trend is not evident and/or is not confirmed, the concentration values over the two semesters are comparable within uncertainty. Furthermore, in Figures 2, 3, and 4, it is observed that Site 26 shows indoor radon concentration values higher than all the other measurement points. The measurements were performed on a randomly chosen sample, taking into account the availability of private individuals. The only common feature of all measurement points was the building material, concrete. The factors that influence the concentrations are different, such as geology, lifestyle, and ventilation, which however have not been studied in this work.
As widely documented in the literature, the distribution of indoor radon concentration values follows a log-normal pattern. The figure shows the trends for the first showed in Figure 5a and second semesters showed in Figure 5b, for which the log-normal distribution was confirmed using a Shapiro–Wilk test (p = 0.573 for quarters, p = 0.148 for semesters). Mean multiple comparisons of log-transformed concentrations showed no significant difference between the semesters’ measurements nor between the quarters’ measurements. This appears to be explained by the measurement points variability, which is influenced by internal and external factors. In fact, mixed-effects regressions revealed a great effect of within-measurement points variability both for quarter and semester values. Concerning quarters, random-effect standard deviation of the log-transformed radon concentration was 0.65 and ICC was 0.71, while for semesters, random-effect standard deviation was 0.68 and ICC was 0.73. Concerning the variance explained by the fixed effect, that is., quarters and semesters estimated separately, marginal R2 were only 0.01 and 0.02, respectively. Figure 6 represents the caterpillar plots of the random effects for the two models. By visual inspection, it is not only evident the large mean variation for most of the measurements points but also that lower and higher floors (0, 0-h, 4, and 6) show a generally higher variability while middle floors (from 1 to 3) show a generally smaller variation.
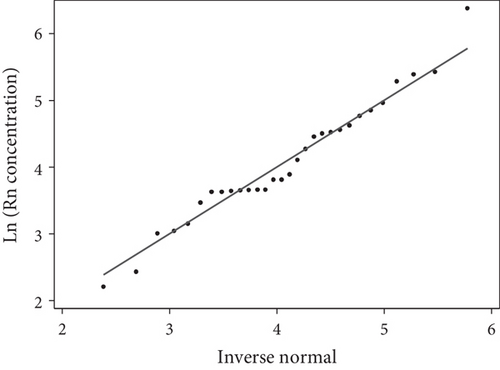
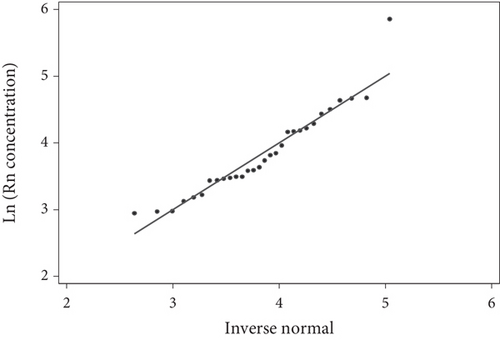
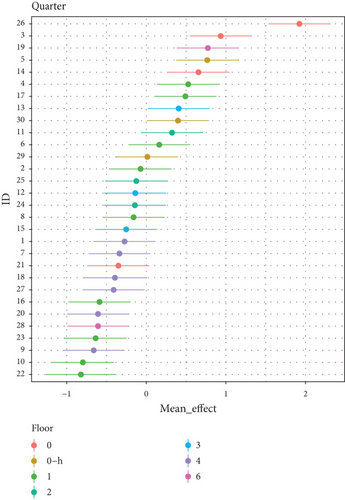
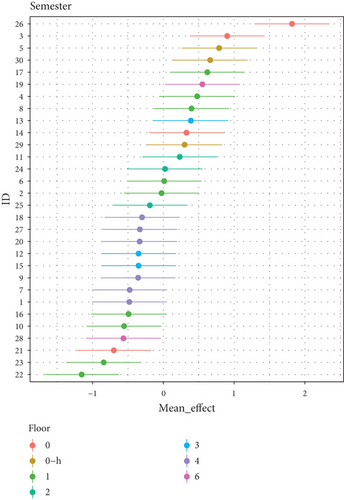
Figure 7 shows the seasonal variability in radon concentration to monthly (blue dots), quarterly (green dots), and semiannual measurements (red dots). The Gini coefficient is comparable for quarterly and half-yearly assessments, 6% and 7%, respectively; instead, the Gini coefficient for monthly measurements is different, 13%, and this can be attributed to several factors. Quarterly and semiannual measurements average out short-term fluctuations and provide a more stable estimate of radon levels. Monthly measurements, however, capture more of the short-term variability, leading to higher disparity in the data. The radon concentrations often exhibit clear seasonal trends, with higher levels in colder months due to reduced ventilation in buildings. Quarterly and semiannual measurements are better at capturing these seasonal trends, resulting in more consistent inequality (as measured by the Gini coefficient) compared to monthly data, which might miss these broader trends due to their shorter time span. Longer measurement periods smooth out anomalies and extreme values, reducing variability. This smoothing effect leads to a distribution of measurements that is more evenly spread, resulting in a Gini coefficient similar for both quarterly and semiannual data. These factors together explain why the Gini coefficient for quarterly and semiannual radon measurements shows less variability compared to monthly measurements.
4. Conclusion
To date, the only national radon concentration measurement campaign in Italy was conducted in 1996 [42]. Most subsequent studies focused at the local or regional level [19, 37, 43]. No new national surveys are currently planned. To evaluate seasonal variability of the indoor radon concentration, the measurements were conducted in 30 residences in Campania, Southern Italy, using approximately 570 CR-39 detectors. The measurements were taken monthly, quarterly, semiannually, and annually. The results indicated higher radon concentrations during the colder periods and lower concentrations during the warmer periods, as widely documented in the literature [44–47]. Only for a few measurement points is this trend not evident, showing values of radon concentrations, obtained in the two semesters, comparable within uncertainty. It is essential for homeowners to be aware of this seasonal variation and to take necessary measures to mitigate radon exposure, especially during the colder seasons. To assess the trend of these concentrations, an analysis using the Lorenz curve and the Gini coefficient was performed. The findings showed a similar trend with G values of 6% and 7% for the quarterly and semiannual measurements, respectively, compared to 13% for the monthly measurements. This result could be attributed to the greater variability in short-term radon measurements, as monthly data may capture more transient fluctuations in indoor radon levels caused by daily weather changes, building ventilation practices, and occupant behavior. In contrast, quarterly and semiannual measurements tend to average out these short-term variations, leading to a more stable and uniform distribution. Seasonal fluctuations in radon concentrations have direct implications for both human health and the design and building of living environments. The seasonal fluctuations observed in the monthly estimate (13%) highlight periods of increased exposure, such as in winter, when natural ventilation is reduced. This could increase the risk associated with radon exposure. In addition, this variability could also have an impact on the design of working and living environments, highlighting the need for forced ventilation systems that are activated when necessary.
Conflicts of Interest
The authors declare no conflicts of interest.
Funding
No funding was received for the present study.
Acknowledgments
The authors would like to thank the people who allowed radon concentration measurements at their homes and contributed to the realization of this work.
Open Research
Data Availability Statement
The data presented in this study are available on request from the corresponding authors.


