Thermal Comfort Assessment of an Indoor Swimming Pool in a Hot Climate: A CFD and HAP Simulation Study
Abstract
This study thoroughly investigates thermal comfort conditions within an indoor swimming pool in a desert climate resembling the climatic conditions of regions like Qatar, known for its scorching summers and mild winters. The research focuses on a 17.6 × 11.7 m indoor swimming pool, assessing its response to extreme outdoor conditions: 43.3°C dry-bulb temperature and 33.3°C wet-bulb temperature for summer, and 17°C dry-bulb temperature and 10.6°C wet-bulb temperature for winter. Design considerations maintain indoor temperatures in the range of 24°C–29°C year-round, aligning with ASHRAE Handbook recommendations for indoor swimming pools. The study encompasses a comprehensive analysis, including the calculation of pool evaporation rates and the resulting latent heat load gain. Hourly Analysis Program (HAP 4.9), a specialized cooling load calculation program, was employed to determine the essential thermal load required to maintain optimum indoor conditions. Computational fluid dynamics (CFD) simulations, employing ANSYS Fluent 19.2 and incorporating standard turbulence and moisture content models following a meticulous grid independence study, were conducted. The results highlight distinct average indoor conditions for both summer and winter, encompassing parameters such as air temperature, air velocity, and relative humidity. The research outcomes, assessed using predicted mean vote (PMV) and predicted percentage of dissatisfied (PPD), indicate comfort in summer and slight warmth in winter, serving as a valuable reference for future research on desert pool and greenhouse designs, ultimately enhancing indoor environmental quality.
1. Introduction
The study of thermal performance in air-conditioned facilities significantly impacts daily efficiency and comfort. Achieving thermal comfort historically relied on high-energy consumption in cooling equipment, but this energy-intensive approach falls short due to specific air variable limitations [1]. Estimating cooling loads using simplistic factors can lead to unnecessary energy consumption. Thus, precise thermal load analysis is vital for a balanced approach. Recent HVAC research underscores the importance of indoor conditions and thermal comfort indices, essential for evaluating thermal comfort. Indoor air involves critical variables: temperature, velocity, and relative humidity (RH), assessed using predicted mean vote (PMV) and predicted percentage of dissatisfied (PPD) [2, 3]. Computational fluid dynamics (CFD) tools are used to simulate indoor conditions, but achieving an accurate representation of thermal comfort remains a challenging task [4]. Given the complexity of airflow and heat exchange in high-humidity environments, this study investigates the thermal comfort conditions of an indoor swimming pool in a hot and humid climate using a simulation-based approach. It examines seasonal variations in air temperature, velocity, and humidity distribution to determine their influence on occupant comfort and compliance with ASHRAE standards. The key research question guiding this study is, How do seasonal changes influence thermal comfort parameters and air distribution within an indoor swimming pool environment?
Thermal comfort indices like PMV and PPD were introduced by Fanger [5]. These indices have been applied to evaluate thermal comfort in a range of settings, including offices, aircraft cabins, metro stations, and more. Fanger’s model takes into account air variables such as air temperature, velocity, and RH [6–9]. Indraganti and Boussa [10] investigated thermal comfort in 10 office buildings in Doha, Qatar, with an air temperature of 24°C, while another study focused on a metro station hall with an average air temperature of 27°C [11]. Research on aircraft cabins indicated neutral thermal comfort (PMV 0.2) with 15% of occupants dissatisfied [12]. In other investigations, indoor conditions included air temperatures of 24°C–28°C and RH ranging from 50%–55% [12, 13]. Specific applications, like swimming pools, pose unique challenges in maintaining thermal comfort due to high humidity and latent loads from water evaporation. Studies exploring air variable distributions in such settings remain scarce [14, 15]. Numerous studies have explored how pool evaporation rates affect indoor swimming pool air quality. In a study by Elazm and Shahata [16] at San Stefano Grand Plaza in Alexandria, Egypt, different evaporation rates were tested. Measurements of RH and temperature were taken at three breathing zone levels from the pool deck: Level 1 (50 cm), Level 2 (100 cm), and Level 3 (200 cm). Turbulent airflow was assumed using the standard K-ε model, coupled with species transport for moisture content under steady-state conditions. The 2D domain was discretized into 8500 cells with a convergence criterion of 0.000001. Boundary conditions included walls set to a constant temperature of 25°C, an inlet air velocity of 1.26 m/s, and a supply air temperature of 27°C. Simulation contours showed air velocity peaking at 0.2 m/s at an evaporation rate of 1 kg/s and 1 m from the pool basin surface. Conversely, temperature and mass fraction of water vapor peaked at 0.5 m height with an evaporation rate of 3 kg/s. The study emphasized the direct proportionality between evaporation rate and mass fraction of water vapor, along with an inverse relationship between RH, air temperature, and increased air velocity, suggesting that the rise in evaporation rate was due to the minimal temperature difference between the water surface and indoor air. In a study conducted by Caruso et al. [17] at the “Città dello Sport” competition swimming pool in Rome, various challenges were identified in accurately estimating the peak thermal load. These challenges stemmed from the complex structural design, solar radiation effects, heat dissipation from electrical equipment, and occupant loads. The study employed CFD simulations for both winter (with the HVAC system off) and summer (with the HVAC system on). The findings revealed that during winter simulations, there was a noticeable accumulation of hot air in the upstream spectator areas. Conversely, summer simulations indicated higher air velocities and temperatures in the occupied zone. This emphasized the significant role of the HVAC system in humidity control during the winter season and highlighted the need for precise estimations of lighting, solar radiation, and occupant load during the summer. As a result, the study recommended maintaining air temperatures within the range of 26°C–29°C for normal operation and 28°C for competitions. These recommendations align with ASHRAE standards to ensure optimal thermal comfort. Ciuman et al. [18–20] extensively studied indoor conditions and airflow in a school’s indoor swimming pool in Gliwice, Poland, as depicted in Figure 1. The research compared numerical simulations with experimental data, focusing on critical parameters like temperature, air velocity, and RH. Results showed a deviation of 0.11 m/s at a 0.1 m height across three seasonal cases. In Case 1, the measured indoor air temperature ranged from 26.3°C to 27.8°C, aligning closely with simulated results, differing by only 0.1°C. Conversely, in Case 2, the simulated air temperature was 0.4°C lower than the measured range of 25.3°C–25.8°C. In Case 3, a minor absolute error of 2.2% in RH was observed at a 0.1 m height, with a numerical temperature discrepancy of 0.8°C higher than the measured temperature. Contour plots illustrating RH, temperature, and air velocity from the numerical analysis are presented in Figure 2.


The validated physical model by Ciuman and Lipska [18] formed the basis for this study, ensuring precision. Cooling load calculations were then tailored to fit Qatar’s hot and arid conditions using this model. The resulting data, including critical parameters like supply air temperature and airflow rate, set the fundamental boundary conditions for subsequent CFD simulations, covering summer and winter scenarios. Detailed boundary conditions for the present numerical computations are discussed thoroughly in the methodology section. Contour plots illustrating air temperature, air velocity, and RH are presented in the results section, with average values cross-verified against ASHRAE standards for indoor conditions. ASHRAE Standard HVAC application (Chapter 6: “Indoor Swimming Pools”) outlines design indoor conditions for swimming pools, suggesting an air temperature range of 24°C–29°C throughout the year and RH levels between 50% and 60% in summer and 40% and 60% in winter. It also recommends air velocity to be within 0–1 m/s, aligning with ASHRAE Standard 55 for thermal comfort, a key factor in Fanger’s model. Notably, no previous study has conducted a thorough examination of indoor conditions and thermal comfort for swimming pools in hot and humid Middle Eastern environments, such as Qatar. This distinctive aspect enhances the significance of the present study, centered on an indoor swimming pool in Doha, Qatar, offering a promising opportunity to unveil previously unexplored insights and findings.
While previous studies have explored thermal comfort in various indoor spaces, they primarily focused on offices, metro stations, and aircraft cabins, where humidity and latent loads differ significantly from swimming pools. Studies by Elazm and Shahata [16] and Caruso et al. [17] examined evaporation effects and HVAC strategies but used simplified boundary conditions and steady-state assumptions, limiting their applicability to dynamic environments. Ciuman and Lipska [18] validated a numerical model for indoor swimming pools but focused on temperate climates, whereas the present study extends this analysis to the extreme heat and humidity of the Middle East. To bridge these gaps, this research employs a simulation-based approach using CFD and an Hourly Analysis Program (HAP) to assess seasonal variations in indoor swimming pool environments, ensuring compliance with ASHRAE standards.
However, the analysis is limited to a single swimming pool configuration, meaning the results may not fully generalize to pools with significantly different designs or operational parameters. Additionally, while the simulations incorporate validated boundary conditions, certain real-world factors, such as occupant movement and dynamic heat loads, are simplified for computational feasibility. These limitations highlight the need for future research to expand the scope and validate findings across varied settings.
- •
Calculate cooling load and verify evaporation rate: conduct precise cooling load calculations and verify pool basin evaporation rates. Additionally, validate all boundary conditions using the air change per hour (ACH) method [21], providing a strong foundation for further analysis.
- •
Utilize CFD modeling for airflow and air variable capture: use CFD modeling for detailed analysis of airflow distribution, encompassing air temperature, velocity, and RH in both summer and winter.
- •
Conduct thermal comfort analysis using PMV and PPD indices: perform comprehensive thermal comfort analysis using PMV and PPD indices for winter and summer, offering insights for optimizing indoor conditions.
2. Research Methodologies
2.1. Geometry Modeling
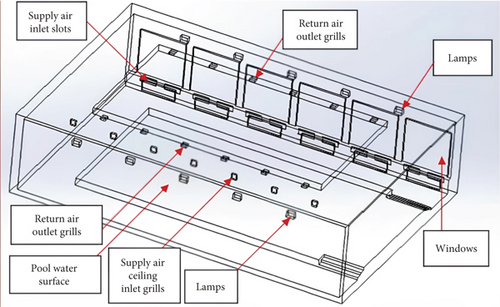
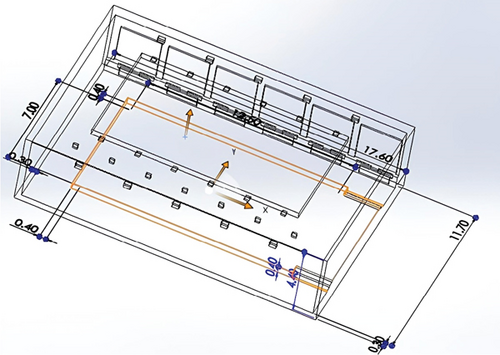
The physical model of the swimming pool was meticulously constructed utilizing SOLIDWORKS computer-aided design (CAD) software, ensuring precision and accuracy in design. The pool’s dimensions were set at 17.6 × 11.7 × 4.4 m (length × width × height). The pool basin adhered to a regular rectangle shape measuring 12.5 × 7 × 1.36 m (length × width × depth), as illustrated in Figure 3a. To align with the scope of this study, the variables employed were consistent with those reported in [18], with the notable exception of location, which was adapted to the context of Qatar. A perimeter wall, rising 40 cm above the ground, encircled the pool basin, contributing to the overall structure and containment. Within the pool facility, walls were considered internal partitions, segregating different areas for functional purposes. Notably, two walls, specifically those facing the northwest (NW) and southwest (SW), were exposed to the external environment, necessitating strategic considerations for thermal dynamics. On the SW-exposed wall, six windows, each measuring 2.5 × 2.5 m, were incorporated. To ensure adequate lighting, four 250-W bulbs were strategically mounted on the high wall above the windows. Additionally, radiators were integrated below the windows on the low wall, with six radiators oriented to optimize heat distribution. Two more radiators were positioned, orienting toward NW, ensuring efficient temperature control. Ceiling intake grills, measuring 0.28 × 0.0975 m, were meticulously placed to supply air in the direction of the northeast (NE) side. Complementing this, inlet slots (0.87 × 0.019 m) were strategically positioned below the windows to supply air parallel to the window glazing, offering an alternative method for air circulation. To complement the inlet configuration, return air was horizontally exhausted through outlet grills measuring 0.28 × 0.0975 m, strategically positioned at the center of the drop-down ceiling. The swimming pool model, with its fixtures and components, is vividly represented in Figure 3b, presenting a comprehensive view of the setup and the meticulous placement of various elements within the swimming pool facility.
2.2. Thermal Loads
Swimming pools present a unique challenge in regulating humidity and indoor air temperature, particularly in arid and humid regions like Qatar within the Middle East. In such locations, extreme external conditions prevail, with summer experiencing a dry-bulb temperature (DBT) of 43.3°C and wet-bulb temperature (WBT) of 33.3°C, while winter sees a DBT of 17°C and WBT of 8.6°C. Given these conditions, the impact of cooling is a significant consideration in HVAC applications for such spaces [22]. To calculate the estimated thermal loads in the pool, HAP 4.9, a specialized cooling load calculation program, was employed. Thermal loads were classified into three categories, following the ninth edition of the ASHRAE Pocket Guide: internal, external, and infiltration [23, 24]. The thermal analysis considered both external and internal loads. External loads encompassed heat transfers between the outdoor environment and structural elements, such as the roof, walls, glass, ceiling, and interior partitions. U-values were employed to calculate these loads as specified in the KAHRAMAA Conservation Code [25] and the Qatar Construction Standard (QCS) [26]. Internal loads included heat dissipated by occupants, lighting, equipment, and appliances within the indoor space. Lamps and radiators were added as indirect internal loads. The facility operated from 8 AM to 6 PM for 13 h daily between September and June. Occupant density data from ASHRAE Standard 62.1’s Table 6.1 was used to calculate the occupant load, while infiltration load was disregarded due to its minimal impact on thermal loads [27]. A maximum of seven people were accommodated in the play area, categorized with an occupant density of 0.07 m2 per person. The latent load of the pool basin was deemed crucial in attaining the indoor design conditions necessary for thermal comfort. This load was primarily driven by pool water evaporation, stemming from temperature disparities between the water surface and the indoor air, significantly contributing to increased thermal load and humidity within the swimming pool area. In line with Smith et al. [28] and ASHRAE application guidelines, the evaporation rate was determined to be 0.005565 kg/s (equivalent to 13.541 kW) using Equation (1) [29]. The total cooling load calculations were completed, and the system’s specifications were defined in HAP, as detailed in Table 1. Specifically, the air handling unit (AHU) was set to maintain indoor conditions of 23.5°C and 50% RH, aligning with ASHRAE standards. Furthermore, the supply air temperature of air outlets was optimized to attain the required indoor environmental conditions, set at 19.8°C.
| Parameter | Value | Reference |
|---|---|---|
| Occupant load | 14 persons | Table 6.1, ASHRAE Standard 62.1 (category: play area) [27] |
| Miscellaneous loads |
|
Natatorium, ASHRAE Applications Handbook 2019 (Equation (1)) [29] |
| Lighting power density (LPD) |
|
Table 2 Lighting power densities table using space by space method, ASHRAE Fundamentals Handbook [30] |
| External wall U-value |
|
Kharama energy and water conservation code [25] |
| Roof U-value |
|
Kharama energy and water conservation code [25] |
|
|
Qatar Construction Standards (QCS) [26] |
| Outdoor conditions (summer/winter) |
|
Sleiti et al. [22] |
2.3. CFD Model and Mesh
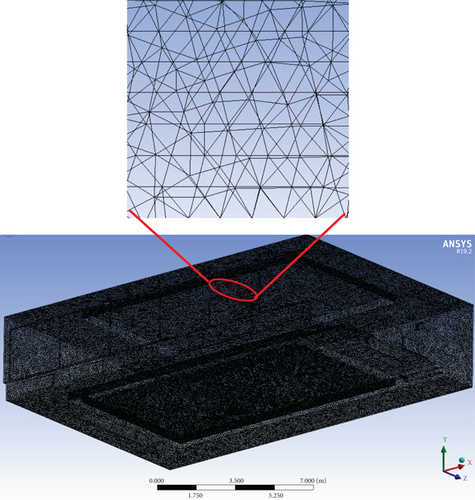
| Meshing cell size | Tetrahedral |
|---|---|
| Growth rate | 1.2 |
| Orthogonal quality (maximum–minimum) | 0.99–0.19 |
| Skewness (maximum–minimum) | 0.88–0.00036 |
| Number of elements | 1,869,824 |
| Domain element | Boundary condition |
|---|---|
| Ceiling inlet grills | Mass flow inlet |
| Inlet slots | Mass flow inlet |
| Ceiling outlet grills | Pressure outlet |
| Water surface | Mass flow inlet |
| Lighting | Wall–heat flux type |
| Northwest wall | Wall–heat flux type |
| Southwest wall | Wall–heat flux type |
2.4. Grid Independence Test
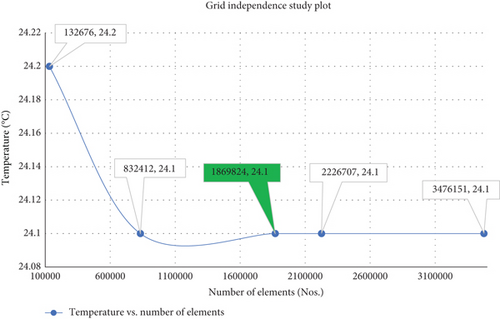
To ensure the robustness and independence of the numerical results from mesh size, five meshing tests were systematically conducted on the model. The objective was to confirm that the outcomes remained consistent irrespective of variations in mesh size. In Figure 5, a plot illustrating the average temperature values calculated over the volume of the domain for each specified number of elements in the five distinct mesh sizes is presented. It is evident from the plot that, as the number of elements increases, the average temperature stabilizes at 24.1°C starting from 832,412 to 3,476,151 cells. The smallest mesh size utilized in the mesh validation process, consisting of 132,676 cells, yielded a temperature value of 24.2°C. This insight showcases the stability and reliability of the numerical results with varying mesh densities. Based on the outcomes depicted in Figure 5, a mesh comprising 1,869,824 cells was deemed optimal, consistently yielding an average temperature of 24.1°C. Consequently, this mesh size was selected for presenting the results via contour planes in the subsequent results and discussion sections of this study.
2.5. Thermal Comfort Indices
| Parameter | Summer season | Winter season |
|---|---|---|
| M (W/m2) | 116.4 | 116.4 |
| Icl (m2.°C/W) | 0.3 clo (0.0465m2.°C/W) (undergarment, T-shirt, and shorts) | 0.9 clo (0.1395 m2.°C/W) (shirt, trousers, and V-neck sweater) |
| ta (°C) | Computed numerically | Computed numerically |
| (°C) | ta (°C) +2.8°C [5] | ta (°C) +2.8°C [5] |
| va (m/s) | Computed numerically | Computed numerically |
| pa (Pa) | Computed numerically | Computed numerically |
| hc (W/m2.°C) | 8.725 | 7.653 |
| tcl (°C) | 30.56 | 28.81 |
- Note: PMV index scale: hot (+3), warm (+2), slightly warm (+1), neutral (0), slightly cool (−1), cool (−2), and cold (−3). Recommended range for thermal comfort: PMV (−0.5 < PMV < 0.5) and PPD < 10%.
3. Results and Discussion
The primary objective of the CFD simulations was to comprehensively investigate the thermal comfort and indoor conditions within swimming pools situated in the challenging climatic conditions of Qatar, characterized by a hot and humid desert climate. The simulations relied on precise boundary conditions and variables, ensuring a robust analysis of the indoor environment. To establish the boundary conditions for air supply flow rate and humidity ratio, the results of the cooling load calculations obtained through HAP Carrier software were referred to. These outcomes formed the foundation for defining the supply air conditions utilized in the CFD simulations. Specifically, these conditions were applied to the inlet slots and ceiling inlet grills. In order to verify the airflow rate for the simulations, adherence to the recommendations laid out in ASHRAE standards for indoor swimming pools [29] was maintained. According to ASHRAE standards, the rate of ACH serves as a key parameter in determining the airflow rate necessary for maintaining appropriate indoor conditions. Calculations led to an ACH rate of 5, falling within the suggested range of 4–6 ACH for swimming pool spaces.
It is important to note that the numerical calculations and simulations covered scenarios for both summer and winter seasons. For the winter case, even though the heating load was relatively low, the airflow rate was considered infiltration to ensure a holistic analysis of the indoor environment. The numerical analysis was carried out meticulously, spanning 2000 iterations, with the convergence criteria set at 0.001 to guarantee robust and accurate results. The results obtained for key air variables, including air velocity, air temperature, and RH, remained remarkably consistent across different contour planes at heights of 0.1, 0.6, 1.1, and 1.7 m.
As a result, the chosen presentation includes contour planes at the height of 0.6 m, which provide a representative depiction of air velocity, air temperature, and RH. These contour planes visually represent indoor conditions in both summer and winter, aiding in the understanding of thermal comfort in the swimming pool facility. Table 5 summarizes air system specifications for the CFD study, including airflow rate, supply air temperature, and humidity ratio for both seasons.
| Air system specification (numerical simulation inputs) | |
|---|---|
| Airflow rate (m3/s) |
|
| Air temperature for supply air inlet (°C) |
|
| Humidity ratio for supply air inlet (kgdw/kgda) |
|
3.1. Validation and Error Mitigation in CFD Model
The validation process compared the CFD simulation results against experimental measurements and numerical results by Ciuman and Lipska [18]. Figure 6 demonstrates the mean air velocity, mean air temperature, and mean RH at various heights (0.1, 0.6, 1.1, and 1.7 m), with comparisons across all parameters.
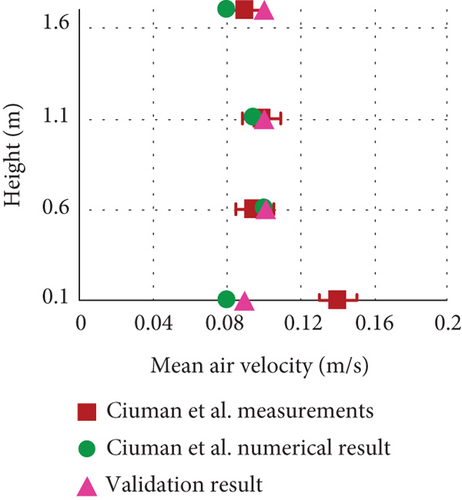
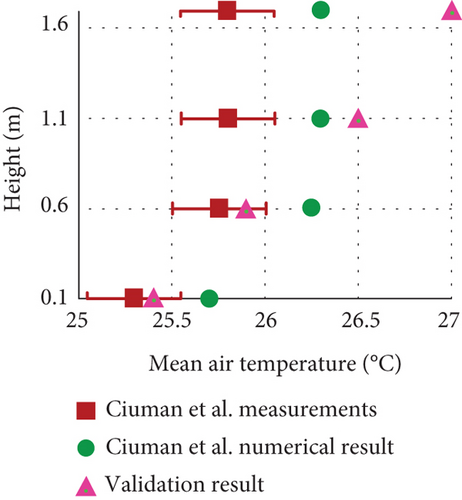
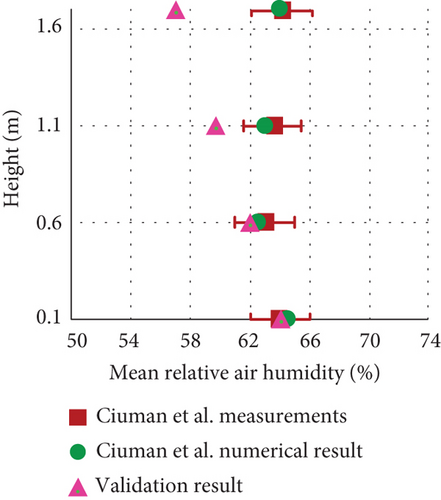
The validation results confirm the CFD model’s reliability in predicting key parameters, including air velocity, air temperature, and RH, when compared with experimental and numerical data from Ciuman and Lipska [18]. Air velocity predictions showed errors ranging from 0.3% to 12.1% against numerical data, with the most accurate results observed at 0.6 m. Larger deviations relative to experimental measurements, particularly at 0.1 m, can be attributed to the complexity of turbulent flow near the pool basin and localized boundary effects [20].
Predictions for air temperature demonstrated high accuracy, with deviations between 0.4% and 4.7% compared to numerical data and 1.2%–2.7% against experimental results. These outcomes confirm the model’s capability to capture temperature distributions accurately, especially at mid-level and upper heights.
RH predictions exhibited higher deviations, with errors reaching 11.3% for numerical results and 10.9% for experimental values at certain heights. These differences are likely due to the simplified representation of latent heat and evaporation processes, which are inherently challenging to simulate in high-humidity environments.
The model’s accuracy in air velocity, temperature, and RH confirms its robustness in evaluating thermal comfort, with deviations justified by environmental complexities.
Potential sources of error or uncertainty in the analysis were identified and mitigated to ensure robust findings. One key source of uncertainty arises from assumptions made in the CFD model, such as steady-state conditions and simplified latent heat transfer dynamics, which may not fully capture transient effects in real-world settings. To address this, validated evaporation rate equations from ASHRAE guidelines were used to calculate latent heat contributions, and mesh refinement techniques ensured accurate spatial resolution of airflow and thermal variables.
Measurement precision during validation also posed potential uncertainties, particularly for parameters like RH, where deviations were observed at lower heights near the pool basin. This was mitigated by employing a detailed experimental setup with multiple data points for averaging and cross-validation with numerical simulations.
Furthermore, occupant behavior and activity, which can vary significantly in operational swimming pools, were standardized using ASHRAE-recommended activity factors and occupancy densities. While these assumptions streamline the analysis, they may introduce minor discrepancies compared to real-world conditions.
Acknowledging these uncertainties and employing mitigation strategies, the findings of this study remain robust and provide a reliable framework for analyzing thermal comfort and indoor conditions in swimming pool environments.
3.2. Summer Case Results
During the scorching summer conditions, the swimming pool’s air conditioning system operates in cooling mode, a crucial prerequisite for maintaining the desired thermal comfort and indoor conditions. Conversely, in the winter season, a different approach is taken as the heating load is found to be considerably lower than the cooling load, as discussed in Table 1 on thermal loads. A close examination of the velocity contours, as depicted in Figure 7a, reveals notable patterns. High-velocity regions, ranging from 0.67 to 1 m/s, predominantly encircle the pool basin, with an overall average velocity of 0.44 m/s across the contour planes at various heights (0.1, 0.6, 1.1, and 1.7 m). It is important to note that all velocity contour values fall well within the established range of velocities outlined in thermal comfort criteria, which spans from 0 to 1 m/s. Particularly, the velocities above the pool basin range from 0.1 to 0.3 m/s, a range deemed comfortable for swimmers, a conclusion supported by the research of Elazm and Shahata [16] and Lebon et al. [38]. In the majority of regions, velocities fall within the 0.3 to 0.5 m/s range, resulting in an average velocity of 0.4 m/s, consistent with the findings in Caruso et al.’s research [17]. An intriguing observation is the increased turbulence in the velocity contours during the summer season compared to the winter season. This heightened turbulence can be attributed to the higher airflow rate supplied during the hot summer months. It is worth noting that this pattern remains consistent across all measured heights (0.1, 0.6, 1.1, and 1.7 m), signifying uniform and turbulent flow distribution throughout the space. The indoor temperature distribution, as illustrated in Figures 7b and 8a, offers an enlightening perspective. The data points to a uniform and consistent temperature throughout the indoor space, with an average air temperature of 24°C maintained across all contour planes (0.1, 0.6, 1.1, and 1.7 m).
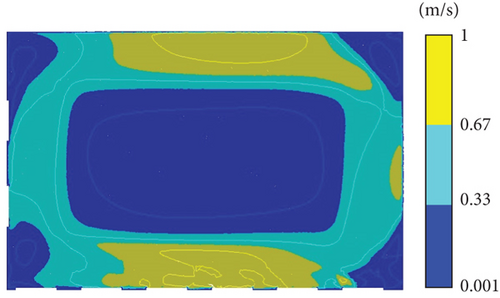

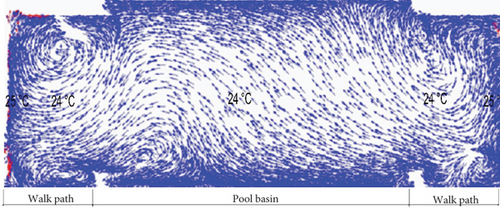
Remarkably, minimal temperature variation exists between individual contour points, indicating a temperature fluctuation of just a few degrees Celsius. This pattern underscores the remarkable temperature uniformity within the room. Notably, the internal wall demonstrates slightly elevated temperatures, with a temperature of 30°C that gradually decreases to 25°C within the layers of the air stream near the wall. It is of paramount importance to note that the computed average temperature aligns with the recommended temperature range for swimming pools, falling between 24°C and 29°C.
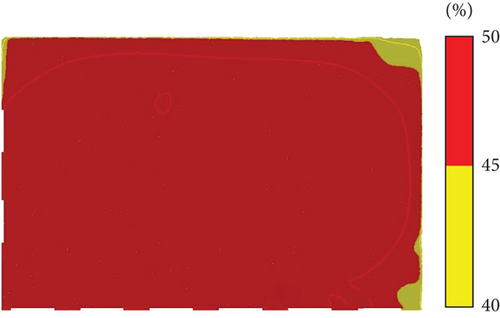
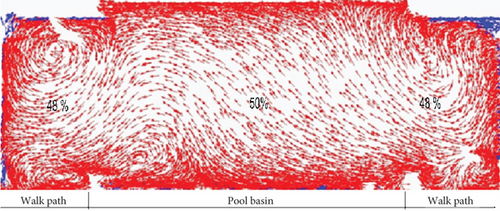
In contrast to the temperature variations discussed earlier, average RH contours revealed an equilibrium across space, with a consistent 50% RH observed at all heights, as evident in Figures 7c and 8b. RH decreased marginally, reaching 48%, primarily near the walls. Small localized areas near the corner walls exhibited an RH range of 40%–45%. These RH contours signify the air conditioning system’s effectiveness in mitigating the latent load arising from water evaporation in the pool basin.
It is essential to highlight that the average RH of 50% aligns with ASHRAE standards, specifically the ASHRAE Handbook’s HVAC Application Chapter 6 on indoor swimming pools. This RH value falls within the lower limit of acceptable indoor conditions for swimming pools, as defined in the range of 50%–60%. A study conducted by Lebon et al. [38], however, presented contrasting findings with higher RH levels exceeding ASHRAE’s recommended range. These elevated RH values were attributed to the excessively high humidity ratio of the supplied air. Figure 8a,b is meticulously generated to provide a clear visualization of the uniformly distributed airflow throughout the entire space, devoid of any stagnant air regions. This uniform airflow distribution plays a pivotal role in achieving thermal comfort within the pool area. The analysis conclusively verifies that thermal comfort conditions have been successfully achieved with minimal variations. The PMV and PPD indices were used to evaluate thermal comfort in the indoor swimming pool environment, yielding consistent results. The PMV value, computed at +0.13, indicates a neutral thermal sensation, meaning occupants neither perceive a cold nor a hot environment. The PPD values range from 5.5% to 5.7%, implying that at least 94.3% of occupants experience a high level of comfort. These results highlight the uniform airflow distribution achieved in the pool area, a critical factor in maintaining consistent indoor conditions. The findings, summarized in Table 6, emphasize the design’s effectiveness in meeting thermal comfort criteria while maintaining minimal variations across the pool area.
| Height (m) | Average air temperature (°C) | Average air velocity (m/s) | Average relative humidity (%) | PMV index | PPD (%) |
|---|---|---|---|---|---|
| 0.1 | 24 | 0.28 | 47.3 | +0.13 (neutral) | 5.7 |
| 0.6 | 24 | 0.4 | 47.7 | +0.13 (neutral | 5.5 |
| 1.1 | 24 | 0.44 | 47.7 | +0.13 (neutral) | 5.5 |
| 1.7 | 24 | 0.49 | 47.5 | +0.13 (neutral) | 5.6 |
- Note: Indoor conditions and thermal comfort limitations: air temperature: 24 < ta < 29°C; air velocity: 0 < va < 1 m/s; relative humidity: 40 < RH% < 60; PMV index: +3 < PMV < −3; PPD: 0 < PPD < 100%.
3.3. Winter Case Results
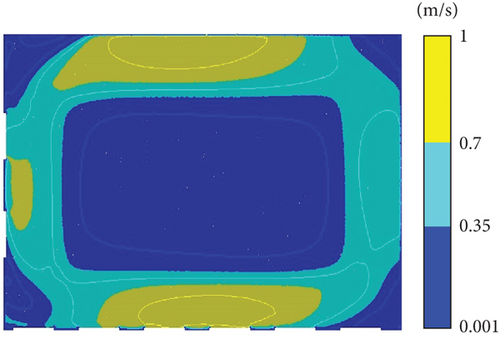
Air velocity is evenly distributed throughout space, as depicted in Figure 9a, without any significant deviations in the contour plane. Furthermore, the average velocities at heights of 0.1, 1.1, and 1.7 m were calculated to be 0.29, 0.45, and 0.49 m/s, respectively. The airflow within the pool basin displayed a gradual decrease in velocity from the pool basin’s edges toward its center, reaching an average velocity of 0.2 m/s. In contrast, the walking path situated between the edge of the pool basin and the room walls exhibited an air velocity of 0.4 m/s. This differentiation in air velocities between the walking path and the pool basin area is supported by the placement of the air inlets and outlets. The return air outlet is strategically positioned to exhaust air from the area above the pool basin, while the air inlets supply air above the walking path area. In the corner areas, where the supply air inlets are comparatively distant, air velocities were calculated at 0.2 m/s. The distribution of air velocity, averaging 0.4 m/s in the entire domain, conforms to the thermal comfort model’s requirements (0–1 m/s).
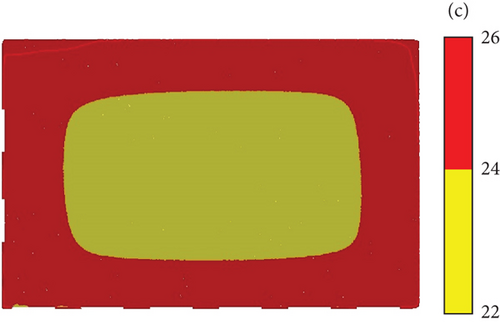
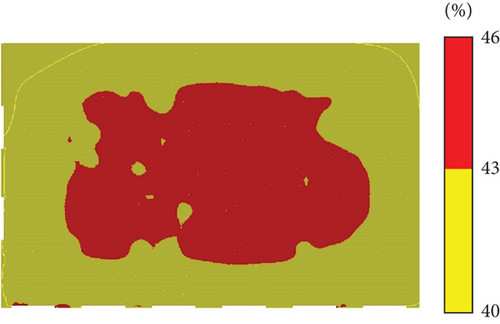
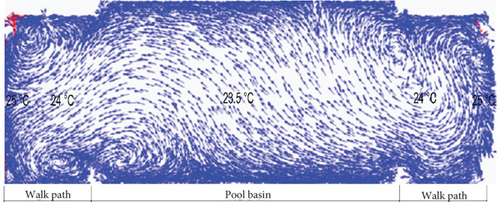
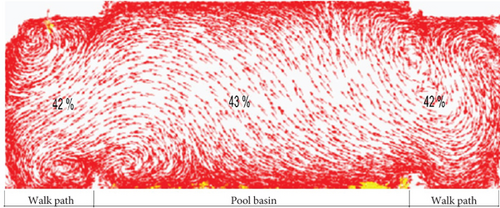
Average air temperature was calculated as 24.1°C for planes at heights of 0.1, 0.6, and 1.1 m, while a slightly higher temperature of 24.2°C was observed at a height of 1.7 m. Detailed analysis of temperature contours in the sectional view indicates that the walking path area maintained a temperature of 24°C, while the region above the pool basin displayed a temperature of 23.5°C, as shown in Figures 9b and 10a. This analysis suggests that no significant water surface evaporation occurred, as the temperature difference between the air (23.5°C) and the water surface (24°C) was minimal. Additionally, the temperature difference within the space was consistent, with only a 0.5°C variation between the walking path and the pool basin area, demonstrating the uniformity of air temperature contours. All boundary layers near the room walls exhibited an air temperature of 25°C, consistent with the influence of outdoor radiation load on the walls and windows. Consequently, the computed contours for air temperature conform to the prescribed range of indoor conditions (24°C–29°C) recommended for swimming pools by ASHRAE standards. RH contours and the sectional view, as presented in Figures 9c and 10b, exhibited elevated humidity regions above the pool basin due to increased moisture content arising from water evaporation at the pool basin surface. Above the pool basin, the RH ranged from 43% to 46%, whereas on the walkway, it measured slightly lower at 42%. The average RH varied among different horizontal planes (0.1, 0.6, 1.1, and 1.7 m), with values of 42.5% at 0.6 m and 42.6%, 42.5%, and 42.4% at 0.1, 1.1, and 1.7 m, respectively. These variations can be attributed to different outdoor conditions, indicating that the supplied air conditions were modified by reducing the supply humidity ratio during the winter season through the air conditioning system. Additionally, lower RH values indicate reduced moisture content within the space, thereby preventing condensation on structural elements such as windows and walls. Furthermore, the RH contours align with the recommended RH range for swimming pools in the winter season (40%–60% RH) as per ASHRAE standards. Figures 9a, 9b, and 9c provide strong evidence of uniform thermal conditions (comprising air velocity, temperature, and RH) as discussed earlier. Notably, there are no stagnant air regions apparent in any of the contour planes. The thermal comfort indices PMV and PPD were applied to the computed air variables across all planes, yielding consistent results. PMV values ranged from +0.73 to +0.76, indicating a “slightly warm” sensation that remains within acceptable comfort limits. The corresponding PPD values ranged from 16.7% to 17%, meaning approximately 83% of occupants were satisfied with the indoor environment during the winter season. These results, presented in Table 7, confirm the air conditioning system’s effectiveness in maintaining uniform and comfortable conditions across all measured heights, further demonstrating the model’s ability to achieve thermal comfort during seasonal variations.
| Height (m) | Average air temperature (°C) | Average air velocity (m/s) | Average relative humidity (%) | PMV index | PPD (%) |
|---|---|---|---|---|---|
| 0.1 | 24.1 | 0.29 | 42.6 | +0.73 (slightly warm) | 16.9 |
| 0.6 | 24.1 | 0.4 | 42.5 | +0.74 (slightly warm) | 16.7 |
| 1.1 | 24.1 | 0.45 | 42.5 | +0.75 (slightly warm) | 17 |
| 1.7 | 24.2 | 0.49 | 42.4 | +0.76 (slightly warm) | 17 |
- Note: Indoor conditions and thermal comfort limitations: air temperature: 24 < ta < 29°C; air velocity: 0 < va < 1 m/s; relative humidity: 40 < RH% < 60; PMV index: +3 < PMV < −3; PPD: 0 < PPD < 100%.
While this study specifically focused on indoor swimming pools in a hot and humid climate, such as Qatar, its findings have broader implications for indoor swimming pool environments across different climatic regions. The validated CFD model, combined with thermal comfort indices like PMV and PPD, offers a robust methodology for assessing air velocity, temperature, and RH in swimming pools globally.
In temperate regions, where heating requirements dominate during winter, the methodology can be adapted by modifying boundary conditions to account for increased heating loads. Conversely, in tropical regions with consistently high humidity, the insights on dehumidification and latent heat load management are directly applicable. Variations in design, occupancy patterns, and HVAC configurations in other regions may introduce unique challenges, but the study’s foundational approach provides a reliable starting point for tailoring solutions to local conditions.
Beyond thermal comfort, the findings contribute to energy efficiency and sustainability in HVAC system operation. Optimizing airflow distribution and humidity control through CFD modeling can reduce excessive heating or cooling demands, lowering energy consumption and operational costs. Seasonal air supply adjustments, as demonstrated in this study, can enhance HVAC performance while minimizing unnecessary energy use. Future research should explore integrating renewable energy sources, such as solar-assisted HVAC systems, to further improve sustainability in indoor swimming pool facilities. Additionally, applying the validated CFD model to diverse pool configurations and climatic settings can provide a more comprehensive understanding of thermal comfort across varied environments. These efforts will not only enhance the applicability of the findings but also support the optimization of energy-efficient HVAC systems for indoor swimming pools worldwide.
4. Conclusions
This study examined thermal comfort and indoor air quality within a validated indoor swimming pool in Qatar. A rigorous cooling load calculation established the supply air boundary conditions, verified through the ACH method. The study simulated air velocity, temperature, RH, and thermal comfort using PMV and PPD metrics.
The findings confirmed that the specified supply air conditions successfully delivered both thermal comfort and controlled humidity, mitigating condensation risks in Qatar’s hot and humid climate. The air temperature remained stable at 24°C across all heights, with velocities between 0.29 and 0.49 m/s, aligning with Franger’s thermal comfort model (0 m/s < V < 1 m/s). Summer RH averaged 50%, while winter RH was 42.5%, ensuring compliance with ASHRAE recommendations. The PMV values indicated neutral thermal sensations in summer (+0.13) and slightly warm sensations in winter (+0.73 to +0.76), with PPD values showing only 5.5% occupant dissatisfaction in summer and 16%–17% in winter due to lower humidity levels needed to prevent moisture-related issues.
Beyond swimming pools, this methodology applies to various climates and facilities such as sports centers, gyms, and spas, where humidity control is essential. It optimizes heating loads in colder regions and informs dehumidification strategies in tropical climates. Future research should explore solar-assisted HVAC systems to enhance sustainability and reduce energy costs, further advancing energy-efficient climate control solutions.
While this study provides a robust analysis of thermal comfort in a hot, humid environment, it assumes steady-state conditions and simplifies latent heat and evaporation effects, introducing uncertainties in RH predictions. Future work should refine evaporation models, incorporate transient occupant behavior, and expand CFD applications to varied pool designs and climates. Additionally, gender-specific thermal comfort variations could be explored by considering differences in metabolic rates and clothing insulation in Qatar’s gender-segregated swimming pools.
Disclosure
A preprint of this work has previously been published as Thermal Comfort Conditions of an Indoor Hot-Climate Swimming Pool by Houssameldin M. Mohamed, Abdellatif M. Sadeq, Ahmad K. Sleiti, and Samer Ahmed on Research Square [39].
Conflicts of Interest
The authors declare no conflicts of interest.
Funding
The authors would like to acknowledge the Qatar National Library for providing open-access funding for this research. No additional external funding was received for this study.
Acknowledgments
The authors would like to thank the Qatar National Library for providing open-access funding.
Open Research
Data Availability Statement
This study did not generate new data. All results presented in the manuscript are derived from computational simulations and analyses using ANSYS Fluent 19.2 and HAP 4.9 software. No external datasets were used, and no data is available for sharing.


