Comprehensive Investigation of Airborne Benzalkonium Ion Behavior Following Nebulization: Implications for Indoor Air Quality and Health Risk Assessment
Abstract
The COVID-19 pandemic has intensified the use of quaternary ammonium compound (QAC) disinfectants, raising concerns about potential health effects. This study investigated the airborne behavior of benzalkonium chloride (BKC), a common QAC, sprayed at 500 ppm for 4 min in a 105 m3 space using automatic and manual methods. Airborne BKC was collected via an air pump and quantified using LC-ESI-MRM/MS. Results showed that BKC concentrations peaked during spraying but rapidly decreased thereafter, becoming negligible within 8–12 min postspraying. Cumulative capture exhibited a sigmoidal trend with time, with maximum captures of 8.21 μg (front) and 1.36 μg (back) for automatic spraying, and 0.14 μg (front) and 0.29 μg (back) for manual spraying. The “exposure to spray model” was applied to determine parameters such as airborne fraction and settling velocity. Hazard quotients (HQs) were calculated based on the maximum cumulative captures, with all values remaining below 1, indicating minimal health risks. Specifically, for the automatic sprayer, HQs were 0.856 (front) and 0.142 (rear), while for the manual sprayer, they were 0.015 (front) and 0.030 (rear). The highest HQ of 0.856, observed for automatic spraying at the front location, suggests that some caution may be warranted in this scenario. The study demonstrates that while BKC concentrations can be significant during spraying, they decrease rapidly postapplication, leading to limited exposure risks. These findings provide valuable insights into the safe use of QAC disinfectants and their impact on indoor air quality, particularly relevant in the context of increased disinfectant practices during the COVID-19 pandemic.
1. Introduction
Quaternary ammonium compounds (QACs) play a significant role in public health by controlling bacteria that cause illnesses and are widely used as antiseptics, detergent, disinfectants, and preservatives [1, 2]. The importance of QACs has grown considerably during the COVID-19 pandemic due to their inclusion in cleaning products [3–6]. The effectiveness of QACs in deactivating and eliminating bacteria stems from their net positive charge, allowing them to interact with the negatively charged bacterial cell wall. Their long alkyl chains disrupt the bacterial phospholipid bilayer, ultimately leading to bacterial deactivation [7, 8].
While essential for preventing and controlling infections, QAC-containing products also pose significant health risks. These risks extend not only to those who handle them directly but also to bystanders, especially with long-term exposure [9–14]. Studies have linked QAC residues in human blood to increased inflammation, impaired mitochondrial function, and disrupted cholesterol synthesis [9]. Furthermore, occupational exposure to QAC-containing disinfectants leads to occupational asthma due to their respiratory-sensitizing properties [10], and these substances are also known to cause skin irritation and contact dermatitis [11].
Among the several pathways for human exposure to QACs [15–18], inhalation of indoor air emerges as a particularly significant risk factor. This is largely due to the use of protective gear, in occupational settings, which prevents skin contact but leaves inhalation as the most likely route of exposure [19, 20]. Particularly, due to their physicochemical properties, QACs do not readily evaporate like some other disinfectants, causing them to persist in the environment. This persistence allows them to be absorbed by dust particles, which can later become resuspended in the air, thereby increasing the likelihood of inhalation exposure [6, 15, 21].
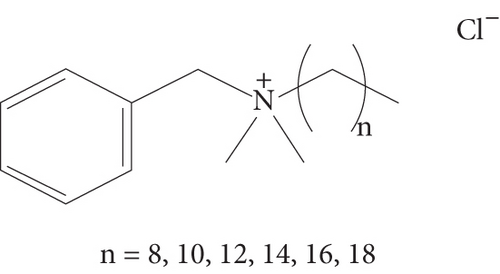
In recent years, several studies have investigated the detection of QACs in the atmosphere [19, 22–25]. Airborne samples containing QACs, particularly benzalkonium chloride (BKC) (see Scheme 1), were collected using XAD-2 tubes to assess the exposure levels of disinfection workers, revealing potential health risks associated with QAC exposure [19]. To evaluate the health hazards associated with increased QAC usage in classroom environments, air and surface exposure from spray disinfectants was characterized over a 3-day period for students and adult bystanders in a K-8 private school in Ohio, United States [22]. The results showed that airborne QAC concentrations rose during product usage but quickly returned to background levels afterward. An examination of disinfectant inhalation exposure among professors in quarantine demonstrated that industrial respiratory masks could block at least 68.3% of particles, thereby reducing the hazard quotient (HQ) [23]. Collectively, these findings confirm that while mitigative strategies can reduce inhalation risks, exposure remains a significant concern that cannot be entirely eliminated.
To assess the impact of inhaling disinfectants containing QACs on the human body, it is crucial to consider the variation in residual airborne QAC concentrations over time, the potential for capturing these substances, and various environmental factors. For QACs, the standard concentration for end-use typically ranges between 0.05% and 0.2%, with disinfection usually taking about 10 min. Therefore, well-controlled simulations under conditions that consider these factors are necessary to evaluate the impacts of various QAC-containing disinfectants. Although previous research has mainly focused on measuring QAC concentrations in the air, comprehensive investigations into their temporal behavior, particularly regarding instantaneous concentration variations, remain limited. In this study, the airborne concentration of BKC was quantified in a simulated experimental environment to derive its instantaneous concentration and elucidate its dispersion pattern in the air. The simulations were based on survey data from disinfection industry professionals, determining parameters such as spraying concentration, duration, and volume. Collected samples underwent quantitative analysis over time using liquid chromatography–mass spectrometry (LC-MS). The potential health hazards of airborne QACs to humans were assessed based on the calculated instantaneous concentrations.
2. Materials and Methods
2.1. Materials
For the disinfection experiments, a QAC-based disinfectant, BKC mixture at 100,000 ppm (anonymous company), was used. This solution was diluted to 500 ppm for the experiments. The sampling device comprised a 37-mm styrene clear cassette (Cassette Blanks, SKC Inc., Eighty Four, Pennsylvania, United States) equipped with a 37 mm glass fiber filter (GF/C Glass Microfiber Filter, Whatman, Maidstone, Kent, United Kingdom), connected to an air pump (MP-∑100kNII, Sibata, Seoul, Republic of Korea) via a Tygon tube and an adapter (ACF00020, SKC Inc.). Air samples containing QAC were collected at a flow rate of 1.5 L/min. All air pumps were calibrated before use.
Personnel involved in the experimental setup wore protective gear, including gas masks (front-end gas mask 6800, 3 M, Paul, MN, United States), cartridges (6003 K, 3 M), and protective suits (MIRSS-06, Mir Apparel, Daejeon, Republic of Korea). The QAC-based disinfectant was dispersed into the air using either automatic (DH-FOG30, DH, Gimhae, Republic of Korea) or manual (PG-P5, Punggok Agricultural Materials, Gimpo, Republic of Korea) spraying devices.
The collected samples were sealed in zipper bags and transported to the laboratory at Sogang University. The LC-MS preprocessing involved solvents such as acetonitrile, distilled water, methanol, and 2-propanol (all HPLC grade) purchased from Da Jung Co., Ltd. (Seoul, Republic of Korea). Formic acid (98%~100% for LC-MS) was obtained from Sigma–Aldrich (St. Louis, Mississippi, United States). The internal standard, benzyl-2,3,4,5,6-d5-dimethyl-n-tetradecylammonium bromide, was sourced from CDN isotopes (Quebec, Canada). Additional materials included PTFE 25 mm, 0.2 μm filters (5190–5267 Econofiltr Agilent, Santa Clara, California, United States) and 10 mL syringes (NJ-AL10, Henke-ject, Tuttlingen, Baden-Württemberg, Germany). Equipment for sample preparation included a centrifuge (5415D, Eppendorf, Hamburg, Germany), an ultrasonic cleaner (WUC-D0611, DAIHAN Scientific, Wonju, Republic of Korea), a centrifugal evaporator (CVE-210), and a diaphragm vacuum pump (NVP-1000), both from EYELA (Bohemia, New York, United States).
2.2. Overall Design
The experimental parameters for BKC dispersion and air capture in a simulated indoor environment were derived from a survey of 300 disinfection professionals. The survey covered aspects such as sprayer type (automatic or manual), dosage, spray duration, main biocidal components, and space volume during actual disinfection operations. Based on the survey responses, the following parameters were selected: use of both automatic and manual sprayers, BKC concentration of 500 ppm, spray volume of approximately 1000 mL, and spray duration of 4 min, followed by a total exposure and capture time of 12 min. Experiments were conducted in a controlled space of approximately 105 m3 (7 m length, 5 m width, and 3 m height) at the National Institute of Environmental Research (Korea), aligning with survey responses indicating spaces ranging from 100 to 200 m3.
During the experiments, spraying was evenly conducted along a predetermined path facing the front of the space. Collection devices were placed at both the front and rear of the space. A total of 45 automatic spraying experiments and 12 manual spraying experiments were conducted. Due to internal circumstances at the National Institute of Environmental Research, the experimental space became unavailable after 12 manual spraying experiments, making it impossible to conduct additional manual spraying experiments. The larger sample size for automatic spraying experiments was necessary to understand the unexpected time-course airborne behaviors of BKC. As these behaviors were unknown at the outset, multiple trials were required to establish a reliable time-course profile. In contrast, by the time manual spraying experiments were conducted, prior knowledge of these airborne behaviors allowed for a more targeted approach, reducing the need for additional trials. However, we acknowledge that the discrepancy in sample sizes may introduce differences in accuracy and reproducibility between the two methods. This limitation has been taken into account in our analysis.
BKC samples were diluted to a 500-ppm aqueous solution and sprayed into the air for 4 min using either an automatic or manual nebulizer. For automatic nebulizer experiments, the nebulization rate was set to spray approximately 1000 mL in 4 min, though actual amounts varied. The final sprayed amount was measured by the volume of the BKC aqueous solution used. The total spray volume was normalized during the analysis of LC-MS/MS quantitative values. For the manual nebulizer, variations in spray volume were also measured and adjusted for quantitative analysis. Reference spray volumes were set at 760 mL for the front automatic spray and 570 mL for the rear automatic spray. For the manual nebulizer, reference volumes were 1250 mL for the front and 880 mL for the rear. In some cases, the overall quantitative data were over or undermeasured by approximately 20%, so adjustments were made with respect to the reference spray volumes, but this was limited to unavoidable cases.
2.3. Air Nebulization and Capture of Benzalkonium Ions
Before capturing aerosol samples based on QAC, 10 glass fiber filter samplers coupled with an air pump were placed either at the front or back of the simulation room. The samplers were positioned at one location (either the front or back) for each experiment, and their locations were alternated in subsequent experiments for data consistency. The sampler was mounted at a height of 1.5 m. Pathways were marked on the floor with masking tape to minimize movement during spraying. A product containing 100,000 ppm of a BKC solution was diluted to 1000 mg/2 L (500 ppm) using distilled water and then loaded into both automatic and manual spray devices.
One person sprayed the diluted QAC-based disinfectant product solution using either an automatic or manual spraying device, while two persons collected sampler cartridges. The spaying personnel followed the marked pathways, moving back and forth while spraying for 4 min. Air sampling occurred over the next 8 min (for a total of 12 min) at intervals of 1 or 2 min using the designated sampling devices. The volume of solution remaining in the spray device was measured after each experiment to quantify usage. To prevent cross-contamination, the floors, walls, and benches were cleaned with water and dried. Additionally, all windows and doors were opened to ventilate the area for 30 min.
2.4. Sample Preparation for Quantitative Analysis
Samples collected from the simulation site were sealed in Ziploc bags with the cassette and transported to the Sogang University laboratory. The samples were transferred into 50 mL conical tubes by carefully removing the glass fiber filter from the cassette. An extraction solution with a concentration of 2 ppm (2 mg/2 L) of internal standard was prepared by dissolving the internal standard in anhydrous acetonitrile. Ten milliliters of the extraction solution was added to a 50-mL conical tube containing a glass fiber filter and sonicated for 30 min. Using a 25-mm, 0.2-μm PTFE filter, the extracted BKC was purified and stored in a 15-mL conical tube. A total of 1.5 mL of the stored purified solution was aliquoted and transferred to a 2-mL microtube, the solvent was evaporated with a high-speed vacuum evaporator, and the same process was repeated once more to evaporate a total of 3 mL of purified solution. Eighty microliters of distilled water and 20 μL of methanol were added to the 2 mL microtube to resuspend to a total volume of 100 μL. The resuspended solution was vortexed with a microtube shaker incubator for 30 s and transferred to an LC vial.
2.5. LC-MS Experiments
The LC-MS/MS multiple reaction monitoring (MRM) analysis was performed using a triple quadrupole mass spectrometer (TSQ Quantiva, Thermo Fisher, Waltham, Massachusetts, United States) coupled with a UPLC system (Thermo Fisher, Waltham, Massachusetts, United States). The LC separation was made with a Waters Acquity UPLC BEH C8 column (2.1 × 100 mm id, 1.7 μm) at 50°C. Mobile Phase A was 0.1% formic acid with 10 μM phosphoric acid in water, and Mobile Phase B was 0.1% formic acid with 10 μM phosphoric acid in isopropyl alcohol. The linear gradient used was as follows: 0 min, 1% B; 2 min, 1% B; 2.1 min, 30% B; 5 min 30% B; 51. min, 50% B; 8 min, 50% B; 8.1 min, 90% B; 15 min, 90% B; 15.1 min, 1% B; 20 min, 1% B. The flow rate was 0.5 mL/min, and the injection volume was 10 μL. Relevant MS information is as follows: MS detection occurred in positive ion mode and MRM mode. The MRM transitions were set to 248→91 for BKC-C8, 276→91 for BKC-C10, 304→91 for BKC-C12, 332→91 for BKC-C14, 360→91 for BKC-C16, 388→91 for BKC-C18, and 337→96 for BKC-IS. Operational parameters were as follows: spray voltage was set at +3500 v; sheath gas flow was set at 30 arbitrary units; auxiliary gas flow was set at 7 arbitrary units; ion transfer tube temperature was maintained at 325°C; vaporizer temperature was set at 275°C; peak widths of Q1 and Q3 were both set at 0.7 FWHM; CID gas pressure was set at 1.5 mTorr. The data obtained from the LC-MS/MS MRM experiments was analyzed using the X-Calibur software provided by Thermo Fisher Scientific Inc.
2.6. Measurement of Air Ventilation Rate
The ventilation rate measurement was conducted within the simulation room. The experiment involved saturating the test site with CO2 gas, with all windows and doors closed, followed by locking the gas valve. The CO2 concentration was measured using an indoor air quality meter (AirMon-IT, Sentry, Seoul, Republic of Korea), with a CO2 gas measurement accuracy of 50 ppm ± 5% reading value. The sensor’s measurement interval was set to a maximum of 1 s. One experimenter used a gas regulator to saturate the simulation room with CO2 gas, then closed the CO2 gas valve, and measured the ventilation rate from the time the experimenter exited the room.
2.7. Data Analysis
Data were analyzed and fitted using Python 3.11.0 (Copyright 2001–2023 Python Software Foundation) on the IDE Visual Studio Code Version 1.82.2. The Python modules used include pandas, NumPy, SciPy, scikit-learn, Matplotlib, and python-pptx. Pandas was used for reading, extracting, and grouping data; NumPy for calculations; SciPy for curve fitting; scikit-learn to find figures of merit; Matplotlib for visualization; and python-pptx for exporting and presenting results clearly. The analysis was carried out on a personal computer equipped with an Intel(R) Core(TM) i7-10700F CPU @ 2.90 GHz, operating within the Windows 10 Education environment.
2.8. Hazard Identification and Assessment of HQs
Hazard identification qualitatively confirms the potentially harmful effects of a substance by evaluating all available human data (e.g., epidemiological studies) and animal test data related to hazardous elements. Data collection utilizes major domestic and international hazard information databases, reports from key public organizations (e.g., OECD, US EPA, ECHA), and academic literature. Following official guidelines, toxicity reference values (such as chronic no-observed-adverse-effect concentration (NOAEC) and no-observed-adverse-effect level (NOAEL)) and the target margin of exposure (MOE) are calculated. Factors considered include uncertainties in translating experimental data to actual human exposure situations, interspecies differences, intraspecies differences, exposure duration differences, and variability in toxicity values (e.g., lowest-observed-adverse-effect level (LOAEL) and NOAEL) [26].
3. Results and Discussion
3.1. Analysis Method Validations
The focus of this study was on BKC, a type of QAC, utilized as a blend of substances characterized by distinct alkyl chain lengths. The BKC product employed in this investigation contained alkyl chains spanning C8, C10, C12, C14, C16, and C18 (see Scheme 1).
To quantitatively analyze these compounds with varying chain lengths using LC-ESI-MRM MS, standards with different alkyl chain lengths were procured. An analytical method was then established, employing benzyl-2,3,4,5,6-d5-dimethyl-n-dodecylammonium chloride as an internal standard.
Figure 1 presents chromatograms resulting from positive ion LC-ESI-MRM MS analysis of alkylbenzyl dimethylammonium ion, the positive ion component of BKC, detectable via mass spectrometry analysis, each with a distinct alkyl chain, and the internal standard. A C8 reversed-phase column was used in the LC, demonstrating the effective separation of alkylbenzyl dimethylammonium ions with varying alkyl chain lengths. The BKC standard mixture showed a predominance of the C12 chain, followed by the C14 chain. C10 and C16 exhibited comparable content but were analyzed at concentrations nearly 100 times lower than C12 and C14 on the chromatogram. Conversely, C8 and C18 were detected at significantly lower levels.
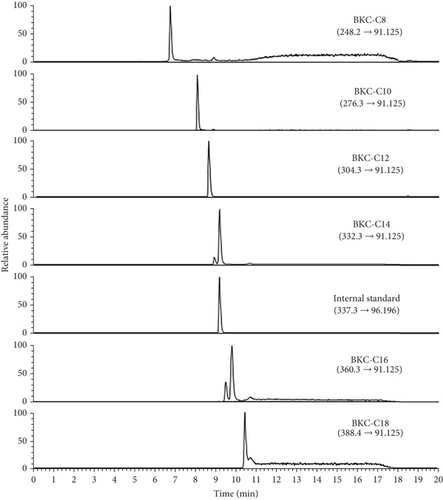
During the LC-MS/MS analysis of alkylbenzyl dimethylammonium ions using a C8 reversed-phase column, residual alkylbenzyl dimethylammonium was not entirely purged from the LC system. This is attributed to the hydrophobic nature of the alkyl group and the ionic character of the QAC, which potentially persists on the column, LC, or mass spectrometer inlet tube. Consequently, the background concentration was relatively elevated, resulting in a discernible alkylbenzyl dimethylammonium peak even in blank data injected with the solvent identical to the mobile phase. Following a determination experiment for the method limit of detection (LOD), it was established to be approximately 40 ppb.
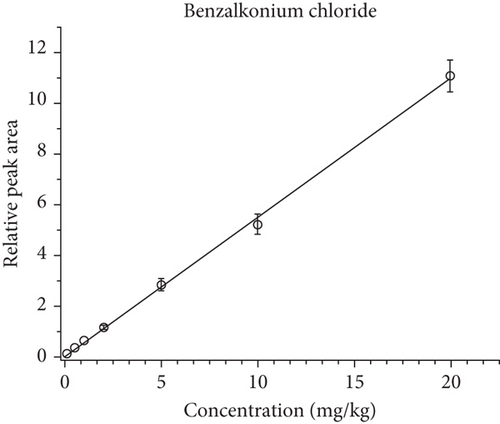
Using the established LOD, a corresponding limit of quantification (LOQ) value was determined to be 0.12 ppm. Based on this LOQ value, a calibration curve was constructed, encompassing seven data points ranging from 0.12 to 20 ppm. The resulting calibration curve exhibited high linearity, with an R2 value of 0.9991, as shown in Figure 2. Within the calibration curve, each peak area value was cumulatively summed and then divided by the peak value of the internal standard. This computation enabled the determination of the total BKC content within the sample.
3.2. Analysis Results of Airborne BKC
BKC residuals in the air were captured during a 4-min spray period and an additional 8-min exposure period, resulting in a total exposure time of 12 min. Figure 3 illustrates the amount of BKC (i.e., alkylbenzyl dimethylammonium ion) captured and quantified by LC-ESI-MRM MS for each time period from the 10 collectors installed at the front or rear of the room.
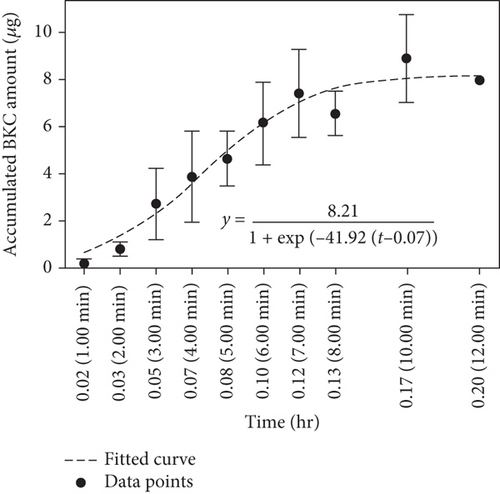
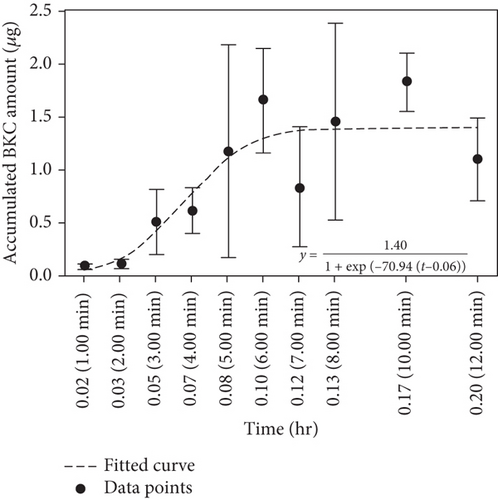
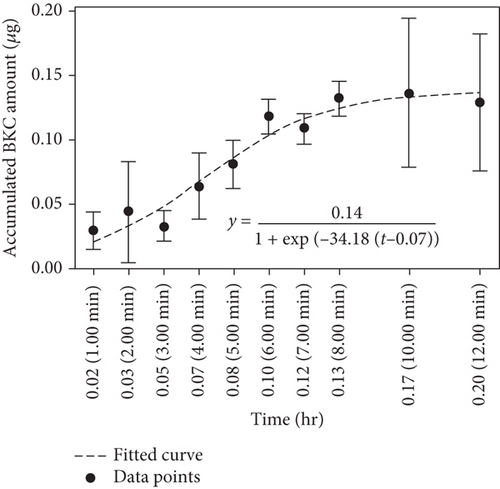

The cumulative capture curves of BKC, collected at the front and rear using either an automatic or manual sprayer, were similar and exhibited a sigmoidal shape. Initially, the captured amount was insignificant as the sprayed BKC took time to disperse throughout the room (induction period). After 1–2 min of spraying, the amount captured by the glass fiber filters at the front and rear gradually increased. The captured amount continued to rise slowly for up to 12 min after the spraying ended at 4 min, eventually flattening as time progressed.
Another important feature observed in Figure 3 is the large variation in the capture amount at each time point, resulting in substantial error bars. This variation is speculated to be due to the fact that BKC is initially sprayed as cloud droplets, which gradually transform into aerosols as the water solvent evaporates. The aerosolized BKC then undergoes highly irregular Brownian motion in the indoor air, leading to significant variation in the captured amounts.
Generally, the dispersion of these aerosols is influenced by various environmental factors, including the room’s ventilation, temperature, humidity, gravity, electrostatic forces, human activity, obstacles within the room, and thermal sources, which can induce unpredictable air displacement. In the simulated experiments, the movement of the experimenters could not be precisely controlled, making it the most significant factor contributing to the large error bars. Additionally, variations in temperature and humidity on the day of the experiment are expected to have influenced the variability in capture amounts to some extent. These factors, combined with the inherent randomness of aerosol behavior, likely contributed to the observed fluctuations in the experimental data.
| Sprayer | Section | Sigmoidal curve |
|---|---|---|
| Automatic sprayer | Front | |
| Rear | ||
| Manual sprayer | Front | |
| Rear |
The numerators of these sigmoidal trend equations provide information about the maximum cumulative capture amount of BKC. For example, when using an automatic sprayer to dispense BKC and capturing it at the front of the room, the maximum cumulative capture amount was found to converge to approximately 8.21 μg. In contrast, at the rear of the room, only 1.36 μg was captured, which is approximately 17% of the cumulative capture amount at the front; it is noteworthy that the reference spray volumes were set to be 760 mL for the front automatic spray and 570 mL for the rear automatic spray. The observation that the amount of BKC captured at the rear of the room was significantly lower than that captured at the front is primarily due to BKC always being sprayed towards the front during the spraying process. Additionally, this finding indirectly indicates that BKC did not completely disperse throughout the indoor space within the given time frame of the experiment. The uneven dispersion of BKC in the indoor space is also manifested in the large error bars observed at each time point in Figures 3(a), 3(b), 3(c), and 3(d).
In the case of the manual sprayer, significantly less BKC was captured compared to the automatic sprayer. At the front, only approximately 1.7% of the BKC sprayed through the automatic sprayer was captured. With the manual sprayer, the amount captured at the rear was about twice that captured at the front. However, due to the very low overall capture of BKC when using the manual sprayer, the difference in capture amounts between the front and rear is not considered significant.
The instantaneous concentration of BKC in the air can be derived from Figure 3, which provides information on its cumulative amount. The measured values of the cumulative collected amount of BKC shown in Figure 3 exhibited significant variation due to the Brownian motion of the air and the sprayed BKC. Therefore, it was not feasible to back-calculate the concentration of BKC in the air based on these measured values. Instead, the instantaneous concentration in the air was derived from the sigmoidal trend line corresponding to the cumulative collection measurements, excluding the initial part. The initial part of the sigmoidal trend line was excluded because it reflects the induction period characteristic of the dispersion of BKC after being sprayed into the indoor space.
The derivations of instantaneous capture amounts of BKC in the air were made by differentiating the sigmoidal trend line and substituting 2 min (0.0333 h), 3 min (0.05 h), 4 min (0.0667 h), 5 min (0.0833 h), 6 min (0.100 h), 7 min (0.117 h), 8 min (0.133 h), 10 min (0.167 h), and 12 min (0.200 h) into the differentiated equation. The concentration was calculated by dividing the values obtained from the differentiated equation by the volume of air inhaled by the air pump during each interval. The intervals between each measurement time were 1 or 2 min, and the air suction rate by the air pump was 1.5 L/min. Therefore, the volume of air inhaled during each 1 or 2-min interval was 1.5 L (0.0015 m3) or 3.0 L (0.0030 m3), respectively. The instantaneous concentration values were calculated in units of micrograms per cubic meter.
The circles in Figures 4(a), 4(b), 4(c), and 4(d) indicate the instantaneous concentrations of BKC in the air. In each graph, the amount of collected BKC per minute increased for about 4–5 min after the initial spraying. After 4 min, when the spraying stopped, the amount of BKC in the collected air rapidly decreased. This phenomenon can be attributed to the heavy molecular weight of the BKC, which quickly settles to the floor of the indoor space, resulting in very few ions remaining suspended in the air after the spraying stopped. Although the mass of BKC varies with the number of carbon atoms in the alkyl group, the most common C12 alkyl group has a molecular weight of approximately 304.5 g/mol, which is significantly heavier than the average molecular weight of dry air (29 g/mol).
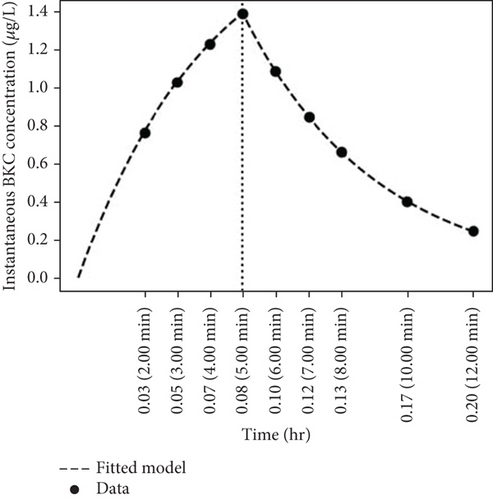
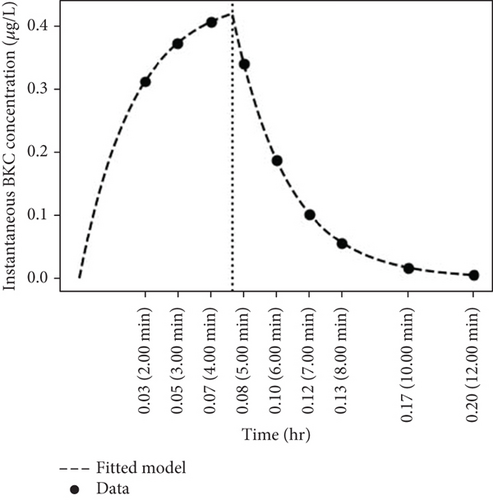
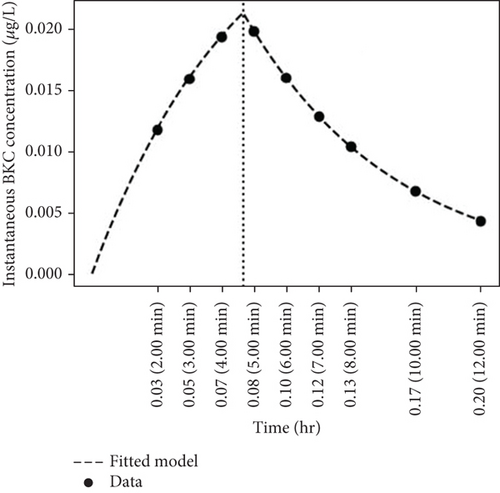
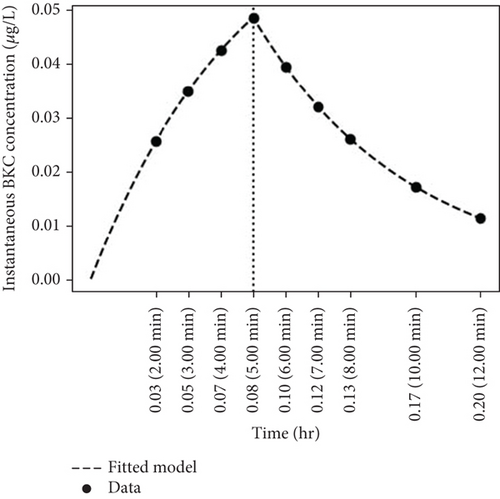
A particularly noteworthy observation from Figure 4 is that the concentration of BKC in the air becomes almost negligible around 12 min, which is 8 min after spraying stopped. This result indicates that in a space with restricted airflow, where BKC is sprayed at a very high concentration of 500 ppm, the concentration of the hazardous substance BKC in the indoor air becomes very low after about 10–15 min.
Considering a safety margin, indoor air quality may be considered safe approximately 20 min after disinfection. However, this safety margin can vary depending on several factors, including room size and ventilation rate. Larger rooms may experience longer dispersion times due to a greater volume of air, while higher ventilation rates can accelerate the removal of airborne BKC, thereby reducing the required safety margin. Therefore, while the 20-min recommendation serves as a general guideline under the specific conditions of this study, its applicability to different real-world settings should be assessed by taking these influencing factors into account.
3.3. Fitting With the “Exposure to Spray Model”: Determination of Parameters
The instantaneous airborne concentration results of BKC obtained from Figure 4 can be fitted using the “exposure to spray model” [27]. The dotted lines in Figure 4 illustrate the graphs fitted according to this model’s equations. This fitting allowed for the determination of parameters such as the airborne fraction (Fair), which represents the fraction of the nonvolatile material that becomes airborne after spraying as droplets, and the Stokes settling velocity (vs), which is the velocity at which particles fall to the floor.
From these calculations, the values for Fair and vs were determined to be 0.4991 and 19.52 m/h, respectively. Additionally, in a separate experiment, the air ventilation rate q was found to be 0.66 per hour. The fitting scores were R2 = 0.87 and SSE (sum of squared errors) = 0.27. Table 2 presents the Fair and vs values obtained by fitting the “exposure to spray model” equations to the circles in Figures 4(a), 4(b), 4(c), and 4(d).
| Sprayer | Section | Fair | Vs (m/h) | R2 | SSE |
|---|---|---|---|---|---|
| Automatic sprayer | Front | 0.4991 | 19.52 | 0.87 | 0.27 |
| Rear | 0.3103 | 39.58 | 0.78 | 0.07 | |
| Manual sprayer | Front | 0.0045 | 17.17 | 0.87 | 0.00 |
| Rear | 0.0140 | 16.43 | 0.86 | 0.00 |
As this study is conducted in a well-controlled environment, real-world conditions may introduce additional complexities that affect BKC’s airborne concentration behavior. Aerosols exhibit highly unpredictable Brownian motion and distribution behavior, which becomes even more complex in the presence of human activity. While the overall settling of BKC compounds onto the floor—due to their relatively higher density compared to air—remains unchanged, human movement may delay this process by agitating the air, leading to more variable and random collection rates among samplers.
Furthermore, in real-world environments with higher ventilation rates than the controlled conditions in this study (q = 0.66 per hour), these effects would be reflected in Equations (3) and (4), where the ventilation rate (q) is a key parameter. Under such conditions, the airborne concentration of BKC is expected to decrease more rapidly, influencing its time-course behavior. This limitation should be considered when applying the findings of this study to real-world disinfection scenarios.
3.4. Determination of HQs
Dotson et al. proposed health-based exposure limits (HBELs) for occupational exposures through a screening-level toxicology assessment of the existing literature [26, 28]. Their studies estimated a range of 0.1–0.7 mg/m3 to protect against irritant and long-term exposures to QACs [28]. This provides a useful benchmark for evaluating the findings of this study, which assesses health risk based on one-time exposure. This study evaluates the health risks for disinfectors who are not wearing personal protective equipment. However, for professional disinfectors, risk assessment may need to be conducted differently due to the nature and frequency of their exposure. Furthermore, for the general public wearing standard health masks, the risk might also differ.
The RfC value is calculated to be 4.44 × 10⁻³ mg/m3. Specifically, a NOAEL of 0.22 mg/m3 was obtained for BKC in a 90-day-long repeated inhalation toxicity test using the Fischer 344 rats [29]. In this test, exposure was conducted for 6 h/day, 5 days/week, and 13 weeks. The NOAEL value was adjusted, resulting in a revised point of departure (POD) for inhalation calculated to be 0.11 mg/m3.
In various studies, people are assumed to breathe in chemicals for 6 h daily, whereas workers are assumed to inhale them for 8 h daily. The exposure route is via inhalation, and for workers, a correction is necessary to account for differences in respiratory rates under standard conditions versus light activity conditions (6.7 m3 for base level and 10 m3 for light activity) [26]. Interspecies differences were not adjusted using factors for allometric scaling. Instead, factors such as interspecies diversity, intraspecies diversity, time extrapolation, route-specific extrapolation, and daily exposure time for workers were considered when evaluating the extrapolation factor for BKC, resulting in a MOE of 25 (see Table 3) [26]. After correcting the starting value for the toxicity factor, the final RfC was calculated by dividing the evaluation factor.
| Chemical substance name | CAS no. | Exposure route | Toxicity value | Assessment factors | Reference concentration (RfC) (chronic NOAEL) |
Target MOE |
|---|---|---|---|---|---|---|
| Benzalkonium chloride | 8001-54-5 | Inhalation |
|
|
0.00444 mg/m3 | 25 |
Using these values, the HQ was calculated to be 0.856, which is below the threshold of 1. However, given that HQ is close to 1, stating “no significant health risk” may warrant some caution. Similarly, the HQ for other cases was determined (see Table 4). The HQ at the rear of the room, obtained for the automatic spraying device, was much lower than 1, at 0.142. For the manual spraying device, the HQ values were insignificant both at the front and rear of the room, exhibiting values of 0.015 and 0.030, respectively.
| Sprayer | Sections | HQ |
|---|---|---|
| Automatic sprayer | Front | 0.856 |
| Rear | 0.142 | |
| Manual sprayer | Front | 0.015 |
| Rear | 0.030 |
To summarize, even in the worst-case scenario, such as at the front of the room with the automatic sprayer, no significant health risk was identified. However, the HQ value of 0.856, being close to 1, suggests that some caution is advisable. This evaluation is based on a one-time exposure, and further considerations would be needed to assess potential risks from repeated exposures. The Cinh value of 0.0038 mg/m3 determined in this study is well below the HBELs proposed by Dotson et al., further corroborating the conclusion of no significant health risk [28].
For professional disinfectors, additional risk assessments are recommended to account for their frequent and prolonged exposure. Moreover, for the general public wearing standard health masks, the level of risk might be lower than assessed in this study, indicating the need for separate evaluations considering mask efficacy.
4. Conclusions
This study comprehensively examined the airborne behavior of QACs aerosolized via nebulization, with a specific focus on BKC. In well-controlled experiments, cumulative capture curves of BKC were collected at the front and rear of the room using both automatic and manual sprayers, all exhibiting a sigmoidal shape. These curves allowed for the determination of instantaneous concentrations of BKC in the air, revealing that the concentration of airborne QACs decreases rapidly after spraying stops, for both automatic and manual methods. From the maximum cumulative capture of BKCs, HQs were calculated. The HQ values were below 1 in all the cases, whether at the front or rear of the room, and for both spraying methods. This result suggests that despite the increased use of disinfectants during the COVID-19 pandemic, the potential health hazards from airborne QACs are minimal due to their rapid descent and low concentration in the air after spraying. This study provides valuable insights into the safe use of disinfectants and their impact on indoor air quality, offering important implications for public health policies and disinfection practices in various settings.
Conflicts of Interest
The authors declare no conflicts of interest.
Funding
This work is supported by the National Research Foundation of Korea (NRF) grant funded by the Korean government (MSIT) (2021R1A2C2007397) and by the Ministry of Education (2018R1A6A1A03024940) through the Basic Science Research Program. Additional support was provided by the Korea Environment Industry & Technology Institute (KEITI) through the “Advanced Technology Development Project for Predicting and Preventing Chemical Accidents” program, funded by the Korea Ministry of Environment (MOE) (RS-2023–00219144). The authors also acknowledge grant from the National Institute of Environment Research (NIER) funded by the Ministry of Environment (MOE) of the Republic of Korea (NIER-2023-04-02-224).
Open Research
Data Availability Statement
The data that support the findings of this study are available from the corresponding author upon reasonable request.


