Hybrid Modified Particle Swarm Optimization and Adaptive Neuro-Fuzzy Inference System for Electric Power Consumption Prediction
Abstract
Load forecasting is crucial in power system energy management, aiding planning and operations. The latest modified forecasting methods are important for best prediction of the electric power consumption of the load which nowadays are not practically implemented. As a result, hybrid modified particle swarm optimization (MPSO)–adaptive neuro-fuzzy inference system (ANFIS) is applied in this work to predict the electric power consumption of the case study area. This research also focuses on using artificial neural network (ANN), ANFIS, and MPSO-ANFIS to model Hossana City’s power consumption in Ethiopia, forecasting beyond available data for the next decade. Addressing the challenges of complex and widely distributed power systems, the study incorporates demographic factors. The performance evaluations show MPSO-ANFIS found as the superior model, achieving a mean absolute percentage error (MAPE) of 1.2% and root mean square error (RMSE) of 0.87, due to MPSO. This model also boosts a high R2 value of 0.97. The model demonstrates effective load forecasting based on previous data training, promising reliable future predictions. So, the hybrid MPSO-ANFIS is recommended for electric power consumption prediction.
1. Introduction
- •
Fuzzification layer: converts crisp inputs into fuzzy sets.
- •
Rule layer: contains fuzzy rules.
- •
Normalization layer: normalizes the output of the rules.
- •
Defuzzification layer: converts fuzzy outputs back to crisp values.
A powerful hybrid intelligent system, the ANFIS, combines the interpretability of fuzzy logic with the learning capabilities of ANNs [5]. Its purpose is to automatically adjust the parameters of a set of fuzzy if–then rules that approximate nonlinear functions. This is accomplished by utilizing the gradient descent method or the backpropagation algorithm. For tasks including system identification, modeling, and prediction, ANFIS is frequently utilized [6, 7].
2. Literature Review
Different scholars have reviewed various studies related to the application of ANFIS in electric power consumption prediction. These are some of the related works done in the area.
Oladipo, Sun, and Olatide [1] investigate the influence of clustering techniques and parameters on a hybrid particle swarm optimization (PSO)-driven ANFIS model for electricity prediction. This study evaluates the performance of the developed models through four recognized performance metrics: root mean square error (RMSE), mean absolute percentage error (MAPE), mean absolute error (MAE), and the coefficient of variation of the root mean square error (CVRMSE). The findings showed that combining the ANFIS approach with PSO resulted in the most accurate forecasting model, yielding optimal values. This study did not consider the recently modified optimization techniques, performance indices like R2, and comparison of ANFIS with other forecasting techniques like ANN.
Oladipo and Sun [2] developed an enhanced ANFIS using a genetic algorithm (GA). In this study, a hybrid model that integrates a fuzzy c-means clustered ANFIS with a GA, to model electricity consumption, is presented. The findings show that the hybrid ANFIS model outperforms the standalone version. This work did not consider latest improved optimization techniques, performance indices, and ANFIS performance concerning other forecasting techniques.
Souhe et al. [3] developed a hybrid model for forecasting the consumption of electrical energy in a smart grid. This paper introduces an innovative hybrid model for predicting electricity consumption, which integrates several deep learning and optimization methods, such as support vector regression (SVR), firefly algorithm (FA), and ANFIS. The process is aimed at reducing both error and risk. Various accuracy metrics, such as RMSE, MAE, and MAPE, are utilized to highlight the superior performance of the proposed mode. The simulation results indicate that the proposed method surpasses other methods like long short-term memory (LSTM) and random forest (RF). The main drawback of this paper is they did not consider some performance indices like R2 and did not compare ANFIS with other forecasting techniques like ANN. The gap in this paper is the latest modified optimization techniques, and a comparison of ANFIS with other forecasting methods is not included.
Oladipo, Sun, and Amole [4] analyzed the impact of clustering techniques and parameters on evolutionary-based hybrid models for forecasting electricity consumption. This study focuses on the application of hybrid modeling techniques for the better prediction of electricity consumption, using performance metrics: RMSE, MAPE, MAE, and CVRMSE. But it did not consider improved optimization techniques and in addition did not observe the performance of ANFIS over other forecasting methods.
Tay et al. [5] discuss electricity consumption forecasting using an ANFIS using the parameter MAPE. In this study, only univariate data of the case study area electricity consumption from January 2009 to December 2018 is considered and wish to forecast 2019 consumption. The optimization techniques and other performance indices are not included in this work.
AL-Qaysi, Bozkurt, and Ates [6] discuss load forecasting based on GA–ANN–ANFISs. The results of this study indicate that the ANN–GA model has better performance accuracy and low error rates. It did not take into consideration recently modified optimization techniques and performance evaluation parameters.
Vikas Malladi, Maran, and Mandava [7] work on forecasting electricity consumption using an ANFIS. The assessment of this model is from weather data and the electricity consumption data available on the internet. The ANFIS approach is applied in this study. The outcome shows that the model is effective. However, it did not consider some optimization techniques and performance indices in the study.
Oladipo and Sun [2] express the ANFIS using a for electric power consumption predictions. In this work, a hybrid model, which combines an ANFIS and GA, is present to model electricity consumption prediction. The performance evaluation indices RMSE, MAPE, MAE, and CVRMSE are considered. The study indicates the ability of the proposed model as a good tool for energy forecasting. The latest improved optimization techniques are not taken into consideration in this study.
Oladipo and Sun [2] investigated the influence of clustering techniques and parameters on a hybrid PSO-driven ANFIS model for electricity prediction. This study considers the combination of PSO and ANFIS for the prediction of electricity demand, by applying the performance metrics: RMSE, MAPE, MAE, and CVRMSE. However, the latest improved optimization techniques are not considered.
Acakpovi et al. [8] discuss the time series forecasting of electricity demand by using ANFISs. The ANFIS algorithm converges faster with an increase in the data used for training, and increasing the membership function resulted in overfitting of data which adversely affected the RMSE values. The result of the study indicates the merit of the ANFIS algorithm for improved predictive accuracy. The limitation of this study is optimization techniques and other performance indices are not included in this work.
Laouafi, Mordjaoui, and Boukelia [9] work on an ANFIS-based approach for daily load curve prediction using univariate modeling to recognize the daily and weekly patterns of the electric load time series as a basis for the forecast as methodology. The result indicates the effectiveness of the proposed model with an average MAPE of 2.087%. However, this study excludes optimization techniques and important performance indices.
Mbey et al. [10] develop a novel deep learning–based data analysis model for electrical power consumption forecasting. The results indicate the outperformance of the proposed optimized method based on deep learning and its superiority compared to basic methods of deep learning in both electrical consumption and PV power generation forecasting. The recently modified optimization techniques and performance indices are not part of this work.
2.1. Research Gap and Motivation
Although previous studies have used different models to predict energy consumption, it has not fully consider various performance indices and it lacks ANFIS comparison with other prediction techniques. In addition, they did not take into consideration the latest modified optimization techniques.
2.2. Main Contribution
- •
Introduction of a novel hybrid technique that merges modified particle swarm optimization (MPSO) with ANFIS, giving a unique framework for optimizing power consumption forecasts.
- •
Real-world data is used to train and validate the proposed model, demonstrating the usefulness of the model in situations involving energy management in real time.
- •
Implications for smart grid technology, providing utilities with a tool to better overall energy management, optimize energy distribution, and improve load forecasting.
3. Materials and Methods
3.1. Description of the Study Area
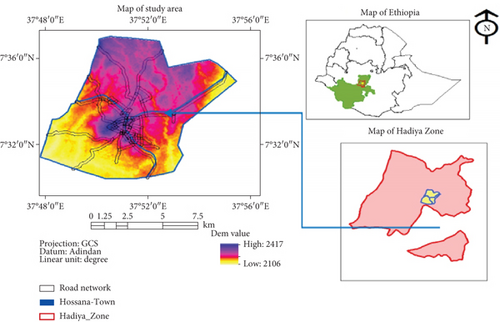
Hossana (also spelled Hosaina) is a town that level as a woreda in southern Ethiopia and currently serves as the administrative center of Hadiya Zone and Central Ethiopia Regional State as well, geographically located in the central south of Ethiopia, found at 7°30 ′30″ N–7°35 ′30″ N latitude and 37°48 ′30″ E–37°54 ′30″ E longitudes with an elevation of 2177 m above sea level. It was part of Limo Woreda and is surrounded by it. The town is located at a distance of 230 km south of Addis Ababa (the national capital), 194 km west of Hawassa (a regional city), and 89 km away from Butajira [11]. The map of the study area is shown in Figure 1.
3.2. Data Collection and Analysis
In this research, an ANFIS is applied for electric power consumption prediction in Hosana Town. The geographic location, GDP, time, population, and historical load were gathered from the Ethiopian utility.
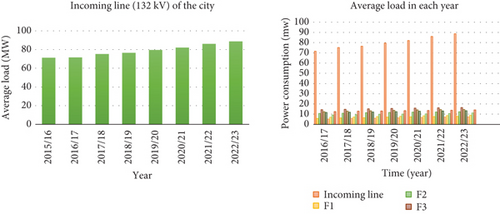
The 8-year data, gained from the Hossana substation, includes GDP, population, and city electricity usage (see Table 1). A 70% training set and a 30% validation set make up this dataset. Interestingly, the data shows a steady annual increase in the city’s electrical load usage. The average load data income and feeder lines for Hossana substation are shown in Table 1.
| Year | Incoming line (132 kV) | F1 | F2 | F3 | F4 | F5 | F6 | F7 | F8 | F9 |
|---|---|---|---|---|---|---|---|---|---|---|
| 2015/16 | 71.25 | 5.06 | 10.33 | 14.40 | 11.79 | 11.33 | 4.98 | 6.78 | 8.98 | 12.33 |
| 2016/17 | 71.65 | 5.84 | 10.73 | 14.42 | 12.49 | 11.67 | 5.24 | 7.00 | 9.23 | 12.56 |
| 2017/18 | 75.25 | 6.30 | 10.87 | 14.82 | 13.09 | 11.89 | 5.86 | 7.25 | 9.54 | 12.97 |
| 2018/19 | 76.57 | 6.57 | 11.42 | 15.25 | 13.34 | 12.18 | 6.02 | 7.67 | 9.86 | 13.17 |
| 2019/20 | 79.62 | 7.19 | 11.66 | 15.67 | 13.81 | 12.45 | 6.39 | 7.91 | 10.12 | 13.43 |
| 2020/21 | 82.15 | 7.45 | 11.98 | 15.95 | 14.24 | 12.89 | 6.83 | 8.43 | 10.31 | 13.65 |
| 2021/22 | 86.09 | 7.67 | 12.17 | 16.23 | 14.53 | 13.16 | 7.18 | 8.63 | 10.64 | 13.86 |
| 2022/23 | 88.72 | 7.91 | 12.35 | 16.51 | 14.62 | 13.39 | 7.45 | 8.94 | 11.21 | 14.19 |
- Note: The feeders: F1 = Balessa 33 kV, F2 = Wasgebeta 33 kV, F3 = Hayise 33 kV, F4 = Angecha 15 kV, F5 = Gimbichu 15 kV, F6 = Lera 15 kV, F7 = Hossana 15 kV, F8 = Fonko 15 kV, and F9 = Wachemo University 15 kV.
Figure 2 depicts the total power consumption of the city for 8-year recorded data, and it is essential to forecast the next 10-year load forecasting.
The data collected from Hossana City is shown in Table 2.
| Time (year) | Population | GDP | Electricity consumption (MW) | Normalized load consumption |
|---|---|---|---|---|
| 2015/16 | 62,335 | 152,365,456 | 71.25 | 0.803088368 |
| 2016/17 | 65,442 | 159,009,117.9 | 71.65 | 0.807596934 |
| 2017/18 | 69,569 | 174,149,780.6 | 75.25 | 0.848174031 |
| 2018/19 | 73,736 | 193,045,527 | 76.57 | 0.863052299 |
| 2019/20 | 78,296 | 233,231,411.4 | 79.62 | 0.897430117 |
| 2020/21 | 88,958 | 281,065,467.4 | 82.15 | 0.925946799 |
| 2021/22 | 117,818 | 340,032,487.8 | 86.09 | 0.970356177 |
| 2022/23 | 152,749 | 406,054,503 | 88.72 | 1 |
3.3. ANFIS Model Development
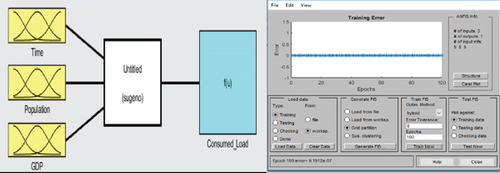
MATLAB’s fuzzy toolbox was used for ANFIS modeling, with GDP, time, and population serving as input parameters and power consumption serving as the only output parameter. Using constant-type functions for the output and Gaussian-type membership functions for the inputs, the model was trained over 100 epochs. For input parameters, three linguistic variables (MF1, MF2, and MF3) were used. Six of the eight datasets, or 70% of the total, were put aside for training, while the other two, or 30%, were chosen at random to test the model [12]. Graphic user interface for fuzzy logic representation and graphic user interface of ANFIS with input and output parameters are indicated in Figure 3.
A fuzzy system needs to receive input/output training data from experiments or simulations of the system and wishes to simulate to be trained to utilize neuroadaptive techniques [12, 13]. When the training data fully represents the properties of the data that the trained FIS is meant to model, ANFIS training generally performs well [14, 15].
A graphic user interface of the ANFIS model structure for electrical power consumption forecasting is depicted in Figure 4.
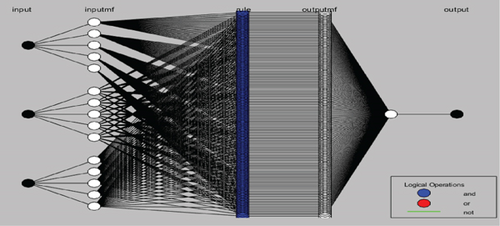
Figure 5 depicts the membership functions at different conditions.

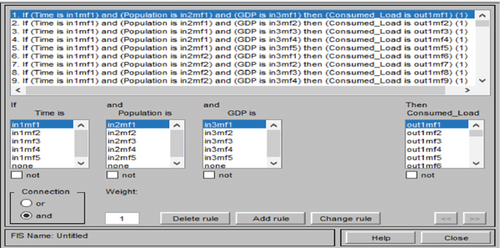
The fuzzy logic rules are shown in Figure 6.
The testing dataset is used to assess the ANFIS model’s performance once it has been trained.
3.4. MPSO-ANFIS Hybrid Model
3.4.1. MPSO
The modified LDIWPSO can be viewed as an extended version of LDIW that integrates the natural (base e) inertia weight strategy [18].
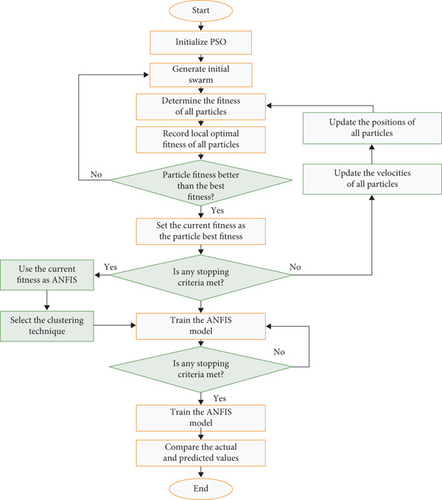
In this research, a hybrid model combining the MPSO algorithm with ANFIS to forecast the energy consumption is present.
MPSO refers to variations of the traditional PSO algorithm designed to enhance its performance and address its limitations. These modifications are aimed at improving convergence speed, enhance solution quality, and maintain diversity in the swarm, making MPSO more effective for complex optimization problems. In this study, the flow chart indicated in Figure 7 is implemented.
3.5. Long-Term Load Forecasting Model Using ANN
It is a simplified model of the central nervous system and is a form of artificial intelligence. A neural network is an attempt at creating machines that work similar way to the human brain by building these machines using components that behave like biological neurons [20]. Neural networks are interconnected neural computing elements that can respond to input stimuli and learn, to adapt to the environment [21]. The ANN model which contains three inputs and one output parameter is represented in Figure 8.

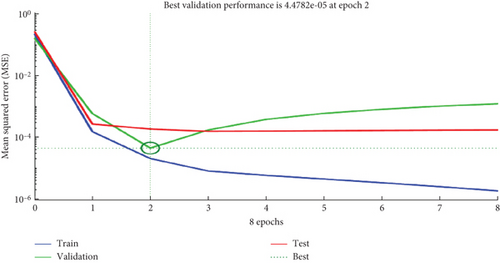
Choosing an appropriate number of hidden layers needs expert knowledge because when the number of hidden layers is a lot, it results in a computational burden for the system whereas if the number of hidden layers is too small, it will have a larger MAPE and RMSE [12]. The training and validation result using ANN is depicted in Figure 9.
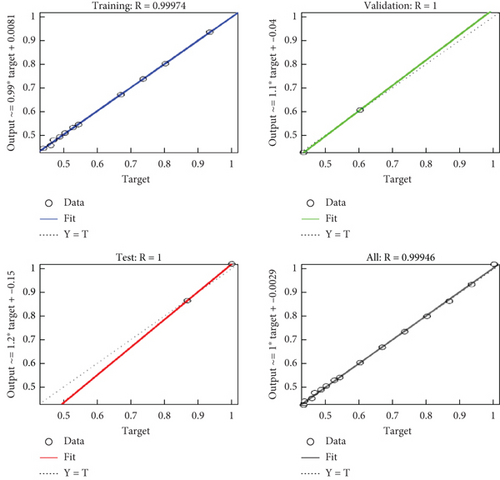
Regression R values measure the correlation between outputs and targets. An R value of 1 means a close relationship and 0 a random relationship [13, 14].
In Figure 10, the training, validation, and test values of the system with their target output have been summarized. In addition to this, the MSE of ANN is not best when compared with ANFIS.
4. Results and Discussions
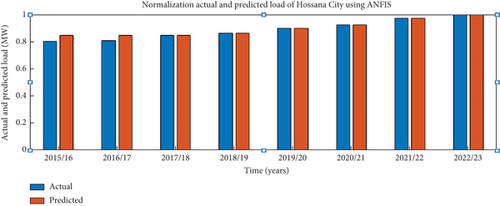
This paper emphasizes the systematic input of datasets into the ANFIS network for accurate load forecasting. Figure 11 visually represents normalized actual and predicted load consumption in Hossana City (megawatt) from 2015/16 to 2022/23. The ANFIS model exhibits a RMSE of 2.4282 and a MAPE of 1.79845%.
4.1. Simulation Results of Long-Term Load Forecasting Using ANFIS
The forecast power consumption in Hossana City using the ANFIS model is depicted in Table 3.
| Time (years) | Population | GDP | Forecasted load (MW) |
|---|---|---|---|
| 2023/24 | 165,665 | 442,295,795 | 98.5193 |
| 2024/25 | 178,581 | 478,537,087 | 109.2719 |
| 2025/26 | 191,497 | 514,778,379 | 120.0779 |
| 2026/27 | 204,413 | 551,019,671 | 130.8867 |
| 2027/28 | 217,329 | 587,260,963 | 141.6955 |
| 2028/29 | 230,245 | 623,502,255 | 152.5044 |
| 2029/30 | 243,161 | 659,743,547 | 163.3133 |
| 2030/31 | 256,077 | 695,984,839 | 174.1222 |
| 2031/32 | 268,993 | 732,226,131 | 184.9311 |
| 2032/33 | 281,909 | 768,467,423 | 195.7399 |
4.2. Simulation Results of Long-Term Load Forecasting Using the ANN model
The forecast of power consumption in Hossana City using the ANN model is shown in Table 4.
| Time (years) | Population | GDP | Forecasted load (MW) |
|---|---|---|---|
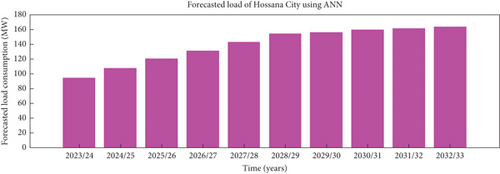
| 2023/24 | 165,665 | 442,295,795 | 94.5421 |
| 2024/25 | 178,581 | 478,537,087 | 108.2114 |
| 2025/26 | 191,497 | 514,778,379 | 120.4109 |
| 2026/27 | 204,413 | 551,019,671 | 131.5325 |
| 2027/28 | 217,329 | 587,260,963 | 142.7522 |
| 2028/29 | 230,245 | 623,502,255 | 154.3147 |
| 2029/30 | 243,161 | 659,743,547 | 156.1928 |
| 2030/31 | 256,077 | 695,984,839 | 159.8674 |
| 2031/32 | 268,993 | 732,226,131 | 161.6475 |
| 2032/33 | 281,909 | 768,467,423 | 163.9666 |
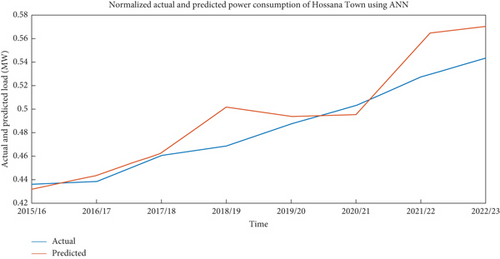
The simulation results of normalized actual and predicted load of 8 years using ANN are indicated in Figure 12.
The simulation result of the 10-year forecasted power consumption in Hossana City using ANN is represented in Figure 13.
The simulation result comparison of ANFIS and ANN is shown in Figure 14.
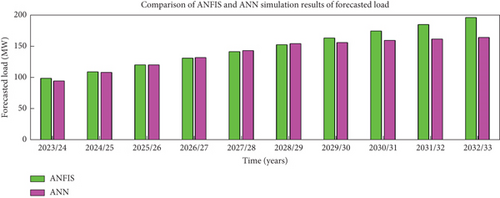
ANN needs a large amount of data to train the network effectively but ANFIS needs less input data because it uses fuzzy logic to generate rules from the data. In addition to this, ANN is a complex model that requires a lot of power to train and evaluate. ANN is a black box model and it is challenging to understand how the network arrived at its prediction. So, for load forecasting by which the input data are noisy and uncertain, ANFIS has the best performance for the exact prediction technique for long-term load forecasting. From the above result, it is observed that the performance specification of load forecasting MAPE and RMSE in ANFIS was improved by 2.0196% and 2.859984%, respectively, as compared with ANN. So ANFIS is the most manipulating optimization and prediction technique in electrical load consumption as well as in any operation and planning tasks.
As depicted in Table 5, The comparative analysis of ANN, ANFIS, and ANFIS-MPSO in predicting electric power consumption reveals significant differences in performance across key metrics. ANN, while a foundational model, demonstrates a MAPE of 3.82% and an RMSE of 5.29, indicating substantial prediction errors. In contrast, ANFIS improves accuracy with a MAPE of 1.79845% and an RMSE of 2.4282, showcasing its capacity to capture complex relationships in the data. However, ANFIS-MPSO emerges as the superior model, achieving a MAPE of 1.2% and an RMSE of 0.87, thanks to the optimization provided by MPSO. This model not only minimizes prediction errors effectively but also boasts a high R2 value of 0.97, demonstrating its reliability in explaining the variance in electric power consumption data. Overall, the results underscore the advantages of ANFIS-MPSO for accurate and efficient forecasting, making it a valuable tool for energy management and planning.
| Performance metric | ANN | ANFIS | ANFIS-MPSO |
|---|---|---|---|
| Mean absolute percentage error (MAPE) | 3.82% | 1.79845% | 1.2% |
| Mean absolute error (MAE) | 5.29 | 2.4282 | 0.85 |
| Mean squared error (MSE) | 28.07 | 5.88 | 0.75 |
| Root mean squared error (RMSE) | 5.29 | 2.4282 | 0.87 |
| Coefficient of determination (R2) | 0.75 | 0.85 | 0.97 |
5. Conclusion
To develop and assess models characterizing Hossana City’s electrical load consumption, data spanning 8 years (2015/16–2022/23) on GDP, population, and historical load was collected. The MATLAB software was employed to analyze and train the ANFIS, ANN, and MPSO-ANFIS models, minimizing the error between actual and predicted loads. The models successfully forecasted the city’s load consumption for the next 10 years. The evaluation of ANN, ANFIS, and ANFIS-MPSO for electric power consumption prediction highlights the significant advantages of employing advanced modeling techniques. While ANN provides a foundational approach, its performance is markedly improved by ANFIS, which better captures the complexities of the data. The integration of MPSO in ANFIS further enhances predictive accuracy, yielding superior results across all key metrics, including MAPE, RMSE, MAE, MSE, and R2. This positions ANFIS-MPSO as a highly effective tool for energy management, enabling more precise forecasting and informed decision-making. As the demand for efficient energy strategies grows, adopting such advanced models will be essential for optimizing resource allocation and enhancing operational efficiency in the energy sector.
Conflicts of Interest
The authors declare no conflicts of interest.
Author Contributions
Molla Addisu Mossie: conceptualization, methodology, software, validation, formal analysis, visualization, writing—original draft, data curation. Estifanos Abeje Sharew: supervision, writing, review, analysis, and editing. Tewodros Gera Workineh: grammar, review, and simulation. Yechale Amogne Alemu: resources, writing, review, and revising.
Funding
This research did not receive any specific grants from funding agencies in the public, commercial, or not-for-profit sectors.
Open Research
Data Availability Statement
The data that supports the findings of this study is available from the corresponding author upon reasonable request.


