Femtosecond Laser Inscribed Multiwavelength Cascaded FBG Array Using Point-By-Point Method for Temperature Sensing Based on Swept Laser Demodulation Technique
Abstract
A femtosecond laser inscribed quintuple-wavelength cascaded fiber Bragg grating (FBG) array for temperature sensing system based on swept laser source was proposed and experimentally demonstrated. In the proposed system, five cascaded 2-mm length FBGs were inscribed using the point-by-point method with a grating spacing of 2 cm through fiber acrylate coating. In addition, the demodulator based on swept modulated grating Y-branch (MG-Y) laser source was constructed. In the experiment, the FBG array was hold on temperature platform for heating and cooling test during 30∼90°C range, and sensitivity was more than 8.9 pm/°C with a linearity of 0.989.
1. Introduction
Owing to its several advantages, including lightweight structure, corrosion resistance, electromagnetic insulation, long lifespan, and narrow linewidth [1–6], fiber Bragg gratings (FBGs) is an important optical fiber component that has been widely used in the fields of optical communication, spectrum analysis, fiber laser, and fiber sensing [7–10]. In particular, in the field of optical fiber sensing, FBGs have been widely used as sensing units for temperature, strain, stretch, and vibration measurements for applications such as structural health monitoring, aerocraft loading test, and super-high temperature test, among others [11–13]. Moreover, FBG demodulators are important components of such sensing systems and significantly affect the quality of the interrogation result. Several techniques have been explored to develop fiber grating interrogation systems, including use of matched filters [14], sideband filtering [15], Mach-Zehnder interferometer (MZI) [16], spectrometer-based techniques [17], and scanning semiconductor lasers [18]. Among these techniques, the scanning semiconductor laser interrogation method has become a hot topic for research owing to its advantages like simple equipment structure, multiple channel operation and high demodulation precision.
Recent advances in FBG demodulation technologies, particularly those leveraging modulated grating Y-branch (MG-Y) laser-based systems, have demonstrated significant progress in high-precision sensing applications. For instance, Cheung et al. [19, 20] proposed a miniaturized and cost-effective demodulation system based on a tunable MG-Y laser. This instrument has a wide tuning range of 1527 nm–1567 nm, a wavelength interval of 8 pm, and can achieve a tuning rate of 100 Hz for the Fabry–Perot interferometer (FPI) sensor. Inspired by the demodulation algorithm of FPI sensors in the field of fiber-optic sensing, they further proposed a method based on a widely tunable MG-Y laser combined with a cross-correlation algorithm in the same year to achieve high-precision measurement of the optical thickness of each layer in multilayer optical samples. Furthermore, Liu et al. [21] proposed a quintuple-wavelength phase demodulation technique for a Fabry–Perot sensor probe based on the MG-Y method; in addition, Zhao et al. [22] experimentally studied that a widely tunable MG-Y laser achieved high tuning wavelength precision and accuracy of 0.1 pm in the temperature range of 25°C to +75°C, The tuning accuracy improvement is about two orders for magnitude. As mentioned earlier, an FBG and interferometer have been used as sensing components in previous works. However, for some sensing applications, monitoring of multiple sensing points is necessary in the field such as structural health monitoring, flexible tactile sensing, distribution sensing [23] and so on; thus, several FBGs need to be cascaded in the system, and a demodulator needs to be designed to ensure functionality for multiple FBGs interrogation.
To address the critical challenge of real-time multipoint temperature monitoring in spatially distributed systems, we propose and implement a high-precision multiplexed FBG sensing system comprising five cascaded FBGs and an MG-Y swept laser demodulator. Our solution employs femtosecond-laser-inscribed FBG arrays combined with custom demodulation algorithms, achieving ±0.5°C measurement accuracy across 30°C–90°C. These advancements enable practical industrial applications such as thermal mapping in power facilities, demonstrating potential for significant operational cost reductions.
2. Experimental Setup
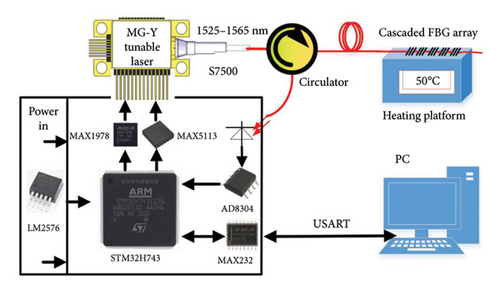
Our proposed FBG sensing system schematic diagram is shown in Figure 1; it is composed of a cascaded five-wavelength FBG array, interrogator, fiber circulator, and personal computer (PC). Further, the proposed interrogator is composed of an MG-Y swept laser current source driver, logarithmic amplifier, temperature controller, and photoelectric acquisition. In particular, a MAX5113 constant-current source chip driven by an ARM STM32H743 chip and high-precision temperature control MAX1978 chip are used as MG-Y laser. A photo diode (PD) detector and AD8304 logarithmic amplification circuit were used to collect reflection wavelength data from FBGs.
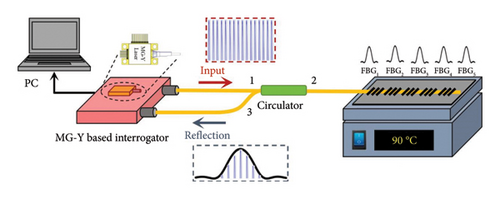
The wavelength sweeping range generated by MG-Y laser source is 1527–1567 nm with 20 pm intervals. The light emitted by the swept laser is coupled into the circulator from port 1, and coupled into FBG array from port 2, the five FBGs reflection spectra are injected into interrogator by circulator port 3. The FBG reflection spectrum data are converted by the photoelectric pre-processing module, and these are then converted into digital signals via the integrated analog-digital converter (ADC), then, relevant data is transmitted to the PC, and FBG array reflection spectrum is calculated by peak detection algorithm When the temperature around the FBG unit is changed, the period of the FBG’s grating length changes; thus, the resulting reflection wavelength simultaneously changes, and therefore, temperature measurement can be realized by determining the peak position of FBG reflection spectrum.
3. Experimental Results
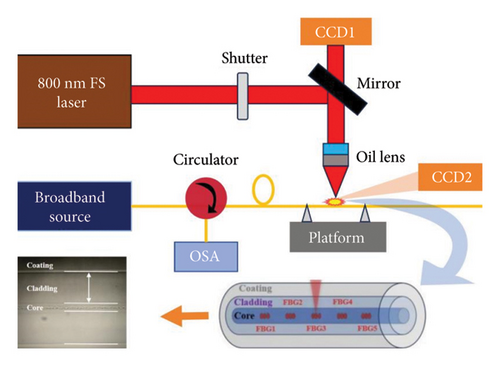
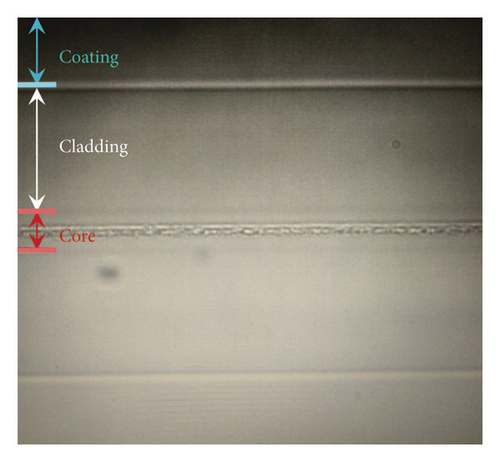
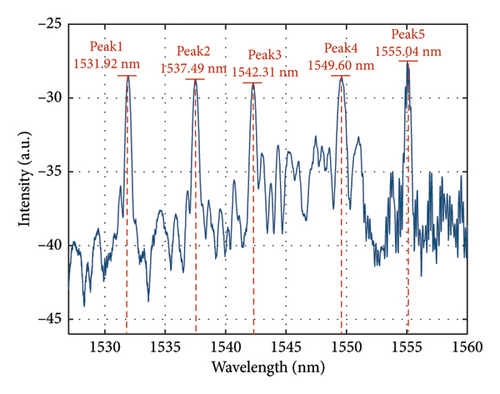
For our five-wavelength FBG array inscription experiment, a C + L broadband applied spontaneous emission (ASE) source was selected to obtain the FBG array reflection spectra. The FBG periods were selected as 530, 532, 534, 536, and 538 nm, respectively, and five first-order FBGs were inscribed onto the fiber core using the femtosecond laser through the acrylate coating and cladding one at a time. The FBG’s grating length was 2 mm, while the grating interval was 2 cm. The image of the inscription area is shown in Figure 3(a) with FBG reflection wavelength peaks observed at 1531.92, 1537.49, 1542.31, 1549.6, and 1555.04 nm as shown in Figure 3(b), and FBG spectrum was collected by OSA (AQ6375, Yokogawa). For the inscribed FBG, 3 dB linewidth was 0.52, 0.51, 0.64, 0.73, and 0.65 nm, respectively.
The real image and diagram of our proposed interrogator system are shown in Figures 4(a), 4(b), respectively; this system is composed of an MG-Y laser with a sweeping range of 1527∼1567 nm and maximum output power of 20 mW (S7500, Finisar, US). An STM32H743 ARM chip was used to control the MAX5113 (Maximum, US) constant-current source chip through a serial peripheral interface (SPI) in order to generate five channel currents to drive the MG-Y laser output. To guarantee the stability of the MG-Y laser emission, a temperature control circuit system was constructed using a MAX1978 chip (Maximum, US) to maintain a working temperature condition of 25°C. The reflection spectrum data was collected by a logarithmic detector (AD8304, AD, US) and was converted to digital signals using a 16 bit ADC integrated onto the ARM chip. These digital signals were then transmitted to the PC for center wavelength peak search through a Universal Synchronous/Asynchronous Receiver/Transmitter (USART), which serves as the interface for data transmission between the demodulator and the PC. In addition, power to the interrogator system was supplied via an LM2576 chip.
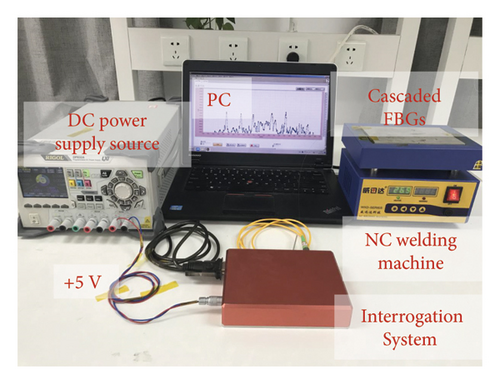
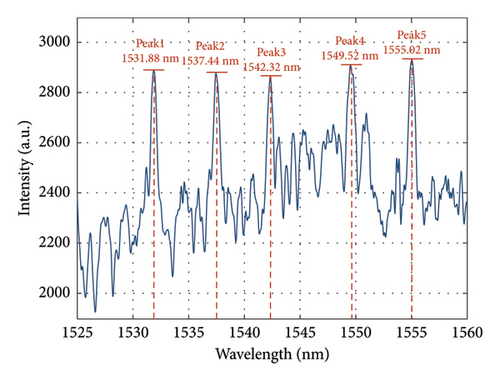
The cascaded FBG array temperature experimental system based on the MG-Y scanning laser source method is shown in Figure 5(a); it is composed of a programmable direct current (DC) power supply source (RIGOL), interrogator, five cascaded FBGs, temperature measurement platform, and PC. In addition, the demodulator was supplied by a 5 V power supply and the corresponding current was limited to 0.5 A at 25°C. The femtosecond laser inscribed cascaded FBG array was connected to the interrogator system through a fiber-optic flange, while the FBG array was set on the platform. As the temperature around grating was changed, the grating period was accordingly adjusted, and reflection wavelength of each FBG shifted. The proposed demodulator swept the reflection spectrum of the cascaded sensor array, and transmitted the spectral information to PC for analysis through USART. As shown in Figure 5(b), the FBG reflection spectrum was collected and calculated by proposed interrogator, and five independent FBGs reflection wavelengths could be shown.
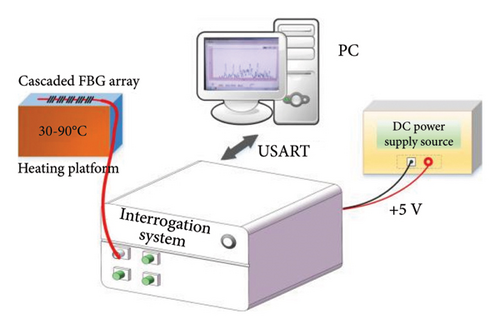
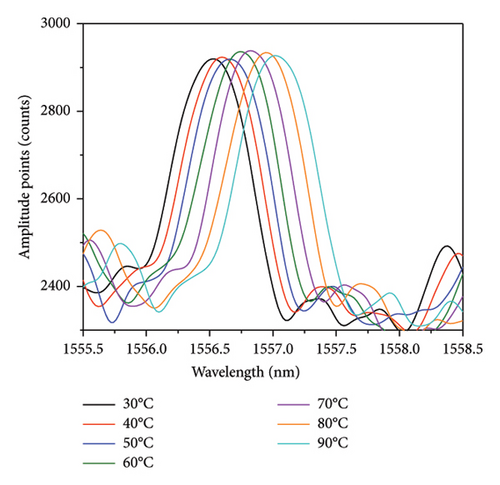
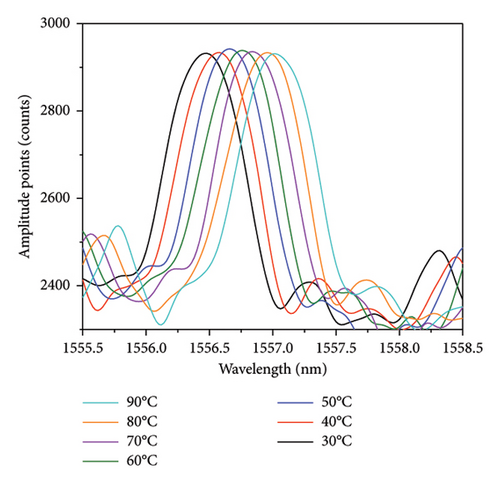
In our experiment, the cascaded FBG array was set on the temperature platform and the temperature was increased from 30°C to 90°C in 10° intervals; the corresponding reflection wavelength peak positions of the FBGs were then obtained. FBGs with reflection center wavelength at peaks 1, 3, and 5 were selected for data analyze; during temperature heating process, the spectral wavelengths of these peaks show red-shifted phenomenon as depicted in Figures 6(a), 6(c), 6(e). Similarly, when the temperature was reduced from 90°C to 30°C, the wavelength spectra of the three FBGs shifted toward the short-wave direction as shown in Figures 6(b), 6(d), 6(f).
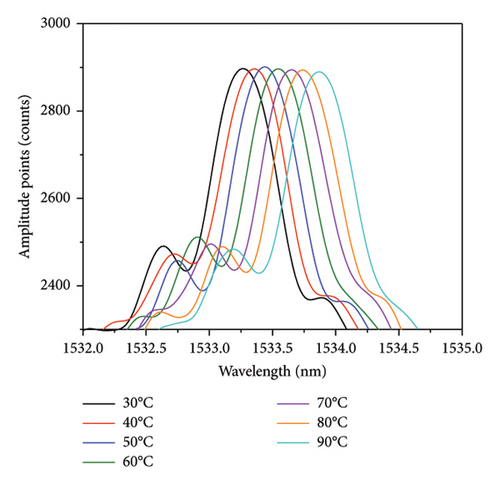
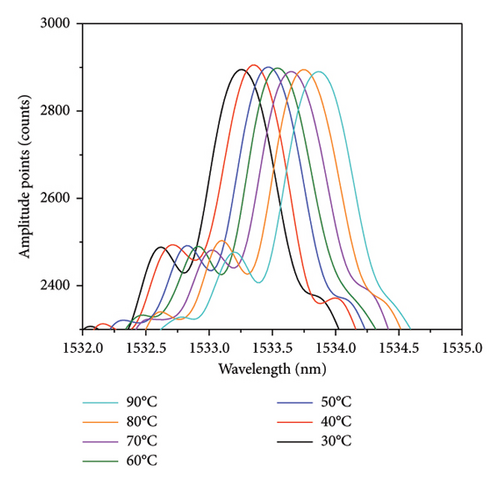
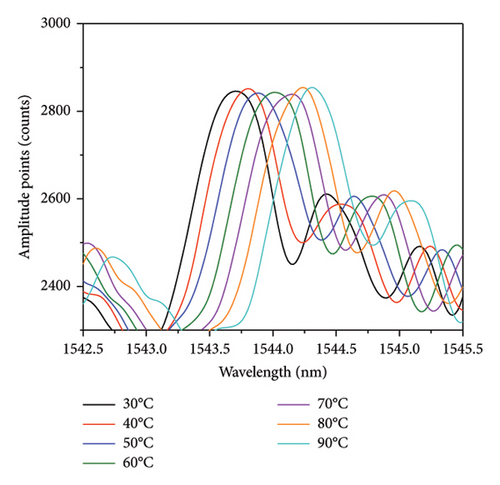
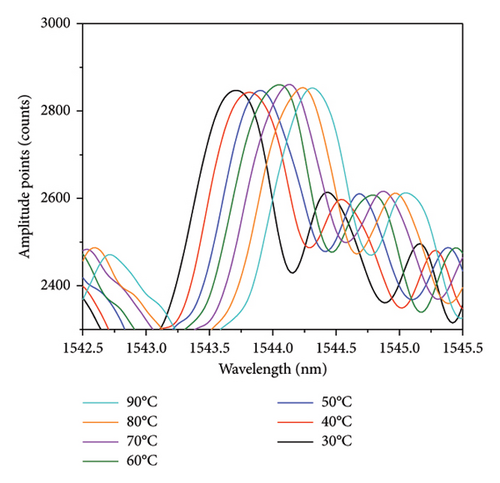
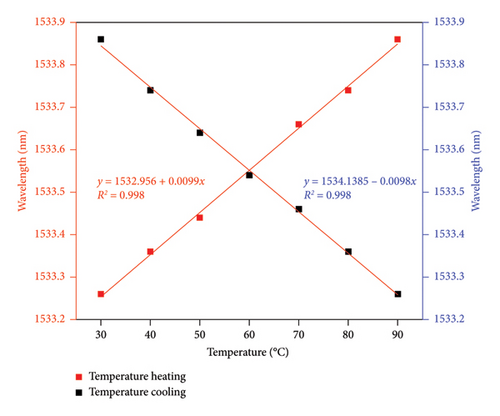
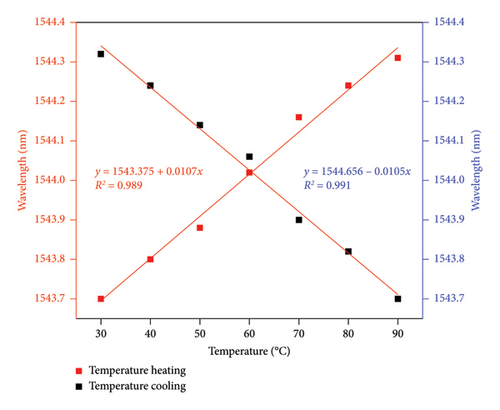
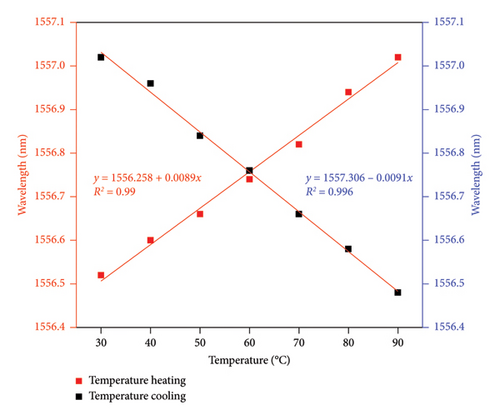
For the temperature increase from 30°C to 90°C, the sensitivities at Peaks 1, 3, and 5 were 9.9 pm/°C, 10.7 pm/°C, and 8.9 pm/°C, respectively, and the corresponding linearity values were 0.998, 0.989, and 0.99. In contrast, when the temperature decreased from 90°C to 30°C, the sensitivities of Peaks 1, 3, and 5 were 9.8 pm/°C, 10.5 pm/°C, and 9.1 pm/°C, respectively, and the corresponding linearity values were 0.998, 0.991, and 0.996, and which are shown in Figure 7.
4. Conclusion
In this study, we proposed and demonstrated a temperature sensing system for quintuple-wavelength cascaded FBGs based on a swept laser source. The first-order cascaded FBGs were fabricated using a femtosecond laser through a point-by-point method and the length of each grating length was 2000 μm. For our temperature heating experiment from 30°C to 90°C, the relationship between the center wavelength of three different reflection peaks were measured with a high degree of linear fit (R2 > 0.989) with a slope of 8.9 pm/°C. Similarly, during cooling process too, the measured relationship had a high degree of linear fit (R2 > 0.991) with a slope of 9.1 pm/°C. Thus, our temperature measurement experimental results indicate that our proposed system has potential for use in fiber sensor systems in the fields of spectrum analysis and engineering.
Conflicts of Interest
The authors declare no conflicts of interest.
Funding
This work was supported by the Ningxia Hui Autonomous Region Natural Science Foundation (2023AAC03258), the Ningxia Key Research and Development Program (2021BEB04014), and the Fundamental Research Funds for the Central Universities, North Minzu University (2025XYZDX02).
Open Research
Data Availability Statement
Data are available on request from the authors.


