Response of the Magnetospheric Convection Electric Field (MCEF) to Geomagnetic Storms During the Solar Cycle 24 Maximum Phase
Abstract
The present work focuses on the variability of the magnetospheric convection electric field (MCEF) during geomagnetic storms generated by coronal mass ejections (CMEs). The aim of the study was to analyze the response of the MCEF to geoeffective CMEs occurring during the maximum phase of Solar Cycle 24. A total of eight storms were selected on the basis of their intensity with respect to the Dst (disturbance storm time) and Kp (planetary geomagnetic index) indices. We examined the variations in solar wind parameters (VSW (solar wind speed), PSW (plasma pressure), and interplanetary magnetic field (IMF) Bz) and geomagnetic indices (Sym-H (symmetric horizontal) and auroral electrojet (AE)) during these storms. We analyzed the time lag between the MCEF and AE, Sym-H, and IMF Bz using a cross-correlation analysis. The study shows that CMEs arriving in the magnetosphere at a speed of 800–960 km/s induce a change in MCEF of 0.95–1.29 mV/m in the initial phase, and those transiting at a speed of 520–651 km/s induce a change in MCEF of 0.78–0.91 mV/m. During storms associated with CMEs arriving at a speed of 520–651 km/s, a change in IMF Bz of 1 nT is associated with a change in MCEF of about 0.05 mV/m. During those associated with CMEs transiting at a speed of 800–960 km/s, each 1 nT change in IMF Bz corresponds to a change in MCEF of about 0.07 mV/m. Variations in the MCEF follow those in the AE index in 88% of the storms studied, with a time lag ranging from 9 to 79 min. They precede those of the ring current index (Sym-H) in 50% of the cases analyzed, with a time lag varying from 49 to 742 min. These results provide us with some information on the complete evolution of geomagnetic storms, with a view to better prediction.
1. Introduction
The sun is the main cause of geomagnetic activity through the solar wind (SW) and electromagnetic radiation. During the interaction between the SW and the earth, the SW brings an enormous amount of energy to the earth’s environment through various space weather events such as coronal mass ejections (CMEs) and corotating interaction regions (CIRs) [1–6]. These energies disrupt regular geomagnetic activity, causing geomagnetic storms [7].
Solar activity was organised into four classes of geomagnetic activity by Legrand and Simon [8] based on the geomagnetic index aa calculated by Mayaud [9]. It was approved by Ouattara and Amory-Mazaudier [10] and improved by Zerbo et al. [11]. These are (1) days of quiet activity, which are days when aa < 20 nT; (2) recurrent event activity corresponds to days when aa ≥ 20 nT and is repeated at the same solar longitude for at least two consecutive solar rotations without sudden storm commencement (SSC); (3) shock event activity: days with SSC when aa ≥ 20 nT; and (4) fluctuating activity not included in the three previous classes. Recurrent activity is the manifestation of fast SWs from coronal holes, and shock activity is due to CMEs.
A magnetic storm occurs when the process of transferring matter and energy from the SW into the magnetosphere is strong and long-duration [12]. It is characterised by three phases: the initial phase, the main phase, and the recovery phase. Geomagnetic indices are used to characterise a magnetic storm. The most commonly used of these are the Dst (disturbance storm time) or Sym-H (symmetric horizontal) (Sym disturbance index) and AE (auroral electrojet) indices [13, 14]. The Dst index represents the decrease in the intensity of the horizontal component of the earth’s magnetic field due to the increase in the magnetospheric ring current at low latitudes, which is the most common approach for detecting the strength of magnetic storms and the magnetospheric ring current [15–18]. A positive Dst or Sym-H indicates the contraction of the magnetosphere as a result of the increased pressure of the SW [5]. The AE index quantifies the overall activity of the electrojet in the auroral zone [19, 20]. Based on the minimum values of the Dst, magnetic storms are classified as follows: weak magnetic storms (−50 nT < Dst ≤ −30 nT), moderate magnetic storms (−100 nT < Dst ≤ −50 nT), intense magnetic storms (−200 nT < Dst ≤ −100 nT), severe magnetic storms (−350 nT < Dst ≤ −200 nT), and extreme magnetic storms (Dst ≤ −350 nT) [7, 21].
The SW carries with it a tiny portion of the sun’s magnetic field. The magnetic field carried by the SW into interplanetary space is the interplanetary magnetic field (IMF). The IMF, carried along by the SW, generates an electric field. This electric field, frozen in the SW, is called the interplanetary electric field (IEF). During the interaction between the SW and the earth’s magnetosphere, some of the solar plasma is transferred to the magnetosphere. This SW-magnetosphere coupling also creates an electric field called the magnetospheric electric field, which is oriented from dawn to dusk and is responsible for plasma convection in the magnetosphere [22–25].
Satisfactory qualitative interpretations of magnetospheric dynamics, such as the injection and acceleration of particles into the magnetosphere and magnetospheric convection of low-energy plasma, have been made by various authors [26–35]. Dungey’s magnetic reconnection is now accepted as the main mechanism by which energy, matter, and motion are transferred from the SW to the magnetosphere.
Also, previous studies have highlighted the dependence of (1) the magnetospheric convection electric field (MCEF) on geomagnetic activity [27, 34, 35], (2) the MCEF on the orientation of the IMF [26, 30, 32], and (3) the MCEF on the IEF of the SW [31, 33]. Recently, Salfo and Frédéric [35] studied the statistical variability of the MCEF in perturbed periods during Solar Cycles 19–23. In this paper, we study the variability of the MCEF during magnetic storms generated by CMEs in the maximum phase of Solar Cycle 24. Our objective is therefore to analyze the daily response of the MCEF during these specific cases of magnetic storms generated by CMEs. To do this, several magnetic storms were reviewed: calm magnetic activity (Kp < 3) for several days before the occurrence of the magnetic storm and intense magnetic activity (Kp ≥ 5 nT) on the day of the storm were the criteria used to select eight of them (Table 1).
| Storm date | SSC date and time | Dst (nT) | Kp (nT) | Issue date and time of the CME | Speed average CME transit (km/s) | Average transit time for CME (hours) |
|---|---|---|---|---|---|---|
| 15-03-2012 | 15-03 (13:06) | −88 | 6 | 13-03-2012 (17:36) | 960 | 44 |
| 24-04-2012 | 23-04 (03:20) | −120 | 7 | 19-04-2012 (15:12) | 520 | 84 |
| 15-07-2012 | 14-07 (18:09) | −139 | 7 | 12-07-2012 (16:48) | 850 | 49 |
| 1-10-2012 | 30-09 (23:05) | −122 | 7 | 28-09-2012 (00:12) | 590 | 71 |
| 17-03-2013 | 17-03 (05:59) | −132 | 7 | 15-03-2013 (07:12) | 890 | 47 |
| 2-10-2013 | 2-10 (01:54) | −72 | 8 | 29-09-2013 (22:12) | 800 | 51 |
| 27-02-2014 | 27-02 (16:50) | −97 | 5 | 25-02-2014 (01:25) | 651 | 64 |
| 12-09-2014 | 12-09 (15:53) | −88 | 6 | 10-09-2014 (18:00) | 920 | 45 |
- Note: Source: List of CMEs (Richardson and Cane).
In Section 2, the study data and analysis methods are described. The results are reported in Section 3. Discussions of the study can be found in Section 4, and the conclusion is presented in Section 5.
2. Data and Analysis Methods
2.1. Data
The values of the Ey IEF frozen in the SW are used to determine the MCEF. They are available on the website (https://omniweb.gsfc.nasa.gov/form/dx1.html). SW parameters (solar wind speed (VSW), plasma pressure (PSW), and the Bz component of the IMF (IMF Bz)) are used to better appreciate the contribution of solar activity on the magnetosphere. The geomagnetic indices (Kp (planetary geomagnetic index) and Dst) are used to characterise the magnetic storms identified, and the indices AE and Sym-H are used to gain a better understanding of their dependence on the MCEF.
The values of VSW, PSW, and IMF Bz and those of Kp, Dst, Sym-H, and AE are available on the website (https://omniweb.gsfc.nasa.gov/form/dx1.html). The quietest days of the month are also used and can be obtained from the website (https://wdc.kugi.kyoto-u.ac.jp/qddays).
2.2. Analysis Methods
The work consists of analyzing the response of the MCEF to sudden-onset magnetic storms (SSCs) due to CMEs during the maximum phase of Solar Cycle 24 (2012–2014). To ensure that the impact of the CME is strong, we use the Kp and Dst indices. The day of the SSC corresponds to the first day of the magnetic storm. We look for situations where the Kp index is at least once greater than or equal to 5 (Kp ≥ 5 nT) during that day or during the following day and the Dst minimum index is less than or equal to −50 nT (Dst ≤ −50 nT). To select CMEs isolated in time, we look for calm magnetic situations upstream and downstream of the SSC day. A calm day is identified by the index Kp being less than 3 (Kp < 3). This method of selecting isolated CMEs was inspired by Azzouzi [36]. Table 1 summarizes the characteristics of the magnetic storms identified.
To study the variability of the MCEF, we superimpose the daily profiles of SW parameters (VSW, PSW, and IMF Bz), geomagnetic indices (Sym-H and AE), and the MCEF. We will first analyze the temporal variations of the MCEF in comparison with those of the solar parameters and indices (AE and Sym-H) over the complete evolution of the storms. We then use a cross-correlation analysis to determine the lags between the MCEF and IMF Bz, AE, and Sym-H for each storm. In order to quantitatively evaluate the variations in the MCEF and IMF Bz, AE, and Sym-H, a linear regression analysis at the offset corresponding to the extreme correlation was carried out for each storm. For the MCEF, the variability on the day of the calmest month was taken as the reference.
In order to establish a link between the CME and the MCEF fluctuations observed during the storm, we analyze the dependence between the mean transit speeds of the CMEs reported in Table 1 and the first MCEF turns observed in the initial phase after the onset of the magnetic storms, as well as that between the mean transit speed of the CME and the maximum speed (VSW) of the SW in the initial phase using a linear correlation analysis.
3. Results
Figures 1, 2, 3, 4, 5, 6, 7, and 8 show the temporal variations in VSW, PSW, IMF Bz, Sym-H, AE, and MCEF during the storms selected for the study. From the top to the bottom of each figure, the panels correspond, respectively, to the daily variation in IMF Bz, VSW, PSW, Sym-H, AE, and MCEF. The black graph in the lower panel shows the change in MCEF on a stormy period, while the blue graph shows the change in MCEF on a very calm day. The time of the start of the storm is taken as the time origin (t = 0). The start of the storm is represented by the first vertical red line in each figure. The space delimited by the first red vertical line and the second corresponds to the initial phase of the storm, which we have noted as I in the figure. Similarly, the main phase (M) is delimited by the second and third vertical red lines, and finally, the third and fourth vertical red lines delimit the recovery phase (R).
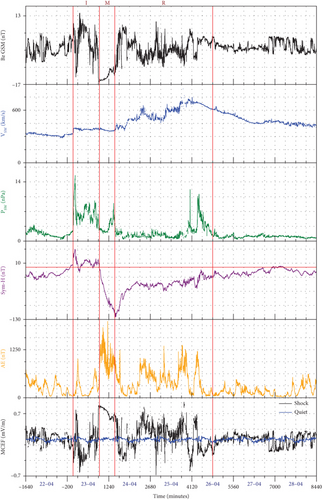
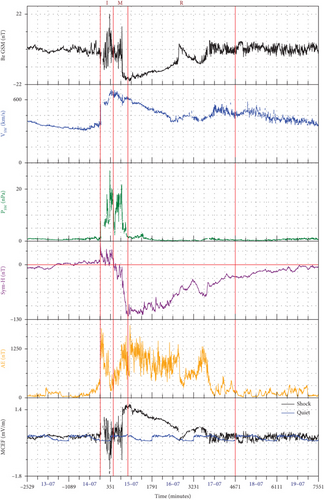
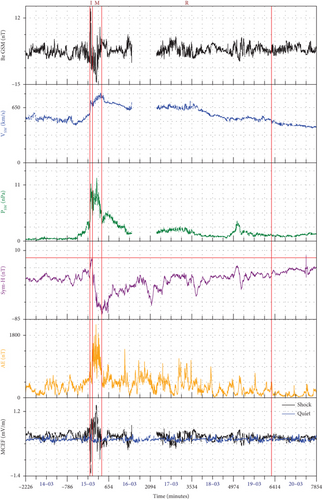
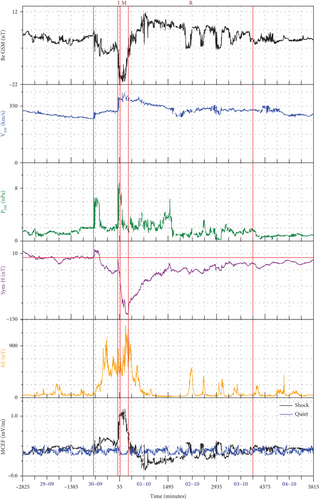
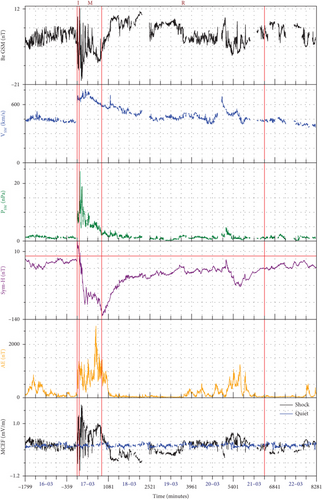
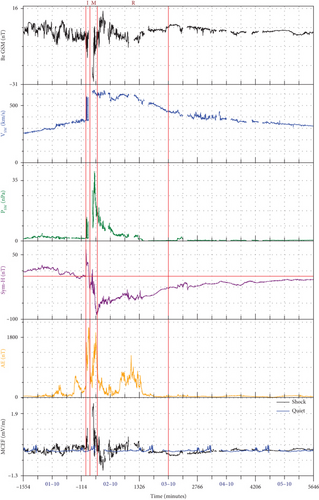
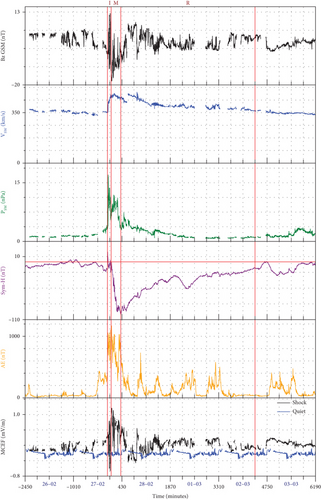
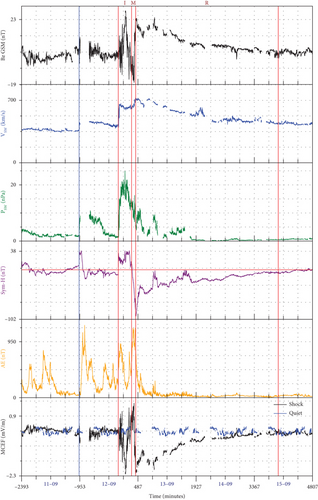
Figure 9 shows the cross-correlation and linear regression between the MCEF and IMF Bz, AE, and Sym-H during the complete evolution of the storm on 24 April 2012. Figures 9(a), 9(b), and 9(c) correspond, respectively, to the cross-correlation between the MCEF and AE, the MCEF and Sym-H, and the MCEF and IMF Bz. Figures 9(e), 9(d), and 9(f) show the corresponding linear regression.
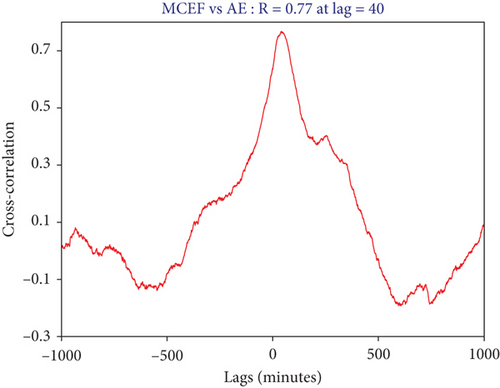
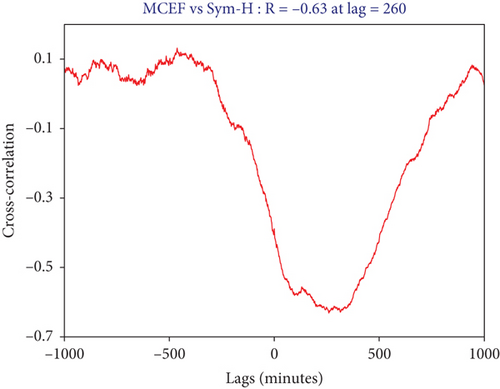
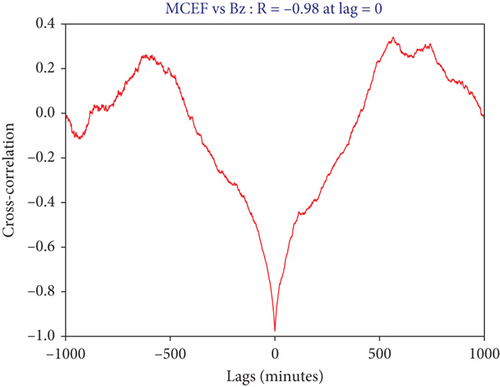
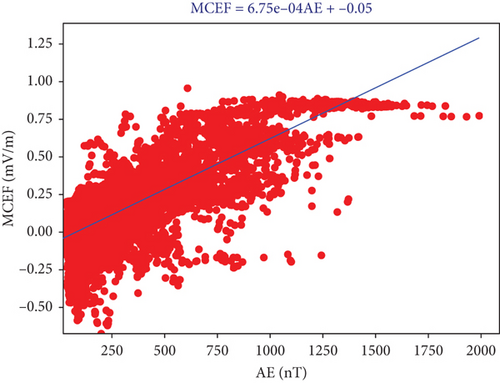

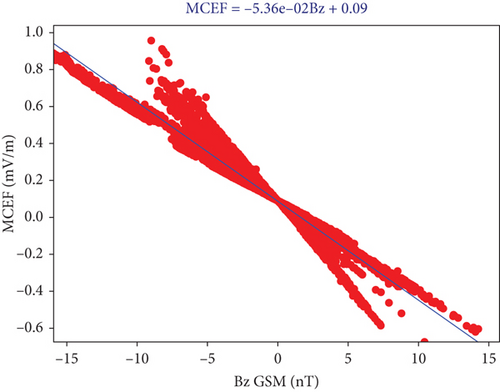
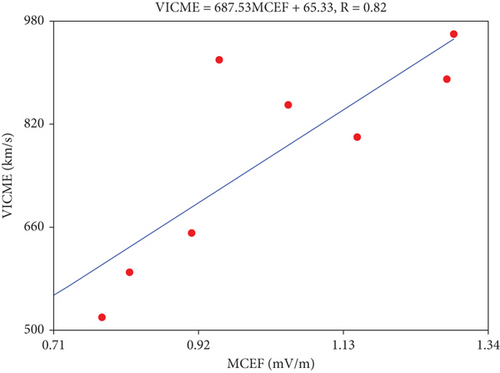
Figure 10 analyzes the dependence between the mean transit speed of the CME (VICME (mean velocity of the interplanetary coronal mass ejection)) and the very first change in MCEF in the initial phase and the dependence between the mean transit speed of the CME and the maximum speed (VSW) of the SW in the initial phase.

3.1. MCEF Variability During the Magnetic Storm of 24 April 2012
The storm of 24 April 2012 began on 23 April at 03:20 UT (Universal Time) when the MCEF was westward by 0.41 mV/m and the IMF Bz northward by 10 nT. During the prestorm period, the MCEF was close to that of the very calm period, with small variations. The same is true of the IMF Bz and the Sym-H index. However, the AE index showed peaks, the largest of which (650 nT) was observed 600 min before the start of the storm. Around 100 min after the start of the storm, while the MCEF moved eastwards by 0.78 mV/m, a variation of 1.21 mV/m, the IMF Bz fluctuated from north to south by 23.7 nT. The Sym-H index reached 45 nT after 60 min, and the AE index recorded a second peak of 1000 nT at 160 min. The rise in VSW (401 km/s) and PSW (15.6 nPa) in the initial phase due to the arrival of the shock wave was observed 60 min after the start of the magnetic storm, that is, 30 min before the MCEF turned eastwards. After 100 min, the MCEF turned westwards, showing a variation of 1.39 mV/m at 220 min, that is, a duration of 120 min. This variation corresponds to a change in the IMF Bz of 28.2 nT. The Sym-H index, after decreasing for 60 min, showed a change of 68 nT at the same time, while the AE index showed a decrease of 920 nT with a time lag of 180 min. Between 220 and 680 min, the MCEF showed a second eastward increment of 1.34 mV/m for a northward IMF Bz change of 27 nT. The Sym-H index showed an earlier increment of 33 nT at 560 min, while the AE index showed a third increment of 720 nT later at 760 min. Between 680 and 740 min, the MCEF suddenly shifts westwards, changing by 1.05 mV/m, while the IMF Bz shows a northward increment of 22 nT. Before this westward movement of the MCEF, the Sym-H index, after a decrease that began 560 min ago, varied by 21 nT at 680 min, that is, a time lag of 60 min compared with the fall time of the MCEF. The AE index decreased again by 600 nT with a time lag of 90 min with respect to the MCEF fall time. From 740 to 915 min (end of the initial phase and start of the main phase), the MCEF reached its maximum value (0.91 mV/m), an increment of 1.26 mV/m compared with the value recorded at 740 min. At the same time, the IMF Bz moved southwards, showing a change of 25 nT. The Sym-H index showed a northward polarity of 21 nT around 100 min before the peak of the MCEF, and the AE index showed a peak of 1850 nT, an increase of 1680 nT around 90 min later in the main phase of the storm.
In the main phase (915–1446 min), the MCEF remains generally oriented towards the east and gradually decreases, showing a change of 0.38 mV/m at the end of the phase. At the same time, the IMF Bz, which is constantly oriented towards the south, decreases, showing a change of 6.7 nT. The Sym-H index reached its minimum value (−125 nT) at the same time as the MCEF, a variation of 122 nT compared with its value at the start of the phase. Similarly, the AE index, after decreasing 90 min after the start of the phase, reached a minimum without any time delay compared with the MCEF. The corresponding change was 1030 nT.
In the recovery phase, an alternation of MCEF peaks and troughs was observed. The peaks occurred at 2490 (0.84 mV/m), 3140 (0.69 mV/m), 3780 (0.78 mV/m), and 4260 min (0.69 mV/m). The troughs occurred at 1830 (−0.35 mV/m), 2860 (−0.65 mV/m), 3430 (−0.21 mV/m), 4040 (−0.57 mV/m), and 4500 (−0.26 mV/m). A few moments after the MCEF peaks were observed, the Sym-H showed south polarities (−57, −61, −47, and −51 nT, respectively). At almost the same time, the AE index also showed peaks (1000, 1360, 1400, and 1250 nT). The behaviour of the Sym-H during the recovery phase, characterised by its relapses, indicates the presence of magnetic substorms. After 4500 min, the MCEF gradually approaches that of a very quiet activity.
3.2. Variability of the MCEF During the Magnetic Storm of 15 July 2012
The storm of 15 July 2012 began on 14 July at 18:09 UT when the MCEF was directed eastwards by 0.13 mV/m. After the shock, it moved further there by 1.04 mV/m at around 140 min. At the same time, the IMF Bz moved southwards by 12.4 nT. At the start of the magnetic storm, the Sym-H index reached a maximum of 42 nT, and 50 min later, the AE index peaked at 1800 nT. During the calm period before the storm, the MCEF was similar to that during the very calm period. A similar behaviour is observed in the evolution of the IMF Bz and the ring current index during the prestorm period. The global AE index began to increase 300 min before the start of the storm. At 310 min, the MCEF showed a variation of 2.7 mV/m to the west, while the IMF Bz turned north, changing by 34.8 nT. At the same time, the Sym-H and AE geomagnetic indices, after decreasing, reached −3 and 890 nT, respectively, after 310 min for the Sym-H and 260 min for the AE index. After 310 min, the MCEF shifted eastwards again and the IMF Bz southwards until the end of the initial phase. The AE index also rises, and the Sym-H index begins to move southwards. The VSW and PSW reached 695 km/s and 27.3 nPa, respectively, in the initial phase.
In the main phase (450–956 min), the MCEF reached 1.65 mV/m at the end of the main phase, after rising from the initial phase. The IMF Bz, which turned south, reached −18 nT. The AE index reached 1600 nT before the end of the phase, while the Sym-H index continued to fall to its minimum value (−123 nT).
In the recovery phase (956–4671 min), the MCEF decreased progressively between 956 and 2715 min, that is, a change of 1.6 mV/m after 1759 min. At the same time, the IMF Bz showed a change of 22.1 nT. While the Sym-H index increased as a result of the decrease in ring current intensity, showing a change of 75 nT, the AE index decreased, showing a change of 1440 nT. At 3430 min, an MCEF peak was observed. Later, at 3540 min, the AE index showed a peak of 1330 nT. The Sym-H index fell back to −73 nT at 3630 min. The rise in AE and the fall in Sym-H during the recovery phase confirm the presence of a magnetic substorm. After 3430 min, the MCEF fell progressively and was broadly close to that of the reference very calm day from 4671 min.
3.3. MCEF Variability During the Magnetic Storm of 15 March 2012
At the start of the storm on 15 March at 13:06 UT, the MCEF moved westwards by 0.35 mV/m. It moved further west by 1.29 mV/m after 30 min, a change of 0.93 mV/m. During this period, the IMF Bz varied from south to north by 21.4 nT, and the AE index reached 1030 nT after an increase that began in the calm period upstream. The Sym-H index increased and showed a change of 29 nT after 61 min, a time lag of 36 min. The VSW and PSW reached 735 km/s and 11.4 nPa, respectively. The evolution of the MCEF during the calm period upstream was similar to that during the very calm period. However, a peak in MCEF of 0.51 mV was observed 650 min before the start of the storm. This MCEF peak was preceded by a peak in the AE index observed 50 min earlier. Between 25 and 61 min after the start of the storm, the MCEF tilted eastwards, showing a variation of 2.27 mV/m as the IMF Bz moved southwards by 24.4 nT and the AE index decreased by 600 nT.
After 61 min, the MCEF continued to grow and reached a peak of 1.5 mV/m at 217 min into the main phase. The IMF Bz moved further south by 14 nT. The AE index peaked at 2130 nT at almost the same time, while the Sym-H index became strongly negative as a result of the progressive intensification of the ring current. The VSW and PSW reached their maxima of 830 km/s and 12.4 nPa, respectively. After 217 min from the start of the storm, the MCEF decreases by 1.60 mV/m until the end of the main phase (410 min), while the IMF Bz moves northwards by 17.2 nT. The Sym-H index reached its minimum value of −78 nT, and the AE index fell by 1720 nT.
In the recovery phase, MCEF peaks were observed. The largest were located at 610 (0.51 mV/m), 1183 (0.54 mV/m), 1460 (0.65 mV/m), 3600 (0.51 mV/m), and 5190 min (0.47 mV/m). The IMF Bz showed a southward polarity of around −5 nT at these times. A few minutes after the onset of each MCEF peak, the Sym-H index showed a pronounced southward polarity (−74 nT/654 min, −54 nT/1200 min, −65 nT/2110 min, −54 nT/3690 min, and −44 nT/5230 min). The AE index recorded respective maxima of 630 nT/654 min, 1410 nT/1200 min, 1060 nT/1890 min, 1080 nT/4170 min, and 910 nT/5710 min.
3.4. MCEF Variability During the Magnetic Storm of 1 October 2012
The storm of 1 October 2012 was preceded by the impact of a first CME that shook the magnetosphere on 30 September at 11:05 UT (−720 min). The time of impact of this CME is shown in Figure 4 as a vertical blue line. During this low-intensity shock, a sudden rise in the MCEF was observed. This rise lasted until the beginning of the storm when the MCEF recorded a value of 0.45 mV/m. During this time, the IMF Bz shifted southwards by 6 nT. The Sym-H index, after rising to 22 nT at −680 min, returned to −32 nT at the start of the storm. During this shock, the AE index also increased, peaking at 1050 nT at around −300 min. PSW and VSW reached 7 nPa and 315 km/s, respectively, just after this shock. During the calm period upstream, the MCEF was close to that of the very calm period. No significant variations were observed in the evolution of the IMF Bz, Sym-H index, AE index, VSW, and PSW. On 30 September at 23:05 UT, a second shock hit the magnetosphere. The MCEF rose sharply to 0.82 mV/m after 15 min. The IMF Bz moved south by 14 nT. The AE and Sym-H indices rose to 870 and −5 nT, respectively, at the hour of shock for the Sym-H and 15 min after shock for the AE index. After 20 min, the MCEF suddenly bifurcates westwards by 0.35 mV/m before being pushed back eastwards, where it reaches the value of 1.06 mV/m at the end of the initial phase at 70 min. During this time, the IMF Bz fluctuated from south to north, then from north to south, reaching a value of −21.3 nT at the end of the initial phase. During this time of abrupt fluctuations in the MCEF, the Sym-H and AE indices showed a decrease until the end of the initial phase. VSW reached 403 km/s, and PSW reached 9 nPa in the initial phase.
In the main phase of the magnetic storm (70–315 min), the MCEF continued to grow and reached its maximum value of 1.16 mV/m at around 150 min, when the IMF Bz moved south by 20 nT. The Sym-H index reached its minimum value (−138 nT), and the AE index reached its maximum peak of 1250 nT at 225 min, before decreasing until the end of the phase. After 150 min, the MCEF decreases throughout the rest of the main phase. The decrease in MCEF continued into the recovery phase until 770 min.
In the recovery phase, MCEF peaks were observed at 2070 (0.35 mV/m), 2500 (0.30 mV/m), and 2980 min (0.35 mV/m). At these times, the IMF Bz exhibited a southern polarity of around −5 nT. At almost the same instants, the Sym-H index showed southern polarities of −42, −40, and −35 nT, respectively. The same applies to the AE index, which showed peaks of 520, 400, and 350 nT. After 2980 min, the MCEF decreases and gradually approaches that of the very calm day from 3500 min.
3.5. MCEF Variability During the Magnetic Storm of 17 March 2013
The magnetic storm began on 17 March at 05:59 when the MCEF was already westward by 0.64 mV/m. After 30 min, the MCEF moved east by 1.28 mV/m, a change of 1.92 mV/m. The IMF Bz showed a change of 22.7 nT, and the global AE index increased by 1370 nT. At the start of the magnetic storm, the Sym-H index reached its maximum, and as the MCEF rose, it showed a decrease of 20 nT. In the initial phase, the rise in VSW due to the arrival of the shock wave was 694 km/s and that of PSW was 11 nPa.
In the main phase (70–850 min), between 70 and 100 min, the MCEF moved suddenly westwards, showing a variation of 2.29 mV/m, while the IMF Bz fluctuated from south to north by 27 nT. The Sym-H index showed a southern polarity, and the AE index decreased by 700 nT with a lag of around 20 min. Between 100 and 150 min, the MCEF shifts east again, reaching its maximum value of 1.80 mV/m, a variation of 2.75 mV/m. The corresponding IMF Bz change is 31 nT. The AE index rises to a peak of 2730 nT, some 500 min behind the peak date of MCEF. The Sym-H index reaches its minimum value of −132 nT at 850 min. VSW and PSW reached their respective maxima in the main phase, 760 km/s for speed and 24 nPa for pressure. After 150 min, the MCEF decreases overall until the end of the main phase.
MCEF decreasing continues into the recovery phase. From 1140 min, the MCEF of the disturbed period merges with that of the very quiet period. A significant MCEF peak of 0.71 mV/m is observed from 5340 min when the IMF Bz bifurcates south of 9 nT. This MCEF peak is followed by a relapse in the Sym-H index of −68 nT/5634 min and an increase in the overall AE index of 1250 nT/5625 min. After 5340 min, the MCEF decreases again and approaches that of the very quiet day.
3.6. MCEF Variability During the Magnetic Storm of 2 October 2013
At the start of the storm on 2 October at 01:54 UT, the MCEF was almost zero. After the shock, at 01:54 UT, it shifted eastwards by 1.15 mV/m after 40 min, while the IMF Bz varied from north to south by 16 nT. The AE index, after peaking at 670 nT at 260 min before the onset of the storm, reaches its maximum of 2090 nT at around 70 min, while the Sym-H index peaks after 40 min with a variation of 35 nT. The maxima for VSW and PSW during the initial phase are 581 km/s and 14 nPa, respectively.
In the main phase (100–285 min), the MCEF moves further east, reaching a maximum of 2.45 mV/m at 200 min, while the IMF Bz moves south by 29 nT. PSW and VSW reach their respective maxima of 41 nPa and 650 km/s. A little later, at 240 min, the global AE index peaks again at 1940 nT, and the Sym-H index reaches its minimum (−90 nT) at 285 min. After 200 min, the MCEF decreases during the rest of the main phase, reaching a minimum (−1 mV/m) at 420 min in the recovery phase, when the IMF Bz has moved north by 15.4 nT. Similarly, the AE index decreases, reaching 80 nT a little later at 620 min.
After 440 min, the MCEF moved east by 0.74 mV/m to 1040 min, a change of 1.74 mV/m. Meanwhile, the IMF Bz moved south, changing by 24 nT. The AE index rises to 1260 nT at 1130 min, and the Sym-H index shows a southerly polarity (−56 nT) at 1060 min. This behaviour of the Sym-H index, followed by the increase in the AE index during the recovery phase, confirms the presence of a magnetic substorm. After 1040 min, MCEF values decrease and approach those of the very calm reference period from 1560 min.
3.7. MCEF Variability During the Magnetic Storm of 27 February 2014
At the start of the storm on 27 February at 16:50 UT, the MCEF was oriented east by 0.35 mV/m. After the CME shock, the MCEF oscillated very rapidly, reaching 0.91 mV/m after 100 min. The IMF Bz fluctuated from south to north, then from north to south by 16 nT. The AE index peaked at 1100 nT, and the Sym-H index fell by 26 nT at almost the same time. VSW reached 473 km/s, and PSW reached 17 nPa in the initial phase. After 100 min, the MCEF increases further and reaches its maximum (1.2 mV/m) in the main phase.
During the main phase, the MCEF decreases and reaches a minimum (−0.32 mV/m) at 855 min into the recovery phase. The IMF Bz shifts north by 8.2 nT at the same time, and the AE index decreases to 50 nT.
MCEF peaks are observed in the recovery phase at 874 (0.60 mV/m), 1411 (0.45 mV/m), 2486 (0.32 mV/m), and 3195 min (0.34 mV/m). They are associated with a southward displacement of IMF Bz of 8.6, 6.5, 4, and 5 nT, respectively. The Sym-H index showed a southward polarity (−68, −43, −52, and −31 nT, respectively) moments after the MCEF peaks were observed. The AE index also showed peaks (750, 370, 450, and 590 nT, respectively) at almost the same time. After 883 min, the MCEF gradually decreased and then equalled that of the very quiet reference period.
3.8. MCEF Variability During the Magnetic Storm of 12 September 2014
A first CME shook the magnetosphere on 11 September at 23:44 UT, some 969 min before the start of the storm. The blue vertical line in Figure 8 indicates the time of impact of this CME. Between −969 and −720 min, the MCEF shows no values. After −720 min, the MCEF of the disturbed period approaches that of the very calm period, until the start of the storm on 12 September at 16:16 UT. At the start of the storm, the MCEF, which had been pointing east at 0.12 mV/m, shifted west at 0.95 mV/m after around 25 min. The IMF Bz moved north by 13 nT. The AE index rises to 910 nT after 50 min, after peaking at 600 nT at −150 min. The Sym-H index rose to 23 nT. The MCEF suddenly shifted eastwards by 1.06 mV/m before moving westwards again, reaching −2.14 mV/m at 170 min. The IMF Bz also oscillated from north to south by 22 nT and then from south to north by 40 nT. The AE index decreased as the MCEF decayed, reaching 160 nT at 210 min.
The Sym-H index peaked at 29 nT at around 250 min. Between 170 and 330 min (the end of the initial phase), the MCEF increased progressively, peaking at 1.51 mV/m at 390 min into the main phase. The IMF Bz moved progressively southwards by 17.3 nT during this time. The AE index increases and reaches its maximum peak of 1180 nT at 383 min. In the initial phase, VSW peaks at 665 km/s and PSW at 25 nPa. After 390 min, the MCEF decreases and turns west by 2 mV/m at the end of the main phase, while the IMF Bz turns north by 24.4 nT. The Sym-H index reaches its minimum value (−97 nT), and the AE index reaches a minimum value in the recovery phase.
In the recovery phase, the MCEF decreases progressively, reaching the values of a reference calm day from 1570 min. No magnetic substorms were observed during the recovery phase of the 12 September 2014 magnetic storm.
3.9. Cross-Correlation Analysis
From the analysis of Figure 9, it can be seen that during the complete evolution of the storm of 24 April 2012, the MCEF delayed by 40 is correlated with the AE index at a correlation coefficient of 0.77. The MCEF delayed by 260 min is anticorrelated with the Sym-H index with an anticorrelation coefficient of −0.63. The MCEF is strongly anticorrelated with the IMF Bz, with an anticorrelation coefficient of −0.98. The time lags between the MCEF and the AE and Sym-H indices observed over the entire course of the storm indicate that any disturbance in the MCEF is preceded by a disturbance in the global auroral activity and the activity associated with the ring current. Analysis of the linear regression shows that any variation in global auroral activity of 1 nT induces a variation in the MCEF of 0.000675 mV/m, 40 min later. Each decrease in the Sym-H index of 1 nT induces an increase in the MCEF of 0.00552 mV/m, 260 min later, and vice versa. Every increase in MCEF of 0.0536 mV/m is associated with a decrease in IMF Bz of 1 nT and vice versa.
The cross-correlation analysis applied to all the storms analyzed gave the results shown in Table 2. This table shows the correlations between the MCEF and the parameters (Bz, Sym-H, and AE) for each storm. The time lag, expressed in minutes, and the correlation coefficient (R) are shown.
| Storm date | MCEF vs. AE | MCEF vs. Sym-H | MCEF vs. Bz | |||
|---|---|---|---|---|---|---|
| Lag | R | Lag | R | Lag | R | |
| 15-03-2012 | 20 | 0.41 | 280 | −0.26 | 0 | −0.98 |
| 24-04-2012 | 40 | 0.77 | 260 | −0.63 | 0 | −0.98 |
| 15-07-2012 | 9 | 0.81 | 62 | −0.87 | 0 | −0.99 |
| 1-10-2012 | 79 | 0.70 | −550 | 0.65 | 0 | −0.99 |
| 17-03-2013 | 13 | 0.72 | −726 | 0.67 | 0 | −0.99 |
| 2-10-2013 | 15 | 0.55 | −742 | 0.54 | 0 | −0.97 |
| 27-02-2014 | 19 | 0.68 | 234 | −0.50 | 0 | −0.99 |
| 12-09-2014 | −893 | −0.63 | −49 | 0.62 | 0 | −0.99 |
From the analysis of Table 2, it can be seen that during the complete evolution of all the storms studied, with the exception of the storm of 12 September 2014, the delayed MCEF correlates well with the global AE index. The time lags range from 9 to 79 min, and the correlation coefficients vary between 0.41 and 0.81. The positive correlations indicate a direct relationship between fluctuations in the MCEF and those in the AE index, suggesting that variations in the MCEF are strongly related to disturbances in the global electrojet.
The correlations between the MCEF and the Sym-H index are negative for the storms of 15-03-2012, 24-04-2012, 15-07-2012, and 27-02-2014, while they are positive for the storms of 1-10-2012, 17-03-2013, 02-10-2013, and 12-09-2014. The time lags are positive for the first storms and negative for the second. This shows that variations in the MCEF precede those in the Sym-H index during the storms of 15-03-2012, 24-04-2012, 15-07-2012, and 27-02-2014, whereas they follow those in the Sym-H index during the storms of 1-10-2012, 17-03-2013, 02-10-2013, and 12-09-2014.
A remarkably constant and very strong correlation (R ≈ −1) is present in all storms between the MCEF and the IMF Bz. No time lag (lag = 0) is observed. This indicates an immediate relationship between the MCEF and the IMF Bz. The storm of 12-09-2014 shows a very large time lag (−893 min) and a negative correlation between the MCEF and the AE index (R = −0.63). These time lag and correlation values differ markedly from the other data. This could indicate an atypical event during the storm or an error due to the quality of the measurements. Similarly, the highly variable time lags (in sign) between storms and the fluctuations in the sign of the correlations for the Sym-H index could suggest very different storm behaviour due to differences in the triggering mechanisms.
Linear regression analysis between MCEF and AE index, applied to all storms, reveals that for each 1 nT change in AE, MCEF varies from 0.000297 mV/m 20 min later in the storm of 15-03-2012, from 0.000914 mV/m 9 min later in the storm of 15-07-2012, from 0.000775 mV/m 79 min later in the storm of 1-10-2012, 0.000695 mV/m 13 min later in the storm of 17-03-2013, 0.000501 mV/m 15 min later in the storm of 2-10-2013, 0.000697 mV/m 19 min later in the storm of 27-02-2014, and 0.000978 mV/m 893 min later in the storm of 12-09-2014.
Analysis of the linear regression between MCEF and Bz shows that a variation of 1 nT in Bz is associated with an inverse variation in MCEF, with specific coefficients depending on the storm: a decrease of 0.0825 mV/m for the storm of 15-03-2012, 0.0536 mV/m and 0.0697 mV/m for that of 15-07-2012, 0.0464 mV/m for that of 1-10-2012, 0.0718 mV/m for that of 17-03-2013, 0.0664 mV/m for that of 2-10-2013, 0.0555 mV/m for that of 27-02-2014, and 0.0811 mV/m for that of 12-09-2014.
Analysis of the linear regression between the MCEF and the Sym-H index applied to all the storms, reveals that each decrease (or increase) of 1 nT in the ring current index is associated with specific variations in the MCEF. Thus, a decrease (or increase) of 1 nT leads to an increase (or decrease) of 0.00320 mV/m 280 min later during the storm of 15-03-2012, an increase (or decrease) of 0.00985 mV/m 62 min later during the storm of 15-07-2012, a decrease (or increase) of 0.00431 mV/m 550 min earlier during the storm of 1-10-2012, a decrease (or increase) of 0.00756 mV/m 726 min earlier during the storm of 17 March 2013, a decrease (or increase) of 0.00501 mV/m 742 min earlier in the storm of 2-10-2013, an increase (or decrease) of 0.00388 mV/m 234 min later in the storm of 27-02-2014, and a decrease (or increase) of 0.00204 mV/m 49 min earlier in the storm of 12-09-2014.
3.10. Dependence Between the First Changes in MCEF, the Maximum VSW in the Initial Phase, and the Mean Transit Speed of the CME
Table 3 summarizes the first turns of the MCEF in the initial phase just after the shock, the maximum values of the VSW in the initial phase, and the average transit speeds of CMEs in interplanetary space (VICME). The direction (east or west) of the MCEF is indicated. This is essential for understanding the effects of the MCEF on the magnetosphere.
| Storm date | VICME (km/s) | V SW (km/s) | MCEF (mV/m) |
|---|---|---|---|
| 15-03-2012 | 960 | 735 | 1.29 (west) |
| 24-04-2012 | 520 | 401 | 0.78 (east) |
| 15-07-2012 | 850 | 695 | 1.04 (east) |
| 01-10-2012 | 590 | 403 | 0.82 (east) |
| 17-03-2013 | 890 | 694 | 1.28 (east) |
| 02-10-2013 | 800 | 581 | 1.15 (east) |
| 27-02-2014 | 651 | 473 | 0.91 (east) |
| 12-09-2014 | 920 | 665 | 0.95 (west) |
The table shows that the speed of CMEs varies from 520 (24-04-2012) to 960 km/s (15-03-2012) and that of the SW fluctuates between 401 (24-04-2012) and 735 km/s (15-03-2012). MCEF values oscillate between 0.78 (24-04-2012) and 1.29 mV/m (15-03-2012). The majority (6/8 = 75%) of storms show an eastward MCEF in the initial phase. This could indicate a trend in MCEF configurations during storms.
The storms of 15-03-2012, 15-07-2012, 17-03-2013, 02-10-2013, and 12-09-2014 are associated with fast CMEs (VICME ≥ 800 km/s) and intense electric fields (MCEF ≥ 0.95 mV/m). We could then conclude that these storms are potentially more disruptive to the MCEF. Similarly, the storms of 24-04-2012, 1-10-2013, and 27-02-2014, which are associated with slow CMEs (VICME ≤ 651 km/s) and weak electric fields (MCEF ≤ 0.91 mV/m), are less disruptive of the MCEF.
Finally, the storm of 15-03-2012 (Dst = −88 nT and Kp = 6 nT) is associated with the highest VICME (960 km/s) and the most intense MCEF (1.29 mV/m), making it potentially the most disruptive MCEF in the table. In contrast, the storm of 24-04-2012 (Dst = −120 nT and Kp = 7 nT) is associated with the lowest VICME (520 km/s) and the least intense MCEF (0.78 mV/m), indicating a less violent storm on the MCEF. These observations indicate that the response of the MCEF does not depend on the level of magnetic disturbance.
The MCEF, VSW, and VICME data in Table 3 were used to plot the graphs in Figure 10. Analysis of the graph in Figure 10(a) shows a strong linear correlation between the transit speed of the CME and the maximum VSW observed in the initial phase (correlation coefficient R = 0.98). Similarly, the plot in Figure 10(b) also shows a strong correlation between the mean transit speed of the CME and the first turn of the MCEF after the start of the storm (correlation coefficient R = 0.82).
4. Discussions
It has been shown that the arrival of a geoeffective CME on the magnetosphere creates a shockwave that causes an increase in VSW and PSW in the initial phase of the storm it generates [37, 38]. The very strong correlation between the average transit speed of the CME responsible for the storm and the VSW in the initial phase could reflect a dependence of the CME velocity on the rise in VSW in the initial phase of storms. The higher the transit speed of a geoeffective CME, the greater the VSW observed in the initial phase, and vice versa. The strong correlation between the first MCEF changes in the initial phase and the mean transit speed of the CME shows that the impact of geoeffective CMEs on the magnetosphere has an effect on MCEF fluctuations. CMEs arriving at transit speeds between 800 and 960 km/s induced a change in MCEF between 0.95 mV/m and 1.29 mV/m in the initial phase after a duration ranging from 30 to 140 min. Those transiting at speeds between 520 and 651 km/s induced MCEF shifts between 0.78 mV/m and 0.91 mV/m after 15–100 min.
Nishimura et al. [39] and de Siqueira et al. [40] have shown that the IMF Bz responds to changes in MCEF orientation. Similar observations have been reported by Salfo and Frédéric [35], Salfo et al. [41], and Stéphane et al. [42] analyzing the action of geoeffective CMEs on the MCEF and that of fast SWs. We make the same observations in this article. However, we have gone a step further by quantitatively analyzing this dependence between the MCEF and the IMF Bz during the entire evolution of the storms studied. Thus, for storms generated by CMEs transiting between 520 and 651 km/s, a change in IMF Bz of 1 nT is associated with a variation in MCEF of around 0.05 mV/m. During the complete evolution of storms linked to CMEs with velocities between 800 and 960 km/s, for each 1 nT change in IMF Bz, a variation in MCEF of around 0.07 mV/m is observed.
Fluctuations in the MCEF are synchronous with those of the AE and Sym-H indices during the entire evolution of the storms studied. However, they occur with a certain time lag. With the exception of the 12 September 2012 storm, variations in the AE index precede those of the MCEF with a time lag ranging from 9 to 79 min. These observations confirm the results of Meloni, Wolfe, and Lanzerotti [43], who reported that the AE index with a 1 h time lag correlates with the Ey electric field and, in turn, with the MCEF. However, we analyzed the time lag in terms of minutes, and the linear correlation coefficients ranging from 0.41 to 0.81 are significantly higher than those they reported. For every 1 nT variation in the global AE index, there is a variation in MCEF ranging from 0.0003 to 0.001 mV/m.
The time lag between variations in the ring current index (Sym-H) and MCEF varies from 49 to 742 min. Correlation coefficients range from −0.87 to 0.67. With the exception of the storm of 15 March 2012, correlations between MCEF and Sym-H are good. However, unlike the AE index, where in 7/8 (88%) of storms, MCEF variations follow those of global auroral activity, and in 50% of storms, MCEF variations precede those of the Sym-H index.
The intensification of the MCEF observed during the initial and main phases of storms can be observed with an east- or west-facing MCEF. An east-facing MCEF corresponds to a south-facing IMF Bz, which is favorable to magnetic reconnection [28]. Salfo and Frédéric [35] and Stéphane et al. [42], in a statistical study of MCEF variability, reported that MCEF decay phases correspond to a northward orientation of IMF Bz and consequently to an absence of magnetic reconnection. However, for Marchaudon [32], magnetic reconnection can occur with a northward-facing IMF Bz. Our results support the idea of a magnetic reconnection with a north-facing IMF Bz by ricocheting a west-facing MCEF.
Of the storms analyzed, 7/8 (88%) exhibited substorms during their recovery phases. MCEF peaks preceding magnetic substorms confirm the observations of Singh et al. [44], for whom the magnetic substorms observed during the recovery phase are due to prompt electric field penetration. The rise in AE during substorms confirms the observations of Rostoker [13] and Shadrina [45], for whom the significant peaks in AE observed during the recovery phase are a primary indicator of magnetic substorm activity.
5. Conclusion
The study of the variability of the MCEF during Solar Cycle 24 storms revealed (1) a dependence of the mean transit speed of CMEs on the variation of the MCEF in the initial phase and hence the effect of CMEs on the MCEF and (2) a dependence of the transit speed of the CME and the maximum speed of the SW in the initial phase. (3) CMEs arriving at high speeds induce significant changes in MCEF during the initial phase. (4) During storms generated by CMEs arriving at speeds between 520 and 651 km/s, an IMF Bz change of 1 nT is associated with an MCEF variation of around 0.05 mV/m. During those linked to CMEs with speeds between 800 and 960 km/s, each 1 nT change in IMF Bz corresponds to a change in MCEF of around 0.07 mV/m. (5) In 88% of the storms studied, changes in AE index precede those in MCEF with a time lag ranging from 9 to 79 min. Linear correlation coefficients between MCEF and lagged AE ranged from 0.41 to 0.81. (6) In 50% of the storms analyzed, MCEF variations preceded those of the Sym-H index with a lag ranging from 49 to 742. Correlation coefficients ranged from 0.54 to 0.67. Anticorrelation coefficients ranged from −0.87 to −0.26. (7) Of the storms analyzed, 7/8 (88%) exhibited substorms during their recovery phases. Finally, the study deals with the dynamics of the earth’s magnetosphere. It provides information on fluctuations in the magnetospheric electric convection field, with a view to predicting magnetic storms and their geoeffectivities.
Conflicts of Interest
The authors declare no conflicts of interest.
Funding
This work was not funded.
Acknowledgments
The authors thank NASA’s Goddard Space Flight Center (GSFC) for data on solar wind parameters and geomagnetic indices. The authors also thank the World Data Center for Geomagnetism (WDCG) for the availability of data on the quietest days of the month. Finally, the authors would like to thank the anonymous reviewers whose detailed comments, constructive remarks, and pertinent suggestions helped to improve the article.
Open Research
Data Availability Statement
The sources of the data used are available on the websites whose references are https://omniweb.gsfc.nasa.gov/form/dx1.html and https://wdc.kugi.kyoto-u.ac.jp/qddays. The data used in this research is available on request from the corresponding author.


