Three-Dimensional Crustal Shear Wave Velocity Structure and Azimuthal Anisotropy Across Northern and Central Thailand From Direct Joint Inversion of Rayleigh Wave Phase Velocities
Abstract
This study presents a three-dimensional shear wave velocity (Vs) model and azimuthal anisotropy of the crust beneath northern and central Thailand derived from ambient noise tomography. Continuous seismic data from 99 broadband stations across Southeast Asia were processed to extract Rayleigh wave phase velocity dispersion curves. These curves were then used in a direct joint inversion for both isotropic Vs perturbations and azimuthal anisotropy at depths of 15–35 km. The inversion was initialized with a local 1D velocity model specifically derived for northern Thailand. Results reveal significant lateral heterogeneities in crustal structure, with Vs ranging from 3.615 to 3.675 km/s at 15–20 km depth to 3.650 to 3.720 km/s at 30–35 km depth across the study area. A prominent high-velocity anomaly (Vs > 3.675 km/s at 15–20 km depth, Vs > 3.745 km/s at 20–30 km depth, and Vs > 3.720 km/s at 30–35 km depth) is observed in the northwestern sector (18.5°–19.5° N, 98°–101° E), corresponding to the Shan-Thai terrane. The velocity contrast between the Shan-Thai and Indo-China terranes is delineated by a lateral velocity gradient, with the Shan-Thai Terrane consistently exhibiting higher velocities throughout the investigated depth range. Azimuthal anisotropy patterns show complex variations, with a prominent NW-SE trend in fast polarization directions in northern Thailand, consistent across all depth ranges. The strongest anisotropy is observed in the northern Thailand, coinciding with high-velocity zones. The spatial correspondence between present-day surface kinematics, as recorded by GPS measurements, and crustal anisotropic fabric suggests a coherent deformation pattern that extends through multiple crustal levels, with pronounced expressions along terrane boundaries.
1. Introduction
Northern and central Thailand are situated in a tectonically complex region characterized by the interaction of several microplates and terranes. The crustal structure and seismicity of this area have been the focus of numerous geophysical studies aimed at understanding the regional tectonic framework and associated seismic hazards. The tectonic setting and seismic network distribution across this region provide significant insights into its geodynamics.
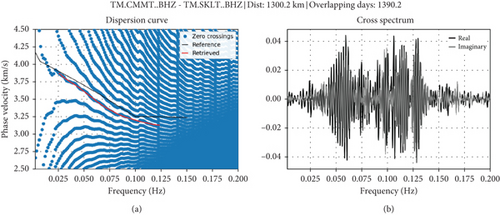
As illustrated in Figure 1, the area encompasses several distinct terranes, delineated by blue lines, and fault systems, delineated by red lines. These include the West-Burma terrane (WBT), Shan-Thai terrane (STT), and Indo-China terrane (ICT), as well as Peninsular Thailand and Malaysia. The comprehensive seismic network, represented by red triangles in Figure 1, enhances the resolution of seismic imaging and facilitates a more detailed understanding of subsurface structures across the area. Stations CMMT and SKLT, highlighted in yellow, are key sites for detailed cross-correlation analysis (Figure 2). This complex tectonic configuration results from the long-term convergence between the Indian, Eurasian, and Australian plates, creating a region of ongoing crustal deformation and seismic activity [6].
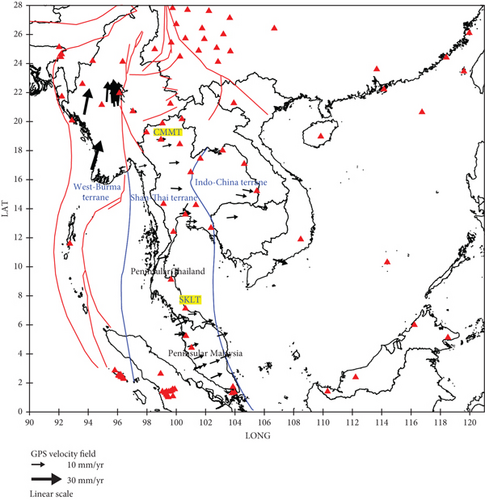
The granitoid belts in Thailand, comprising the eastern, central, and western belts, provide further evidence of the region’s intricate geotectonic history. These belts, formed in different geological environments, exhibit marked contrasts in geochronological evolution, with ages ranging from the Early Triassic to the Middle Tertiary [5]. The blue lines in Figure 1 delineate the major terrane boundaries, as modified by Charusiri et al. [5]. These boundaries demarcate regions of differing geological histories and tectonic behaviors, contributing to the overall complexity of the area’s geodynamics.
The GPS velocity field, derived from EarthScope Consortium [1]; Kreemer, Blewitt, and Klein [2]; Maurin et al. [3]; and Simons et al. [4], provides critical data on the relative movements of these terranes. The vectors, scaled at 10 and 30 mm/year in Figure 1, reveal diverse motion patterns across the region. The West-Burma terrane exhibits northward movement, which has significant implications for seismic hazard assessment and crustal deformation studies. The STT, located in the northern and central parts of Thailand, demonstrates an eastward movement, while the ICT in northeastern Thailand shows a northwest–southeast directional movement. In Peninsular Malaysia, the GPS velocity field indicates a northeast–southwest movement, whereas in Peninsular Thailand, the plate motion is approximately eastward.
A recent study by Saetang [7] employed shear-wave splitting (SWS) measurements to investigate the anisotropy beneath Myanmar and Thailand using a two-layer model. This model revealed that the upper and lower layers, interpreted as lithosphere and asthenosphere, respectively, exhibit different anisotropic patterns. The study identified two groups of fast polarization directions (ϕ), which correlate with the northward movement of the WBT and the southeastward movement of the STT and ICT. This anisotropic behavior aligns with the GPS velocity field observations, underscoring the complex tectonic interactions in the region.
Recent seismological studies have provided new insights into the crustal velocity structure and seismogenic zones of the region. For instance, the crustal thickness across Thailand varies significantly depending on the region. In Thailand, the crustal thickness ranges from 30.8 km in the STT to 38.2 km in the Khorat Plateau (KP-ICT) of the ICT, based on receiver function analyses [8]. In central Thailand, the Lampang-Chiang Rai Block (LCB) has a crustal thickness of approximately 33.1 km, while the Nakorn-Thai Block (NTB) has a thickness of around 36.2 km. These variations reflect the complex tectonic history and geological composition of the different terranes within Thailand. Saetang, Srisawat, and Duerrast [9] used local earthquake tomography to image low-velocity anomalies associated with geothermal systems and delineate the Moho at approximately 35 km depth in northern Thailand. Saetang and Duerrast [10] derived a minimum 1D velocity model for northern Thailand using local earthquake data, finding slightly lower crustal velocities compared to global models and a Vp/Vs ratio of 1.70 ± 0.07.
Previous ambient noise tomography studies have provided important insights into the lithospheric structure beneath Indo-China. Yang et al. [11] conducted Rayleigh wave phase velocity tomography using data from 28 broadband stations across Southeast Asia. Their analysis revealed a pronounced low-velocity anomaly along the Ailao Shan-Red River (ASRR) shear zone. Their results demonstrated that the anomalously thin lithosphere between the Khorat Plateau and the ASRR, in conjunction with other geological observations, is generally consistent with the extrusion model for Indo-China, which requires localization of lithospheric deformation around tectonic blocks. Subsequently, Wu et al. [12] employed ambient noise tomography, identifying a distinct low-velocity anomaly in the mid-lower crust of the Shan-Thai Block and characterizing the Khorat Plateau as a rigid block.
The Mw 6.3 earthquake on May 5, 2014, in Chiang Rai Province, northern Thailand, provides a notable example of the region’s seismotectonic activity. This earthquake exhibited a complex rupture pattern with significant aftershock activity on multiple fault planes [13]. Detailed field reconnaissance and the deployment of a dense temporary network of broadband seismometers facilitated a comprehensive analysis of the earthquake sequence. The analysis revealed right-lateral strike-slip motion on an NNW-SSE trending fault and significant aftershock activity on a conjugate WSW-ENE trending feature. The damage area was extensive, with liquefaction and other ground failures spatially associated with the rupture area and along regional rivers. Focal mechanism analysis of three aftershocks with magnitudes greater than Mw 4.0 by Saetang [14] further revealed predominantly strike-slip faulting with a reverse component on southwest-striking fault planes at depths of 3.5, 6.5, and 9.0 km.
The crustal structure in Myanmar provides valuable information for understanding the eastern margin of the ongoing Indo-Eurasian collision system. Crustal thickness (H) in Myanmar varies from 26 km in the south and east to 51 km in the north and west. The Vp/Vs ratio is complex and high across different tectonic areas. In the Indo-Burma Range, the thick crust (H ~ 51 km) and lower velocities may be related to the accretionary wedge from the Indian Plate. In the Central Myanmar Basin, the thin crust (H = 26.9–35.5 km) and complex Vp/Vs ratio and Vs suggest extensional tectonics. In the Eastern Shan Plateau, the relatively thick crust and normal Vp/Vs ratio are consistent with its location along the western edge of the rigid Sunda Block [15].
While these studies have advanced the understanding of crustal structure and seismicity in Southeast Asia, questions remain regarding the detailed three-dimensional velocity structure, anisotropy, and relationship to surface tectonics across northern and central Thailand. This study is aimed at addressing these knowledge gaps by applying direct inversion of ambient noise tomography to image shear wave velocities and azimuthal anisotropy throughout the crust of northern and central Thailand. The specific objectives of this research are to develop a three-dimensional shear wave velocity model of the crust using ambient noise tomography, investigate the spatial variations of crustal anisotropy and their correlations with known geological structures and tectonic features, integrate these new velocity and anisotropy models with existing geological and geophysical datasets to refine our understanding of the region’s crustal structure and tectonic evolution, and evaluate the broader implications of this enhanced crustal model.
2. Data and Methods
2.1. Data Acquisition and Ambient Noise Analysis
The dataset comprises continuous seismic recordings obtained from networks of 99 broadband seismometers deployed across Thailand, Myanmar, and Malaysia (Figure 1). The temporal range of the data extends from the initial deployment of each station to October 31, 2022. All data were acquired from the Incorporated Research Institutions for Seismology (IRIS) database. Data processing and ambient noise analysis were performed using SeisLib (https://seislib.readthedocs.io/en/latest/index.html), an open-source Python package developed for multiscale seismic imaging [16].
SeisLib offers a comprehensive suite of tools for seismological analysis, including automated download of continuous seismograms, fast cross-correlation in the frequency domain, extraction of frequency-dependent phase velocities for both Rayleigh and Love waves, and retrieval of frequency-dependent Rayleigh-wave attenuation coefficients. For this study, we primarily utilized its seismic ambient noise interferometry capabilities.
Following the protocol established by Magrini et al. [16], the continuous seismic recordings were processed to extract Rayleigh wave phase velocity dispersion curves. The analysis focused on the vertical component of the seismic recordings. Prior to processing, the data were resampled to a uniform rate of 1 Hz to ensure consistency in the cross-correlation procedure. A bandpass filter with corner frequencies of 0.01 and 0.5 Hz was applied to isolate the frequency band of interest.
The processing workflow consisted of the cross-correlation of continuous seismograms in the frequency domain, followed by the extraction of frequency-dependent phase velocities for each station pair. The ANDownloader module of SeisLib was utilized to retrieve data from multiple seismic networks within the spatial domain defined by latitudes 1°–28° and longitudes 92°–120°.
Preprocessing of the continuous seismic data involved the removal of the mean and trend, as well as the deconvolution of the instrumental response. To mitigate the effects of large earthquakes and nonstationary noise sources, a running-absolute-mean normalization was applied in the time domain. Subsequently, spectral whitening was performed in the frequency domain to enhance the broadband ambient noise signal and suppress monochromatic noise sources.
The Rayleigh wave dispersion curves were extracted using the extract_dispcurves function from SeisLib, with parameters optimized for the specific characteristics of the area and dataset. This procedure yielded 549 interstation dispersion curves, which form the foundation for the subsequent tomographic analysis. These dispersion curves provide constraints on the velocity structure of the crust and uppermost mantle.
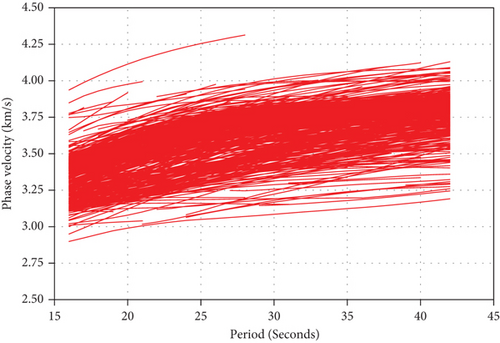
The obtained dispersion curves (Figure 3) show coherent patterns across all station pairs, with phase velocities systematically varying over the period range of 16–42 s (Table 1). This systematic variation in phase velocity with period reflects the velocity structure of continental crust, where longer periods sample deeper layers. The smooth progression and consistent distribution of the curves indicate robust measurements for the analysis.
| Period (s) | Count |
|---|---|
| 16 | 402 |
| 17 | 413 |
| 18 | 420 |
| 19 | 424 |
| 20 | 426 |
| 21 | 431 |
| 22 | 440 |
| 23 | 449 |
| 24 | 448 |
| 25 | 450 |
| 26 | 450 |
| 27 | 455 |
| 28 | 453 |
| 29 | 444 |
| 30 | 444 |
| 31 | 445 |
| 32 | 437 |
| 33 | 437 |
| 34 | 439 |
| 35 | 439 |
| 36 | 434 |
| 37 | 425 |
| 38 | 425 |
| 39 | 415 |
| 40 | 415 |
| 41 | 400 |
| 42 | 400 |
2.2. Surface Wave Tomography
The obtained dispersion curves were subsequently inverted to construct a three-dimensional crustal shear wave velocity model and azimuthal anisotropy structure using the DAzimSurfTomo algorithm [17]. DAzimSurfTomo is an open-source package for direct inversion of surface wave data for 3D isotropic Vsv and azimuthal anisotropy without conventional tomography. We used Version 2.0 of the package, which is available on GitHub (https://github.com/Chuanming-Liu/DAzimSurfTomo).
DAzimSurfTomo employs a direct inversion approach, bypassing the conventional intermediate step of tomography. The package utilizes a fast marching method [18] to compute period-dependent surface wave travel times and ray paths. The forward computation of surface waves is based on the Thomson–Haskell method, using the code of Herrmann [19]. Both isotropic Vsv perturbation and azimuthal anisotropy are jointly inverted in this version.
The inversion was performed for the crustal depth range of 15–35 km across the area bounded by 88°–120° E longitude and 0°–30° N latitude. The depth range of 15–35 km was chosen based on the period range of 16.0–42.0 s used in our analysis, which provides good sensitivity to these crustal depths. Each period in this range had more than 400 measurements (Table 1), ensuring robust coverage for the inversion.
For the initial 1D shear wave velocity model, we used values based on a minimum 1D velocity model of northern Thailand [10], as shown in Table 2. We chose this initial model because it is a local velocity model specifically derived for northern Thailand, which is located within our area in northern and central Thailand and thus provides a more accurate starting point for our inversion compared to global models.
| Depth (km) | Vs (km/s) |
|---|---|
| 0 | 3.35 |
| 5 | 3.35 |
| 10 | 3.53 |
| 15 | 3.59 |
| 20 | 3.67 |
| 25 | 3.67 |
| 30 | 3.67 |
| 35 | 3.67 |
| 40 | 3.67 |
The study region was parameterized using a grid of 150 × 140 × 6 nodes with a horizontal spacing of 0.25° × 0.25° to provide detailed regional resolution, a vertical spacing of 5 km based on the optimal resolution for the TM network configuration [9]. The number of sublayers was set to five to allow smooth velocity interpolation between grid points. Based on the range of velocities observed in the 549 interstation dispersion curves obtained from the ambient noise analysis, the Vsv range for the inversion was constrained between 2.5 and 4.5 km/s. Based on the test4_Yunnan example provided with DAzimSurfTomo, the maximum number of sources or receivers was set to 200 in the parameter file. This value serves as an upper bound for the software’s internal calculations rather than representing the actual 99 seismometers in our network. The sparsity fraction was configured at 0.2. We performed five iterations for the joint inversion. The smoothing parameters were set to 20 for δVsv and 30 for Gc and Gs. No damping was applied in the LSQR algorithm. Complete parameter settings are provided in the Supporting Information (available here).
The inversion was performed for 27 periods ranging from 16.0 to 42.0 s, with 1-s intervals. This approach allows for the mitigation of trade-offs between strong heterogeneity and anisotropy in the resultant model.
The inversion process was performed iteratively, updating ray paths and sensitivity kernels with each iteration based on the newly obtained wave speed model. All computations were executed using GNU Fortran (gfortran) Version 9.4.0, running on Ubuntu 20.04.3 LTS (Focal Fossa). The hardware utilized was a personal laptop equipped with an Intel Core i5-1035G1 CPU (1.00 GHz base frequency, up to 3.60 GHz with Turbo Boost) and 64 GB DDR4 RAM (3200 MT/s). Of the total 64 GB RAM, the computation utilized approximately 30 GB. The entire inversion process was completed in 1 h and 38 min. The inversion process achieved convergence through five successive iterations, as evidenced by the systematic decrease in root mean square (RMS) travel time residuals (Table 3). The progressive reduction in residual values demonstrates the robustness of the solution, with model stability maintained through optimal implementation of smoothing parameters and regularization constraints. The resulting final model provides insights into both the 3D isotropic Vsv structure and the azimuthal anisotropy of the crust in the designed area. Detailed output logs are available in the Supporting Information.
| Iteration number | RMS residual (s) |
|---|---|
| Before inversion | 30.32 |
| 1 | 30.25 |
| 2 | 30.21 |
| 3 | 30.16 |
| 4 | 30.12 |
| 5 | 30.07 |
3. Results and Discussion
3.1. Ray Path Coverage and Data Quality
The tomographic inversion of Rayleigh wave dispersion data provides critical insights into the crustal structure beneath northern and central Thailand. Figure 4 illustrates the ray path coverage for Rayleigh waves at a 27-s period across the modelled area (0°–28° N, 92°–120° E). The distribution of 455 interstation paths, represented by blue lines, demonstrates extensive sampling of the crust throughout the region. Notably, the ray path density exhibits significant spatial variations, with particularly high concentrations observed in central and northern Thailand. This comprehensive coverage facilitates high-resolution imaging of crustal structures across the region, enabling robust constraints on lateral variations in shear wave velocities and azimuthal anisotropy within the crust.
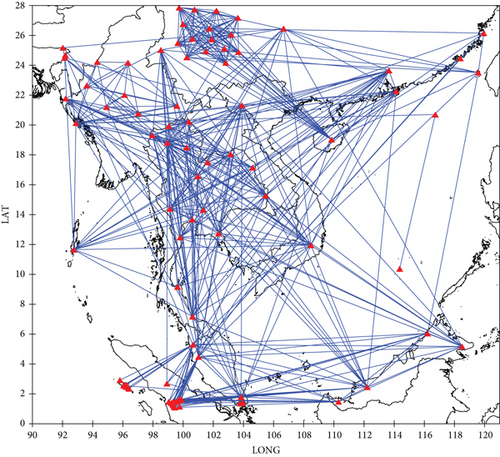
As evidenced in Table 1, the number of dispersion measurements varies with period, ranging from 400 to 455 across the analyzed periods (16–42 s). The 27 s period Rayleigh waves, corresponding to 455 measurements, are primarily sensitive to structures in the middle to lower crust, typically at depths between 15 and 35 km, depending on the local velocity structure. However, a notable limitation in the dataset is the absence of ray paths from the seismic network in China crossing through Thailand to connect with other networks in the modelled area. This gap, potentially caused by disparate recording times and operational periods of the stations, affects the resolution of the tomographic model in certain areas, particularly where interstation paths are missing.
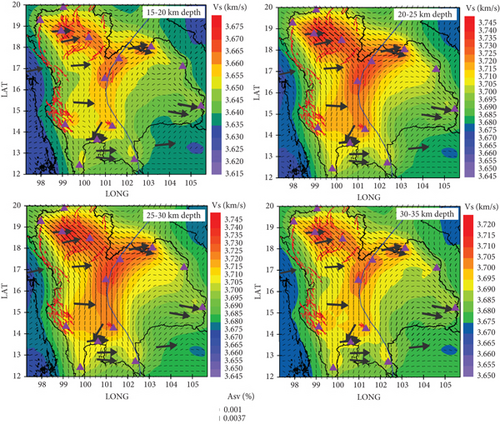
Given these constraints, the subsequent analysis focuses on regions with the highest density of ray paths: central and northern Thailand. This targeted approach ensures that the interpretation of the tomographic model is based on areas with the highest data quality and resolution, enabling accurate and detailed insights into the crustal structure and tectonic processes of these regions. Specifically, the areas interpreted and shown in Figure 5 are limited to the region between longitudes 97.3° E and 105.7° E and latitudes 12° N and 20° N, based on the high-density ray coverage that provides robust constraints on the velocity and anisotropy variations.
3.2. Shear Wave Velocity Structure
The integration of shear wave velocity structure, azimuthal anisotropy patterns, and GPS observations provides a comprehensive view of the crustal architecture and deformation in this tectonically complex region. Figure 5 presents a comprehensive visualization of the crustal structure beneath northern and central Thailand, integrating multiple geophysical parameters. The figure juxtaposes shear wave velocity (Vs) distributions with azimuthal anisotropy patterns, GPS-derived velocity vectors, and major tectonic boundaries at four depth ranges: 15–20, 20–25, 25–30, and 30–35 km. This multifaceted representation effectively synthesizes the key findings of our ambient noise tomography and anisotropy analysis.
Several key observations emerge from the analysis of Figure 5, which presents horizontal cross-sections of shear wave velocity (Vs) and azimuthal anisotropy across four depth ranges: 15–20, 20–25, 25–30, and 30–35 km. The observed lateral variations in Vs show systematic increases with depth: 3.615–3.675 km/s at 15–20 km depth, 3.645–3.745 km/s at 20–30 km depth, and 3.650–3.720 km/s at 30–35 km depth. These velocity contrasts, particularly evident across the STT and ICT boundary, provide insights into the region’s complex crustal architecture. The superimposed azimuthal anisotropy patterns, quantified by the anisotropy amplitude (Asv), reveal spatial variations in crustal fabric and potential zones of localized deformation.
At 15–20 km depth, a prominent high-velocity anomaly (Vs > 3.675 km/s) is evident in the northwestern sector (18.5° N–19.5° N, 98° E–101° E), corresponding to the northern Thailand. This anomaly suggests a rigid, consolidated crustal structure, potentially associated with ancient crystalline basement rocks. A notable velocity contrast is observed across the STT and ICT boundary (delineated by the blue line in Figure 5), with the STT exhibiting generally higher velocities than the ICT to the east. Lower velocities (3.640–3.650 km/s) characterize the eastern and southeastern parts of the model at 15–20 km depth, corresponding to the ICT. Previous Rayleigh wave phase velocity tomography by Yang et al. [11] revealed that the anomalously thin lithosphere between the Khorat Plateau and the ASRR, in conjunction with other geological observations, is generally consistent with the extrusion model for Indo-China, which requires localization of lithospheric deformation around tectonic blocks. While Wu et al. [12] characterized the Khorat Plateau as a rigid block within the ICT, our tomographic imaging reveals systematic velocity variations that persist through multiple crustal levels (15–35 km). This sustained velocity differentiation likely reflects fundamental differences in crustal composition, thickness, or thermal structure between these major tectonic units.
In the 20–30 km depth, the shear wave velocity structure exhibits systematic variations. The high-velocity anomaly in the northern Thailand also becomes more pronounced, with Vs reaching 3.745 km/s throughout this depth range. A well-defined velocity contrast persists across the STT and ICT boundary, with consistent velocity distributions (3.645–3.745 km/s) observed in both the 20–25 and 25–30 km depth intervals. The similarity in shear wave velocity distributions between the 20–25 and 25–30 km depth ranges (3.645–3.745 km/s) suggests a relatively homogeneous lower crustal layer in this region.
At the 30–35 km depth range, the shear wave velocity structure exhibits systematic variations. The overall velocity distribution shows higher values, ranging from 3.650 to 3.720 km/s. The prominent high-velocity anomaly, initially identified in the northern Thailand at 15–20 km depth and further developed through the 20–30 km depth range, remains a persistent feature at 30–35 km depth, with Vs reaching 3.720 km/s. This vertical continuity of the high-velocity structure through these successive depth ranges provides strong evidence for a consolidated rigid structure within the STT.
The ICT, located at the eastern part of the study area, consistently exhibits lower velocities relative to the STT throughout the investigated depth range. This sustained velocity differential suggests fundamental differences in crustal properties between the two terranes that persist across all depths. The preservation of velocity patterns with depth indicates that the observed crustal heterogeneities represent deep-seated structural and compositional variations characterizing the entire analyzed crustal section.
3.3. Azimuthal Anisotropy Patterns
The azimuthal anisotropy patterns, represented by black bars in Figure 5, provide insights into crustal deformation and stress fields. The length of each bar is proportional to the anisotropy amplitude (Asv [percent]), calculated using Equation (5) in the Data and Methods section. Asv quantifies the degree of azimuthal anisotropy in the vertically polarized S-wave velocity structure, with values ranging from 0.001% to 0.0037% as shown in the scale at the bottom of Figure 5.
Analysis of crustal anisotropy patterns (15–35 km) and GPS velocity fields reveals systematic spatial correlation. Saetang [7] demonstrated that surface GPS velocity fields can be effectively used to interpret upper mantle anisotropy patterns in Southeast Asia. Since our crustal anisotropy measurements (15–35 km) sample much shallower depths than the upper mantle, the correlation with surface GPS velocity fields provides an even more robust basis for interpreting crustal deformation patterns.
Spatial analysis reveals systematic correlations between azimuthal anisotropy patterns and GPS-derived velocity fields across the study region. Within the northern Thailand (18.5°–19.5° N, 98°–101° E), characterized by high shear wave velocities throughout the 15–35 km depth range, the fast polarization directions exhibit consistent southeastward orientation. The anisotropic fabric shows spatial correlation with GPS velocity vectors in the STT, where surface measurements indicate predominantly eastward motion. This correlation extends to the ICT, where the anisotropy orientations align with the observed northwest–southeast GPS velocity field. The spatial correspondence between present-day surface kinematics, as recorded by GPS measurements, and crustal anisotropic fabric suggests a coherent deformation pattern that extends through multiple crustal levels, with pronounced expressions along terrane boundaries.
Along the STT and ICT boundary, fast polarization directions tend to align parallel or subparallel to this boundary. While the anisotropy amplitudes near the terrane boundary are generally smaller compared to the northern Thailand, they maintain a consistent pattern of alignment with the boundary.
A noticeable change in the anisotropy pattern is observed across the terrane boundary, with more variable directions and generally smaller amplitudes in the ICT compared to the STT. The highest Asv values concentrate in the northern Thailand, coinciding with the high-velocity anomaly. This spatial correlation implies a strong relationship between crustal velocity structure and seismic anisotropy degree.
SWS measurements [7] further confirm these anisotropy patterns, particularly in the lithospheric layer at stations in the high-velocity regions, where the azimuth of the fast polarization axis aligns with the tomographic observations.
4. Conclusions
Our ambient noise tomography study has provided unprecedented insights into the three-dimensional crustal structure and deformation patterns beneath northern and central Thailand. The derived shear wave velocity model reveals significant lateral heterogeneities that persist through the 15–35 km depth range. A systematic velocity contrast is observed between the STT and ICT, with velocities ranging from 3.615–3.675 km/s at 15–20 km depth to 3.650–3.720 km/s at 30–35 km depth. The boundary between these terranes is clearly delineated by a lateral velocity gradient. The ICT consistently exhibits lower velocities relative to the STT, suggesting fundamental differences in crustal properties that persist across all depths. The northern Thailand (18.5°–19.5° N, 98°–101° E), corresponding to the STT, shows sustained high velocities throughout the analyzed depth range, indicating a rigid crustal structure. The azimuthal anisotropy patterns reveal systematic spatial variations in crustal deformation. The fast polarization directions exhibit consistent southeastward orientation in the northern Thailand, showing spatial correlation with GPS velocity vectors in the STT. This correlation extends to the ICT, where anisotropic orientations align with the observed northwest–southeast GPS velocity field. The spatial correspondence between present-day surface kinematics and crustal anisotropic fabric suggests a coherent deformation pattern that extends through multiple crustal levels, with pronounced expressions along terrane boundaries.
Conflicts of Interest
The authors declare no conflicts of interest.
Author Contributions
Kasemsak Saetang conceptualized the study, designed the methodology, carried out data acquisition, performed the initial stages of data collection, conducted data analysis and interpretation, and prepared the original draft of the manuscript. Wilaiwan Srisawat assisted in data acquisition. Both authors were involved in the development of the methodology, as well as reviewing and editing the manuscript. Kasemsak Saetang and Wilaiwan Srisawat critically reviewed the final manuscript prior to submission. All authors have read and agreed to the submitted version of the manuscript.
Funding
No funding was received for this research.
Acknowledgments
We gratefully acknowledge the Incorporated Research Institutions for Seismology (IRIS) for their indispensable data management and distribution services.
Open Research
Data Availability Statement
The data that support the findings of this study are openly available in data at NSF SAGE at https://ds.iris.edu/ds/nodes/dmc/data.


