A Hybrid Machine Learning Approach for Estimating Aboveground Biomass and Carbon Stock in Tanzania’s Miombo Woodlands
Abstract
The complexity of Miombo woodlands, characterized by diverse attributes, poses challenges in developing accurate and reliable biomass estimation models using conventional approaches. Conventional approaches inadequately capture the intricate relationships between biomass and the numerous factors in Miombo woodlands. This study proposes a novel approach combining artificial neural networks (ANNs) and random forest (RF) algorithms to estimate AGB and carbon stock in the Miombo Woodland Ecosystem. A model (ANN-RF) was developed using a combination of ANN and RF models. Initially, the RF algorithm combined the predictions from the ANN models. Then, a stacking technique was used to integrate both the ANN and RF models. Comparative models such as allometric, ANN, and RF models were also established. Traditional allometric models refer to regression-based allometric equations commonly used for biomass estimation. The input variables for estimating AGB and carbon stock included diameter at breast height, tree height, basal area, stem density, slope, elevation, precipitation, and soil pH. Model quality was evaluated using root-mean-square error (RMSE, Mg/tree), coefficient of determination (R2), and mean absolute error (MAE, Mg/tree). The combined ANN-RF model outperformed individual models and traditional allometric equations, achieving the highest accuracy with R2 = 0.975, RMSE = 0.153 Mg/tree, and MAE = 0.053 Mg/tree using the full input set. Even with reduced input variables, the ANN-RF model maintained superior performance. Traditional allometric models showed significantly lower accuracy, highlighting the effectiveness of the ANN-RF model for estimating AGB and carbon stock in the Miombo Woodland Ecosystem.
1. Introduction
Forests are vital for maintaining ecological balance and providing numerous ecosystem services, making them essential for global environmental health [1]. They act as significant carbon sinks by sequestering carbon dioxide from the atmosphere, thereby mitigating climate change [2, 3]. Acknowledging the importance of forests in carbon storage and biodiversity conservation, international initiatives such as the United Nations Framework Convention on Climate Change (UNFCCC) have provided strategies to combat deforestation, including reducing emissions from deforestation and forest degradation (REDD+), afforestation programs, and sustainable forest management [1, 4].
Among various forest types, Miombo Woodlands are a notable subtype of tropical forests, predominant in Tanzania and other parts of Africa, distinguished by their diverse flora and fauna, play a fundamental role in global carbon generation. These woodlands display distinct physiognomic variations, classified into dry and wet Miombo based on annual rainfall [5, 6]. Covering about 33.4 million hectares, Woodlands consist of several dry forest types, including Miombo Woodlands, and constitute approximately 95% of Tanzania’s total forest and woodland area [7]. The carbon stock in Miombo Woodlands, particularly the aboveground biomass (AGB) and aboveground carbon (AGC) stock per hectare, varies significantly across different regions in Tanzania [8].
Since Miombo Woodlands are highly populated woodlands, accurate estimation of biomass and carbon is crucial for developing and implementing mitigation strategies to reduce greenhouse gas emissions globally in tropical regions. Traditional methods for AGB estimation, such as allometric equations, often fall short in capturing the complex structure and spatial variability of Miombo Woodlands [9]. The inadequacies of the current model stem arise from their inability to account for the inherent variability in tree structures, species-specific growth patterns, and regional environmental factors within the Miombo woodlands ecosystem (MWE) [10]. Consequently, there is an increasing interest in leveraging advanced modeling techniques, such as artificial neural network (ANN) and random forest (RF) algorithms, to enhance the accuracy of AGB and carbon stock estimation.
This study aimed to develop an advanced statistical model by integrating advanced statistical techniques, specifically ANN and RF algorithms. By doing so, this study seeks to improve the precision of AGB and carbon stock estimates in Miombo Woodlands.
The outcomes of this research will contribute to the advancement of biomass estimation techniques in Miombo Woodlands and have broader implications for enhancing carbon stock assessments in similar ecosystems globally.
2. Materials and Methods
2.1. The Study Area
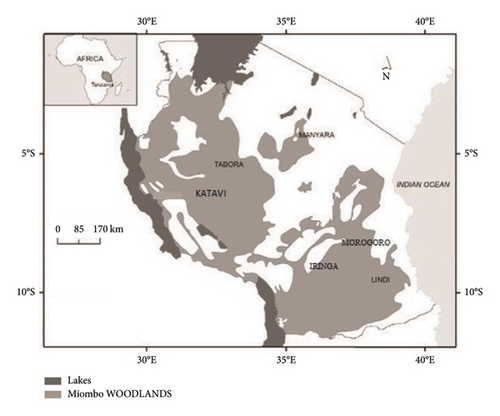
The study was conducted in Tanzania across six Miombo woodland forests. These included Angai Forest Reserve (AFR) in the Lindi region, Ayasanda and Duru Haitemba (ADH) in the Manyara region, and Gangalamtumba Village Land Forest Reserve (GVLFR) in the Iringa region. The other forests were Mkulazi Catchment Forest Reserve (MCFR) in Morogoro and Nyahua Forest Reserve (NFR) in Tabora as well as Mpanda in Katavi region (Figure 1).
2.2. Study Design and Selection of Study Sites
This was a panel longitudinal and systematic study conducted on randomly sampled trees. The selection of regions, forests, and subsequent Miombo trees were sampled based on double sampling for the stratification method. Initially, a dense grid of clusters was placed over the map of mainland Tanzania, with clusters spaced 5 km apart, forming the first-phase sample. Second-phase samples were systematically selected from the first-phase sample, with varying sampling intensities in each of the six regions. Subplots within each 1-ha plot were used for tree measurements in line with the National Forest Resources Monitoring and Assessment of Tanzania (NAFORMA) protocols [11].
2.3. Data Collection
High-resolution climate data at 2.5 arc-minute spatial resolutions were obtained from the WorldClim v2.1 database (https://www.worldclim.org/data/worldclim21.html) for the baseline period of 1970–2000 [14]. The key climate variable utilized in this study was mean annual Prt, which was spatially analyzed and visualized across Miombo Woodland sites to assess geographic variation in rainfall distribution, as shown in Figure 2.

2.4. Population and Sample Size
In this study, the population refers to all trees in Tanzania’s Miombo Woodlands. The population of trees is estimated to be 20,080 [15]. Because the study could not study all Miombo woodlands, a sample of 1619 trees was included in the study. The sample was adopted from NAFORMA as proportionally distributed among the six Miombo Woodland forests, as presented in Table 1.
| Forests | Region | Category | Sample size |
|---|---|---|---|
| GVLFR | Iringa | Dry miombo | 283 |
| Mpanda | Katavi | Wet miombo | 263 |
| AFR | Lindi | Wet miombo | 270 |
| ADH | Manyara | Dry miombo | 263 |
| MCFR | Morogoro | Wet miombo | 277 |
| NFR | Tabora | Dry miombo | 263 |
| Total | 1619 |
2.5. Data Preparation and Exploration
The dataset was initially imported into R Studio for preliminary examination to assess its structure and contents. This process involved identifying variable types, evaluating the completeness of records, and detecting any inconsistencies or outliers. To enhance model simplicity and interpretability, the analysis excluded categorical variables such as site or species names, which tend to increase model complexity without substantially improving predictive performance [16]. Instead, emphasis was placed on the most relevant numeric variables known to significantly contribute to the estimation of AGB and carbon stock.
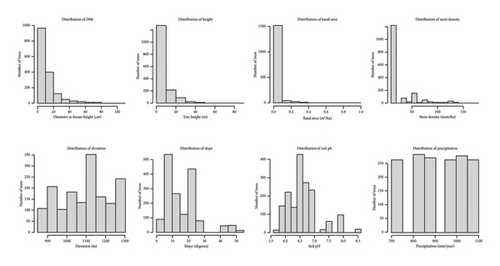
The variables retained for analysis include Dbh, Ht, BA, SD, Elv, Slp, SpH, and annual Prt. These variables are frequently cited in the ecological modeling literature as key predictors of forest biomass and carbon stocks. Descriptive statistics for each variable are summarized in Table 2, providing an overview of their central tendencies and ranges. Additionally, Figure 3 presents histograms for each numeric variable, offering visual insights into their distributional properties and potential skewness, which are critical for selecting appropriate modeling techniques.
| Statistic | Dbh (cm) | Ht (m) | BA (m2/ha) | SD (stem/ha) | Elv (m) | Slp (degrees) | SpH | Prt (mm/year) | AGB (Mg/tree) | AGC (Mg/tree) |
|---|---|---|---|---|---|---|---|---|---|---|
| Min. | 0.6 | 1.0 | 2.8e − 05 | 14.1 | 859 | 0.0 | 5.7 | 704 | 0.004 | 0.002 |
| 1st Qu. | 6.3 | 2.2 | 3.1e − 03 | 14.1 | 979 | 10.0 | 6.4 | 821 | 0.162 | 0.081 |
| Median | 8.7 | 2.7 | 5.9e − 03 | 14.1 | 1121 | 12.0 | 6.6 | 864 | 0.388 | 0.194 |
| Mean | 13.2 | 6.7 | 2.6e − 02 | 26.6 | 1096 | 17.3 | 6.6 | 909 | 1.281 | 0.641 |
| 3rd Qu. | 14.6 | 5.9 | 1.7e − 02 | 14.1 | 1180 | 25.0 | 6.9 | 1010 | 1.119 | 0.560 |
| Max. | 110.0 | 88.1 | 9.5e − 01 | 175.2 | 1288 | 55.0 | 8.5 | 1083 | 27.244 | 13.622 |
- Note: AGC = 0.5AGB (where, 0.5 is the commonly used average carbon fraction factor for most trees [2]).
2.6. Feature Importance Analysis
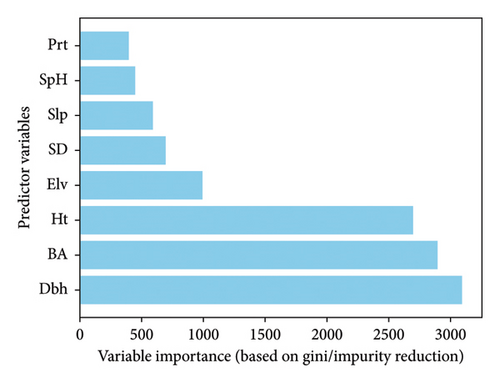
Understanding the relative contribution of different variables in predicting AGB and carbon stock is crucial for accurate estimations [17, 18]. In this study, we applied the RF algorithm to assess feature importance, quantifying the significance of each predictor based on its ability to reduce impurity within the forest’s decision trees [19].
The results, illustrated in Figure 4, highlight the varying degrees of influence among the examined variables. The figure ranks predictors according to their impact on model accuracy, with Dbh emerging as the most influential factor, followed by BA and Ht. These findings underscore the dominant role of tree structural attributes in estimating AGB and carbon stock [20].
2.7. Models for Estimating the AGB and AGC Stock
The AGB estimates produced by the models represent individual tree biomass, calculated using tree-level input variables such as Dbh and Ht, which ranged from 0.6 to 110.0 cm and 1.0 to 88.1 m, respectively. These measurements capture the structural variation among trees, which significantly influences biomass accumulation. BA and AGB are initially computed at the tree level, with AGB values ranging from 0.004 to 27.244 Mg per tree. Plot-level characteristics, such as SD, ranging from 14.1 to 175.2 stems/ha, are incorporated to reflect the competitive environment that affects individual tree growth [21]. Although the modeling framework operates at the individual tree level, the outputs can be aggregated to stand-level estimates (e.g., Mg C/ha) to support forest management, carbon accounting, and ecological assessments.
2.8. Model Architecture and Stacking Approach
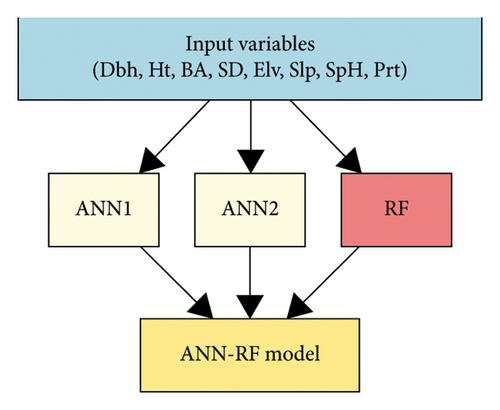
To estimate AGB, a hybrid ensemble learning framework was employed by integrating ANNs and RF using a stacked generalization approach. The workflow consisted of base learners: two ANNs and one RF, followed by a meta-learner trained on their predictions.
2.8.1. ANNs (ANN1 and ANN2)
Hyperparameters such as the number of hidden nodes (size) and weight decay (decay) were tuned using 10-fold cross-validation. ANN1 used default tuning parameters, while ANN2 was further optimized using tuneLength = 5.
is used in stacking but has the least contribution based on the coefficient (β1 = 0.0146).
significantly contributes to the stacked model (β2 = 0.1477).
2.8.2. RF
2.9. Stacked Ensemble Meta-Learner (ANN-RF)
2.10. Data Partitioning and Model Evaluation
In the formulas provided, “n” denotes the total number of data points; “yi,” “ ,” and “” represent the measured, predicted, and mean values of “yi,” respectively.
2.11. Hyperparameter Tuning Process
To ensure optimal model performance, hyperparameter tuning was conducted for all base learners (ANN1, ANN2, and RF) as well as for the final stacked ensemble model.
ANNs (ANN1 and ANN2) consisted of a single hidden layer with sigmoid activation and a linear output node. ANN1 was configured with default hyperparameters, using a hidden layer size of five neurons and a weight decay parameter of 0.1. The tuning process employed a basic grid search with tuneLength = 3 under 10-fold cross-validation. ANN2 underwent extended tuning, with hyperparameters optimized using tuneLength = 5. This resulted in an improved configuration with a hidden layer size of nine neurons and a lower decay rate of 0.0001, which helped reduce overfitting while maintaining model flexibility.
The RF model was trained using the randomForest package in R. Key hyperparameters were selected based on prior experimentation and validation. The number of trees was set to 400 (ntree = 400) to ensure model stability and reduce variance. The number of variables randomly selected at each node split was set to seven (mtry = 7), which corresponds to the square root of the total number of predictor variables, following best-practice heuristic rule.
The predictions from ANN1, ANN2, and RF on the training data were used as input features for a meta-learner based on linear regression. As the meta-model (ANN-RF) does not involve complex tuning parameters, no additional hyperparameter optimization was required. The stacking approach was used to leverage the complementary strengths of the base learners, with model weights estimated through ordinary least square (OLS) regression.
3. Results
This study employed advanced machine learning techniques, including two ANNs (ANN1 and ANN2), a RF model, and an integrated ANN-RF hybrid model to capture the complex interactions among tree-specific, topographical, and environmental variables. Model performance was evaluated using R2, RMSE, and MAE. As summarized in Table 3, the machine learning models developed in this study significantly outperformed traditional regression-based allometric models applied to the same dataset.
| S/n | Author | Biomass model | R2 | RMSE | MAE |
|---|---|---|---|---|---|
| 1 | This study (Group ‘a’-ANN1) | AGB∼Dbh + Ht + BA + SD + Elv + Slp + SpH + Prt | 0.925 | 0.262 | 0.099 |
| 2 | This study (Group ‘a’-ANN2) | AGB∼Dbh + Ht + BA + SD + Elv + Slp + SpH + Prt | 0.954 | 0.207 | 0.108 |
| 3 | This study (Group ‘a’ - RF) | AGB∼Dbh + Ht + BA + SD + Elv + Slp + SpH + Prt | 0.973 | 0.168 | 0.045 |
| 4 | This study (Group ‘a’-ANN-RF) | AGB∼Dbh + Ht + BA + SD + Elv + Slp + SpH + Prt | 0.975 | 0.153 | 0.053 |
| 5 | This study (Group ‘b’-ANN1) | AGB∼Dbh + Ht + BA | 0.970 | 0.167 | 0.078 |
| 6 | This study (Group ‘b’-ANN2) | AGB∼Dbh + Ht + BA | 0.960 | 0.195 | 0.075 |
| 7 | This study (Group ‘b’-RF) | AGB∼Dbh + Ht + BA | 0.962 | 0.186 | 0.045 |
| 8 | This study (Group ‘b’-ANN-RF) | AGB∼Dbh + Ht + BA | 0.966 | 0.178 | 0.050 |
| 9 | This study (Group ‘c’-ANN1) | AGB∼Dbh + Ht | 0.954 | 0.207 | 0.109 |
| 10 | This study (Group ‘c’-ANN2) | AGB∼Dbh + Ht | 0.974 | 0.157 | 0.063 |
| 11 | This study (Group ‘c’-RF) | AGB∼Dbh + Ht | 0.965 | 0.183 | 0.055 |
| 12 | This study (Group ‘c’-ANN-RF) | AGB∼Dbh + Ht | 0.958 | 0.196 | 0.066 |
| 13 | This study (Group ‘d’-ANN1) | AGB∼Dbh | 0.447 | 0.721 | 0.307 |
| 14 | This study (Group ‘d’-ANN2) | AGB∼Dbh | 0.447 | 0.721 | 0.307 |
| 15 | This study (Group ‘d’-RF) | AGB∼Dbh | 0.400 | 0.777 | 0.319 |
| 16 | This study (Group ‘d’-ANN-RF) | AGB∼Dbh | 0.361 | 0.851 | 0.341 |
| 17 | Abbot et al. [22] | log10AGB = −3.85 + 2.49 log10Dbh | 0.206 | 1.343 | 1.106 |
| 18 | Brown [23] | AGB = 0.1359Dbh2.2320 | 0.348 | 1.052 | 0.996 |
| 19 | Chamshama et al. [24] | AGB = 0.0625Dbh2.553 | 0.323 | 1.049 | 0.985 |
| 20 | Malimbwi et al. [25] | AGB = 0.0001Dbh2.032Ht0.66 | 0.338 | 1.047 | 0.978 |
| 21 | Malimbwi and Temu [26] | AGB = 0.092Dbh2.59 | 0.320 | 1.049 | 0.984 |
| 22 | Mugasha et al. [27] | AGB = 0.1027Dbh2.4798 | 0.329 | 1.050 | 0.988 |
| 23 | Mugasha et al. [13] | AGB = 0.0763Dbh2.2046Ht0.4918 | 0.342 | 1.047 | 0.979 |
| 24 | Mwakalukwa et al. [29] | ln(AGB) = −2.6896 + 1.9041 ln(Dbh) + 0.9377 ln(Ht) | 0.153 | 1.357 | 1.110 |
| 25 | Temu [28] | log10AGB = −1.2875 + 2.8436 log10Dbh | 0.206 | 1.343 | 1.106 |
- Note: “This study” refers to models developed in this study, grouped as follows: Group ‘a’ (Dbh, Ht, BA, SD, Elv, Slp, SpH, and Prt), Group ‘b’ (Dbh, Ht, and BA), Group ‘c’ (Dbh and Ht), and Group ‘d’ (Dbh only). For example, “This study (Group ‘a’-ANN1)” indicates the specific machine learning model (ANN1) using Group ‘a’ predictors.
3.1. Model Performance Evaluation
Visual assessments of model predictions (Figure 6) provided initial evidence of strong model accuracy. The scatter plot (Figure 6(a)) of observed versus predicted AGB values demonstrated that most data points clustered tightly around the 1:1 reference line, indicating high predictive precision. Additionally, the residuals versus predicted AGB plot (Figure 6(b)) confirmed that model errors were centered near zero and randomly distributed, with no discernible patterns or signs of systematic bias.
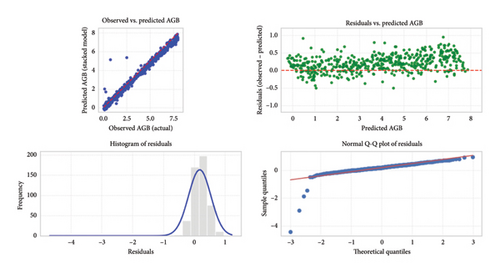
Further analysis of the residuals, through both histogram and normal Q-Q plots, supported these findings. The residual histogram (Figure 6(c)) exhibited a symmetric, approximately normal distribution centered at zero, while the Q-Q plot (Figure 6(d)) suggested acceptable adherence to normality, with only minor deviations observed at the distribution tails. Together, these diagnostics confirmed the robustness, reliability, and unbiased nature of the machine learning models.
A meta-learner or linear regression model was employed to evaluate the individual contributions of ANN1, ANN2, and RF to AGB prediction within a hybrid ensemble. The model exhibited an excellent fit, with a multiple R2 of 0.987 and an adjusted R2 of 0.987, indicating that 98.7% of the variance in AGB is explained by the combined predictions. The model was statistically significant (F-statistic = 31,990, p < 2.2e − 16) and had a low residual standard error (0.1165), reflecting high prediction accuracy.
Individually, the RF model made the most substantial and highly significant contribution (β = 0.8763, p < 0.001), followed by ANN2 (β = 0.1477, p < 0.001), which also provided a meaningful complementary effect. Conversely, ANN1’s contribution was statistically insignificant (β = 0.0146, p = 0.361), suggesting a minimal added predictive value. The intercept was also nonsignificant (p = 0.849), as shown in Table 4. These results underscore that the RF model is the primary driver of predictive accuracy in the ensemble, with ANN2 offering additional support, while ANN1 contributes negligibly.
| Coefficient | Estimate | Std. error | t value | p value | Significance |
|---|---|---|---|---|---|
| (Intercept) | 0.0006 | 0.0032 | 0.19 | 0.849 | |
| ANN1 | 0.0146 | 0.016 | 0.913 | 0.361 | |
| ANN2 | 0.1477 | 0.0186 | 7.922 | 5.01e − 15 (< 0.001) | ∗∗∗ |
| RF | 0.8763 | 0.0188 | 46.723 | < 2e − 16 (< 0.001) | ∗∗∗ |
- Note: Significance codes: 0 ‘∗∗∗’ 0.001 ‘∗∗’ 0.01 ‘∗’ 0.05 ‘.’ 0.1 ‘’ 1.
3.2. Comparative Model Performance for AGB Prediction
This study evaluated the performance of AGB prediction models across four configurations, each employing varying sets of predictor variables. The models assessed include two ANNs (ANN1 and ANN2), RF, and a hybrid ANN-RF model.
In Model ‘a’, which incorporated a comprehensive set of predictors (Dbh, Ht, BA, SD, Elv, Slp, SpH, and Prt), the hybrid ANN-RF model achieved the best performance with an R2 value of 0.975, an RMSE value of 0.153 Mg/tree, and an MAE value of 0.053 Mg/tree. The RF model also demonstrated strong accuracy (R2 = 0.973, RMSE = 0.168 Mg/tree, and MAE = 0.045 Mg/tree). While ANN1 (R2 = 0.925) and ANN2 (R2 = 0.954) provided reasonable results, their errors were comparatively higher (ANN1: RMSE = 0.262 Mg/tree, MAE = 0.099 Mg/tree, ANN2: RMSE = 0.207 Mg/tree, and MAE = 0.108 Mg/tree). Residual and scatter plots (Figure 6) further confirmed the superior fit and minimal prediction errors of the ANN-RF and RF models in this configuration.
Focusing on the most influential variables (Dbh, Ht, and BA), Model ‘b’ proverb ANN1 outperform the other models, achieving an R2 value of 0.970, an RMSE value of 0.167 Mg/tree, and an MAE value of 0.078 Mg/tree. The ANN-RF (R2 = 0.966, RMSE = 0.178 Mg/tree, and MAE = 0.050 Mg/tree) and RF (R2 = 0.962, RMSE = 0.186 Mg/tree, and MAE = 0.045 Mg/tree) models also maintained robust accuracy in this configuration. Notably, despite the reduced number of predictors, the performance of these models remained comparable to those using the full variable set, indicating the high predictive power of Dbh, Ht, and BA.
In Model ‘c’, which utilized Dbh and Ht as predictors, ANN2 showed the best performance with an R2 value of 0.974, an RMSE value of 0.157 Mg/tree, and an MAE value of 0.063 Mg/tree. The RF model also performed well (R2 = 0.965, RMSE = 0.183 Mg/tree, and MAE = 0.055 Mg/tree). ANN1 and ANN-RF also yielded good results (ANN1: R2 = 0.954, RMSE = 0.207 Mg/tree, and MAE = 0.109 Mg/tree; ANN-RF: R2 = 0.958, RMSE = 0.196 Mg/tree, and MAE = 0.066 Mg/tree).
In contrast, Model ‘c’, which relied exclusively on Dbh as the sole predictor, exhibited significantly poorer performance across all models. Both ANN1 and ANN2 recorded a low R2 value of 0.447, with markedly higher errors (RMSE = 0.721 Mg/tree and MAE = 0.307 Mg/tree). The RF (R2 = 0.400) and ANN-RF (R2 = 0.361) models also showed substantial drops in accuracy, further emphasizing that using Dbh alone is insufficient for reliable AGB estimation.
Generally, the results underscore the critical importance of incorporating multiple predictor variables to achieve high-accuracy AGB predictions. The ANN-RF hybrid model consistently demonstrated strong performance, particularly when a comprehensive set of variables was included, while the significance of Dbh, Ht, and BA as key influential variables was also highlighted (refer Figure 4).
3.3. Comparison With Traditional Allometric Models
This study’s machine learning models consistently and significantly outperformed traditional allometric equations in predicting AGB, even when these traditional equations were tested using the identical dataset (n = 1619) employed to train the machine learning models. Crucially, this dataset comprises samples from both wet and dry Miombo Woodlands, a diverse ecosystem where traditional allometric equations are often developed for specific subtypes (wet or dry Miombo) or even for individual species, possibly limiting their applicability across the full spectrum. The superior performance of this study’s models highlights the significant benefits of their adaptability to complex ecological variations and their ability to leverage a wider range of predictor variables.
Traditional allometric models, such as those by Abbot et al. [22], Brown [23], Chamshama et al. [24], Malimbwi et al. [25], Malimbwi and Temu [26], Mugasha et al. [13, 27], Mwakalukwa et al. [12], and Temu [28], consistently exhibited much lower predictive accuracy on the common dataset. Their R2 values ranged from 0.153 to 0.348, accompanied by substantially higher errors (refer Table 3).
3.4. Key Findings
Models that incorporate more predictor variables (Dbh, Ht, BA, SD, Elv, Slp, SpH, and Prt) perform better in terms of R2, RMSE, and MAE. This highlights the importance of considering multiple factors in biomass estimation. The ANN-RF hybrid model consistently outperforms individual ANN or RF models, indicating that combining the strengths of different modeling approaches can lead to improved predictive performance.
Traditional models from previous studies generally perform poorly compared to the models developed in this study, suggesting that newer machine learning approaches (ANN and RF) provide significant improvements in biomass estimation accuracy and precision. The results demonstrate that advanced statistical models, particularly the integrated ANN-RF approach, significantly enhance the accuracy of AGB and carbon stock estimates in Miombo Woodlands. These findings support the adoption of advanced modeling techniques in biomass estimation efforts, which can inform more effective forest management and climate change mitigation strategies.
4. Discussion
The development and evaluation of a hybrid machine learning model (ANN-RF) for estimating AGB and carbon stock in Tanzania’s Miombo Woodlands revealed significant advancements over traditional allometric models, as evidenced by superior performance metrics across various predictor configurations. This discussion critically examines the performance of the ANN-RF model, individual machine learning models (ANN1, ANN2, and RF), and traditional allometric models, contextualizing their effectiveness in terms of predictive accuracy, dataset characteristics, predictor variables, and model complexity.
4.1. Model Performance Comparison
The ANN-RF hybrid model, particularly when utilizing the full set of predictors (Group ‘a’: Dbh, Ht, BA, SD, Elv, Slp, SpH, and Prt), achieved the highest predictive accuracy, with an R2 value of 0.975, RMSE value of 0.153 Mg/tree, and MAE value of 0.053 Mg/tree. This performance markedly surpassed that of individual machine learning models (ANN1: R2 = 0.925, RMSE = 0.262 Mg/tree, and MAE = 0.099 Mg/tree; ANN2: R2 = 0.954, RMSE = 0.207 Mg/tree, and MAE = 0.108 Mg/tree; RF: R2 = 0.973, RMSE = 0.168 Mg/tree, and MAE = 0.045 Mg/tree) and traditional allometric models, which reported R2 values ranging from 0.153 to 0.348 and RMSE values from 1.047 to 1.357 Mg/tree (Table 3). The superior performance of the ANN-RF model is attributed to its ability to integrate the complementary strengths of ANN and RF through a stacking approach, capturing complex, nonlinear relationships among predictors that traditional allometric models fail to address [30–32].
When predictor sets were reduced, the ANN-RF model maintained robust performance. In Group ‘b’ (Dbh, Ht, and BA), the ANN-RF model achieved an R2 value of 0.966, RMSE value of 0.178 Mg/tree, and MAE value of 0.050 Mg/tree, closely followed by ANN1 (R2 = 0.970, RMSE = 0.167 Mg/tree, and MAE = 0.078 Mg/tree). In Group ‘c’ (Dbh and Ht), ANN2 outperformed others with an R2 value of 0.974, RMSE value of 0.157 Mg/tree, and MAE value of 0.063 Mg/tree. However, Group ‘d’ models, relying solely on Dbh, exhibited significantly poorer performance (R2 = 0.361–0.447, RMSE = 0.721–0.851 Mg/tree, and MAE = 0.307–0.341 Mg/tree), underscoring the critical importance of incorporating multiple predictors to capture the structural and environmental variability of Miombo Woodlands [33, 34].
In contrast, traditional allometric models, such as those by Mugasha et al. [13, 27], Mwakalukwa et al. [12], and Malimbwi et al. [35], exhibited lower predictive accuracy, with R2 values ranging from 0.153 to 0.348 and RMSE values from 1.047 to 1.357 Mg/tree. Notably, the literature-reported R2 values for some allometric models (such as, Mwakalukwa et al. [29], 96%–99% and Mugasha et al. [27], 95%–97%) were derived from species-specific or region-specific datasets, which may not generalize well across the diverse wet and dry Miombo Woodlands sampled in this study (n = 1619). The limited adaptability of allometric models to ecological heterogeneity likely explains their inferior performance compared to the machine learning models developed here [10].
4.2. Influence of Sample Size and Data Characteristics
The large sample size (n = 1619) used in this study, drawn from the NAFORMA database across six diverse Miombo Woodland sites, significantly enhanced the robustness of the machine learning models. In comparison, allometric models were developed with smaller datasets (such as Mugasha et al. [27]: n = 167, Mwakalukwa et al. [12]: n = 142 trees + 57 shrubs, and Malimbwi et al. [25]: n = 17–191). The larger dataset allowed the machine learning models to better capture the variability in tree structures, species compositions, and environmental conditions, thereby improving generalizability [16]. The stratified sampling approach, aligned with NAFORMA protocols, further ensured representative coverage of both wet and dry Miombo Woodlands, enhancing model applicability across Tanzania’s diverse forest ecosystems.
4.3. Role of Predictor Variables
The inclusion of a comprehensive set of predictors in Group ‘a’ (Dbh, Ht, BA, SD, Elv, Slp, SpH, and Prt) was critical to the ANN-RF model’s superior performance. Feature importance analysis (Figure 4) identified Dbh, Ht, and BA as the most influential predictors, consistent with the ecological modeling literature that emphasizes tree structural attributes as primary drivers of AGB [20, 33]. Environmental variables such as Elv, Slp, SpH, and Prt further refined predictions by accounting for topographic and climatic influences on biomass accumulation [8]. In contrast, allometric models typically relied on fewer predictors (such as, Dbh, Ht, and occasionally wood density), which, while parsimonious, limited their ability to capture complex ecological interactions [36]. The poor performance of Group ‘d’ models, using only Dbh, highlights the inadequacy of single-predictor models in complex ecosystems such as Miombo Woodlands.
4.4. Model Complexity and Practical Implications
Machine learning models, particularly the ANN-RF hybrid, are inherently complex and data-intensive, requiring large datasets and computational resources for training and tuning. The ANN-RF model’s stacking approach, combining predictions from ANN1, ANN2, and RF via a linear regression meta-learner, leverages the strengths of both neural networks (nonlinear pattern recognition) and RFs (robustness to overfitting) [30–32]. However, this complexity may limit their immediate applicability in field settings with limited computational infrastructure. Conversely, allometric models, being regression-based and requiring fewer predictors, offer simplicity and ease of use in field applications, making them practical for rapid biomass assessments [33]. The trade-off between accuracy and practicality suggests that machine learning models are best suited for large-scale, data-rich applications, such as national carbon inventories, while allometric models remain valuable for localized, resource-constrained settings.
4.5. Limitations and Future Directions
While the ANN-RF model demonstrated high accuracy, its reliance on a large dataset may limit its applicability in regions with sparse data. Exploring transfer learning or data augmentation techniques could enhance model performance in data-scarce environments. Furthermore, incorporating additional predictors, such as remote-sensing data or species-specific traits, could further improve model accuracy and generalizability [37]. Finally, validating the ANN-RF model across other tropical forest ecosystems would strengthen its applicability to global carbon accounting and REDD + initiatives.
5. Conclusion
The ANN-RF hybrid model significantly outperforms traditional allometric models and individual machine learning models in estimating AGB and carbon stock in Tanzania’s Miombo Woodlands, particularly when leveraging a comprehensive set of predictors. Its ability to capture complex ecological relationships makes it a powerful tool for enhancing carbon stock assessments and supporting sustainable forest management. However, the practical advantages of allometric models in field applications highlight the need for context-specific model selection. These findings underscore the potential of advanced machine learning techniques to revolutionize biomass estimation in complex tropical ecosystems, with broader implications for global climate change mitigation strategies.
Ethics Statement
The authors have nothing to report.
Consent
The authors have nothing to report.
Conflicts of Interest
The authors declare no conflicts of interest.
Funding
No funding was received for this research.
Acknowledgments
The authors would like to express their gratitude to the NCMC for allowing them to utilize the tree measurements’ dataset from the NAFORMA database.
Open Research
Data Availability Statement
The data that support the findings of this study are available on request from the corresponding author. The data are not publicly available due to privacy or ethical restrictions.


