Plant Biodiversity, Wetland Indicators, and Ecosystem Analysis of Human-Made Wetlands in Central Ethiopia
Abstract
Despite vital in conserving biodiversity, most natural wetlands were degraded and declined in numbers due to anthropogenic factors, thereby human-made wetlands have been established in Ethiopia. Thus, this study aimed to analyze plant diversity, wetland indicators, characteristic species, and ecosystem conditions of Ethiopian highland human-made wetlands. A systematic sampling design was employed for laying 20 quadrats (2 m2 each) in each wetland at a 50-m interval, where plant specimen sampling and cover estimation were made. A survey identified 74 plant species. These species belong to 26 families and 57 genera. Notably, 92% of the identified plants were herbs. Asteraceae and Poaceae were the most dominant families. The richness of Washa and Borale sites was 51 and 64, respectively, showed a significance difference at p < 0.05. The Shannon diversity and evenness of Washa and Borale sites were 2.32 and 0.93, and 2.53 and 0.96, respectively, also displayed significant differences at p < 0.05. Yet, 71% plant species similarity was observed between the two wetlands. In each wetland, > 52% and < 30% species were upland and wetland indicators with many annual species, respectively, indicating the ecosystem disturbance of the two wetlands and their being invaded by upland species. The ecological condition of Washa and Borale were also directly rated as mid-and high-impaired sites, respectively. Briefly, despite both Washa and Borale wetlands rich in plant diversity, they differed significantly in average richness, diversity, and evenness, besides in the richness of their upland and annual species, due to likely variations in their ecological and hydrological modifications. Hence, urgent in situ and ex situ community-based participatory restoring strategies are required.
1. Introduction
Wetland ecosystems are essential in conserving wetland biodiversity and in delivering vital ecosystem services for human well-being [1, 2]. For instance, wetlands like ponds/small reservoirs provide sustainable solutions to key issues of water management and climate change such as nutrient retention, flood regulation, and carbon sequestration [3]. Many Ethiopian wetlands also provide multiple ecosystem services [4] and major contribution to the local people, chiefly being the major source of water for irrigation, fish, livestock, and human drink, and cleaning, as well as materials like grasses and fodder [2–7]. However, household and city waste, deforestation, and polluted runoff from farms are harming wetlands by increasing nutrient and sediment levels [8]. These vital ecosystems are further threatened by urban sprawl, pollution, human intrusion, and climate change [9]. This might be due to these factors, half of the world’s natural wetlands have vanished since 1900 [10]. Ethiopia’s wetlands have suffered greatly as well, due to factors like expanding agriculture and grazing lands, resource extraction (water, sand, and soil for ceramic), urbanization, and invasive species [4, 7, 11–13]. The situation is worsened by a lack of data and strong wetland protection policies [4, 14]. Still, limited land access and large families have led to encroachment on wetlands for farming, grazing, and housing [4, 13, 15]. The best exemplary sites for their degradation are the highland wetlands [7, 11, 13] and Rift Valley lakes [4, 6]. Thus, these anthropogenic factors have threatened biodiversity, impaired the environmental functions of the wetlands, and affect people’s livelihoods [4, 5], besides creating potential influences on climate, ecological security, and human health [16].
These all pressures and effects are, therefore, demanding the creation of artificial wetlands in these vulnerable African countries including Ethiopia for coping with the challenges. It seems due to this that the Ethiopian government currently has focused on the development of many small-scale irrigation schemes of < 200 ha [17] via constructing small reservoirs (artificial wetlands) like those of Washa and Borale ones. The human-made wetlands (e.g., Boye) are also essential in supporting more plant biodiversity than natural wetlands (e.g., Haro, Agaro, Duda, and Bonchie) in southwestern Ethiopia [5]. Magee et al. [18] from the United States and Levy [10] from Florida and Australia also reported as artificial wetlands had more richness in plant and bird species than the nearby natural wetlands, respectively. Moreover, to the best of the present authors’ knowledge, the current plant biodiversity and ecological status of present wetlands were not yet studied. Consequently, understanding the biodiversity and health of Ethiopian wetlands requires further research on human-made ones. This study aimed, therefore, to address these gaps by (1) analyzing the composition and diversity of plant species, (2) identifying indicator and dominant plant species in the wetlands, and (3) assessing the overall ecological health of the wetlands. This information will be valuable for local stakeholders, authorities, and decision-makers. They can use these scientific data to make informed decisions regarding wetland management through prioritizing wetlands based on the financial resources they have.
2. Materials and Methods
2.1. Study Area
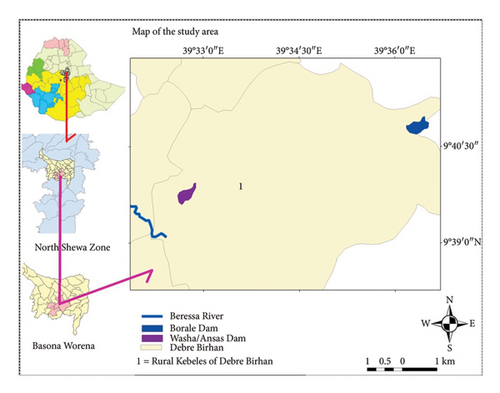
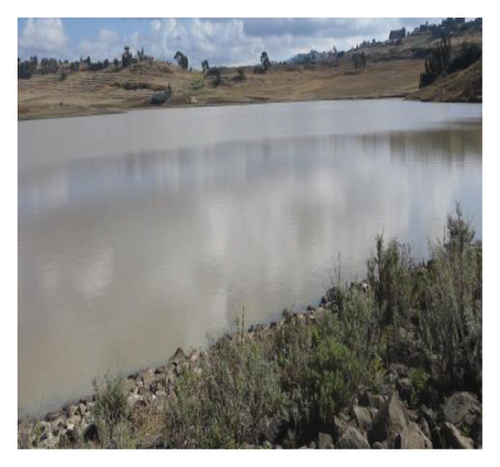
This study was conducted at two human-made wetlands, locally known as Washa and Borale. These wetlands are located in Kebele 01, Debre Birhan Regio-Politan Town (DBRPT), within the North Shewa Zone of Central Ethiopia (Figure 1). Both Washa and Borale lie outside the center of the town, at distances of 10 and 15 km, respectively. Their respective elevations are 2763 and 2832 m above sea level (m.a.s.l.). Washa’s geographic coordinates are 9°39′45″ N, 39°32′45″ E, while Borale’s are 9°39′62″ N, 39°32′36″ E. DBRPT experiences a range of temperatures, with an average annual minimum of 2.3°C and a maximum of 22°C. The average annual rainfall for the area is 906 mm [19]. These human-made wetlands serve a vital role for the local community. They provide essential water resources, as well as habitat for fish, birds, and various micro- and macroaquatic organisms. Observations within the wetlands’ catchments revealed diverse activities, including farming, grazing, small woodlot plantations, settlements, and water extraction for irrigation. These human activities placed stress on the two wetlands, particularly Borale, causing ecological damage and water scarcity. During the long dry seasons (December to May), the water levels in the wetlands dropped significantly, leading to a serious water shortage for local people, who rely on it specifically for irrigation and cattle watering, besides for others.
2.2. Study Site Selection
The Washa and Borale sites were selected due to their offering socioeconomic services to the localities and the commencement of conversion of the upper catchments and wetland parts at the downstream into agricultural and grazing lands, which in turn lead to reservoirs’ water reduction and degradation.
2.2.1. Washa Site
This human-made site was constructed in 1995 by a local nongovernmental organization (NGO) called Lutheran with the main aim of providing water for fisheries, irrigation, and livestock watering. The site comprised a reservoir (12 ha), the periphery part of the reservoir (16 ha), and irrigated land at downstream (28 ha). However, the samples were collected from the reservoir edges, since the centers of the reservoirs and surrounding irrigated lands were inaccessible. This is because the central zones were too deep, and the cultivated lands were perpetually under crops, offering no easy access for sample collection. The site is fed by seasonal flooding and small streams draining its catchment from the end of June to the beginning of September. The reservoir was designed to hold 91, 875 m3 water with 14-m depth, as informed by experts from Department and Office of Agriculture at zonal and urban levels, respectively. The catchment and its surrounding wetlands were characterized by farming, grass harvesting/grazing, and settlement activities. There was also high water extraction from the reservoir for irrigation and livestock watering, especially in the long dry season, from December to May.
2.2.2. Borale Site
It was constructed in 2007 by the Bureau of Agriculture of Amhara Regional State to provide water for irrigation, fisheries, and livestock watering. Borale site consisted of a reservoir (17 ha), the peripheries of the reservoir (17 ha), and irrigated land at the downstream (120 ha). However, the plot samples were taken from the periphery parts like that of the Washa site. The reservoir is fed by seasonal flooding and three small streams draining its catchment, particularly in the rainy season. It was designed to hold 280,000 m3 of water with 14-m depth. Grazing, grass harvesting, farming, and water extraction for irrigation were also the main activities executed in and around the site.
2.3. Sampling Design, Vegetative Data Collection, and Identification Procedures
To observe the changes of plants and hydrological and ecosystem landscape in the wetlands during the dry and wet seasons, and determine the sampling design, a reconnaissance survey was carried out for 2 weeks in May and September 2019. Accordingly, a systematic sampling design was employed for laying out the quadrats in both sites. For this, reservoir boundaries were firstly delineated with the maximum extent of flooding or the edge of depressions. Since almost all plants of the peripheries were herbaceous, a 1 × 2 m quadrat size [20] was fixed for maximizing to get more species. Then, the quadrats were laid out in the peripheries of the reservoirs. The plant sampling was made using 50-m intervals between two consecutive quadrats. Yet, where the periphery sites were wide enough, adjacent quadrats were aligned parallel to one another, 50 m apart. Hence, 40 total quadrats (20 per site) were laid out in the study area.
The specimens and percent cover of all vascular plant species encountered in each quadrat of the study area were collected and estimated, respectively. Accordingly, the specimens were collected at the end of the rainy and dry seasons. The first round plant specimens’ collection was made in October 2020 at the end of the rainy season, and the second round in February 2021 during the dry season. The aerial ground cover-abundance value of each herbaceous species was determined in percent (%) using ocular estimation and immediately converted into the Braun–Blanquet (BB) scales ranged from 1 to 9 as modified by van der Maarel [21]: 1 for 1–3 individuals; 2 for some individuals (0.5%–1.5%); 3 for some individuals (1.5%–3%); 4 for some individuals (3%–5%); 5 for some individuals (5%–12.5%); 6 for some individuals (12.5%–25%); 7 for some individuals (25%–50%); 8 for some individuals (50%–75%); and 9 for some individuals (75%–100%). Accordingly, the whole specimens collected, dried, and pressed were taken to Debre Berhan University for identification using the flora volumes of Ethiopia and Eritrea [22–30]. However, for further identification and approval being assisted by expert, mounted specimens, and microscope, the whole specimens were taken to the National Herbarium (ETH) of Addis Ababa University. Additionally, wetland indicator species status [obligate wetland (OW), facultative wetland (FW), facultative (F), facultative upland (FU), and obligate upland (OU) plants], perennial, annual, and native/non-native species were determined being assisted by experts and published documents including the flora volumes of Ethiopia and Eritrea [22–32]. Finally, the voucher specimens were placed there.
2.4. Field Checklist and Human Disturbance Gradient Score (HDGS) Protocol
The severity of ecosystem condition of wetlands could be estimated using various assessment methods of ecological disturbances. Thus, the field checklist and HDGS protocol of Gernes and Helgen [33] were employed (Appendix A). Based on this, from December 2020 to May 2021, frequent ecological evaluations were carried out during the dry and wet seasons. Hence, the reservoir/wetland type (hydroperiods), geometric setting (flood plain, riverine, and lacustrine), hydrological modification (due to stormwater inputs, filling, culvert, drainage, and ditch inlet and outlet), land-use patterns around the reservoirs, habitat assessment (presence or absence of fauna and flora such as birds, fish, mammals, and dominant macrophytes), and major threats (free grazing, water abstraction, infrastructure, and investment activities) to the reservoirs were assessed to rate the ecological state (natural, agricultural, grazing, or urban impaired) of the reservoirs using a field checklist.
Similarly, the physical buffer landscape disturbance (within 50-m radius) and further landscape disturbance up to 500-m radius from the edges of the reservoir were made (Appendix A). That means the extent of vegetation existence/removal, hydrological modifications, and habitat alterations were evaluated and rated following the protocol. Furthermore, chemical pollutants such as nitrate and phosphate, and the absence or presence of biological data like fish and birds were assessed. For this purpose, data collection from each referenced, mid-, and high-impacted sampling sites of each reservoir, one bottle water sample (1L), was taken for water chemical analysis, besides in situ measures of dissolved oxygen and electric conductivity.
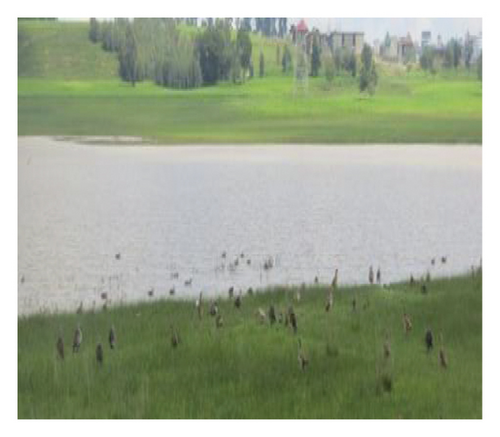
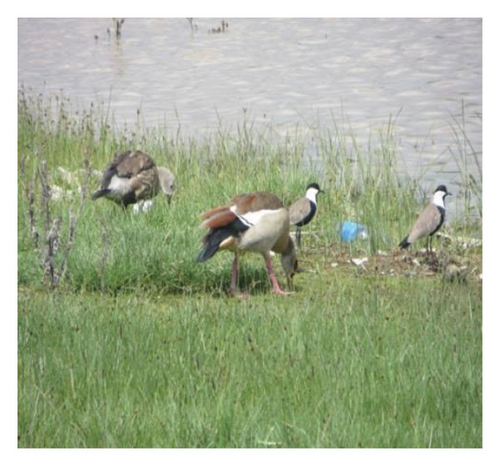
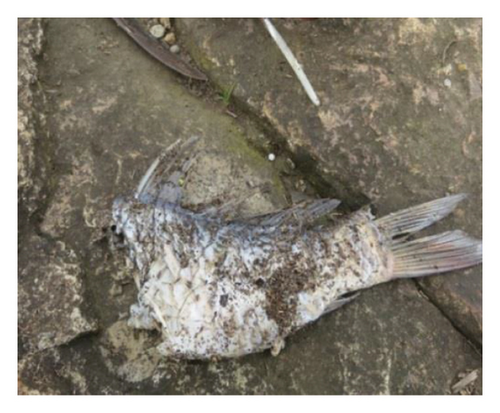
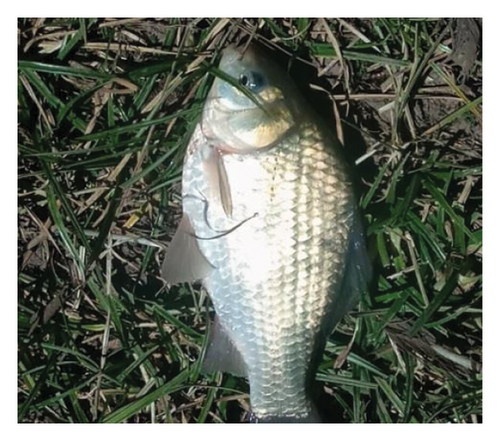
Additionally, field visits and fish nets were made for determining the presence of birds and capturing fish, respectively, since they are considered as good indicators of relatively healthy ecological status. During the field visits, different kinds of birds were observed within the reservoirs and their peripheries. However, gillnets were used for fishing and positioned in the late afternoon (8:00 pm) and inspected after two (10:00 pm) being assisted by local fish catchers, but captured a very few. The dead fish was also found in the periphery of Washa Reservoir. Informal interviews of local experts and individuals were also made about the presence of fish in both reservoirs.
2.5. Data Analysis
2.5.1. Diversity Analysis
The significant differences between the two wetlands for the values of those diversity indices were also tested using a nonparametric Mann–Whitney U-test (simply called U-test) as the field ecological data are mostly not distributed in a normal situation [5].
2.5.2. Wetland Plant Indicator Analysis
In order to identify wetland indicator species, we classified the observed plants into five groups: OW, FW, F, FU, and OU. This classification considered how often each species appeared in wetlands and uplands (details in Supporting File 1) and referenced other relevant studies [22–32, 36]. Identifying wetland indicator species is crucial for assessing the ecological health of wetlands [37]. Therefore, we grouped species from OW and FW together as wetland indicators, and FU and OU together as upland indicators. Species classified as F were excluded from both categories because they occur in wetlands and uplands with roughly equal frequency.
2.5.3. HDGS Analysis
Moreover, to determine the ecological status of each reservoir using HDGS, the various data sources were categorized into six factor groups to rate each of them using the severity and extent of alteration ranges from 0 to 18/21 points [33]. At the end, each factor was evaluated and scored into one of the four categories ranging from best to poor, with values ranging from zero to 18/21, respectively [33]. Finally, all scored values of the six factors were summed up to the study wetlands to get their total HDGS, and so, each wetland falls within the range of 0–100 HDGS (Appendix A). The wetlands with total HDGS values falling in either categorical ranges of 0–33, 34–67, or 68–100 are considered as the least impacted, midimpacted, or most impacted sites [33], in order.
3. Results
3.1. Plant Species Composition
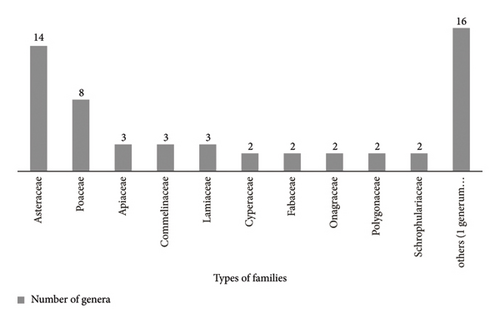
Totally, 74 plant species, belonging to 26 families and 57 genera, were identified from both Washa and Borale Wetlands (Appendix B). The Asteraceae, followed by Poaceae (grasses), were the most abundant, with the plants typically found in upland (drier) areas or in ecologically disturbed aquatic systems. Additionally, families like Cyperaceae (sedges), Fabaceae (legumes), Onagraceae (evening primroses), Polygonaceae (buckwheats), and Scrophulariaceae (figworts) were important for the wetlands’ character (Figure 2). However, the remaining 16 families, each with only one genus and one to two species (Supporting file 2), were less common in terms of their distribution and diversity. Interestingly, 14 families were found in both wetlands, while three and nine families were unique to Washa and Borale, respectively, indicating greater family diversity in Borale.
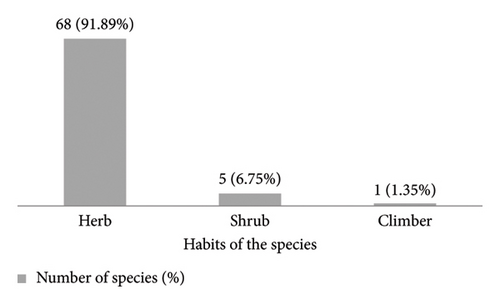
Examining plant habits, the majority (91.89%) were herbs, followed by shrubs (6.75%) and a minimal presence of climbers (1.35%) (Figure 3). This dominance of herbaceous plants aligns with the typical characteristics of aquatic ecosystems, which favor these low-growing species.
3.2. Diversity, SSC, and Dominant Species of the Study Sites
The gamma diversity (richness) of the overall study area, drawn from 40 total plots, was 74. The species richness distribution in 40 plots of the study area was ranged from eight species (in each plot of 20 and 21) to 20 species (in each plot of 7 and 12). The beta diversity (average richness) via pooling the whole sampling sites (40 plots) of the study area was 14.55. Similarly, the richness of Washa and Borale sites was 51 and 64 species, respectively. The beta diversity through pooling richness of the 20 plots of Washa Wetland and 20 plots of Borale wetland was 11.25 and 13.55, respectively, with their significance difference at p value < 0.05 (p = 0.025) (Table 1). As also presented in Table 1, the Shannon diversity (H′) of Washa and Borale sites was 2.32 and 2.53, respectively, with a significant difference at p value < 0.05. Similarly, the evenness (J) values of Washa and Borale sites were 0.93 and 0.96, respectively, and had a significant difference at p value < 0.05. Moreover, the SSC for the plant species found in Washa and Borale wetlands was 0.71 or 71% (Table 1).
| Diversity indices | Mean ± SE | U-test at p value | |
|---|---|---|---|
| Washa (n = 20) | Borale (n = 20) | ||
| Richness | 11.25 + 0.56 | 13.55 + 0.76 | 0.025 |
| Shannon diversity (H′) | 2.32 ± 0.05 | 2.53 ± 0.06 | 0.013 |
| Evenness (J) | 0.93 ± 0.01 | 0.96 ± 0.01 | 0.011 |
| Sorenson similarity (SSC) | 0.71 | ||
- Note: The nonparametric U-test is significant at p value < 0.05.
- Abbreviation: SE = standard error.
While considering the dominance of the species based on their total cover values and frequency (F) across 20 sample plots (n = 20) at each location (Borale and Washa), the top 15 species for each site are listed in Table 2. Accordingly, at the Borale site, Geranium dissectum L. was the most dominant species with an average cover value of 5.85 and found in 18 plots. Other dominant species included Eleocharis marginatum Hochst. ex Steud, Raven; Cyperus fischerianus G.W. Schimp. ex A. Rich.; Pennisetum thunbergii Kunth; Andropogon abyssinica Hochst; and Snowdenia polystachya (Fresen.) Pilg. These dominant species were found in most of the plots at Borale, ranging from 6 to 19 plots. Similarly, at the Washa site, G. dissectum was also a dominant species, along with E. marginatum, P. thunbergii, L. stolonifera, C. fischerianus, A. abyssinica, Ludwigia stolonifera (Guill. & Perr.), and Eleusine floccifolia (Forssk.) Spreng. These dominant species were found in a majority of the plots at Washa, ranging from 6 to 19 plots (Table 2). Interestingly, these dominant plant species of the two sites are typically found in upland and tend to thrive in ecologically disturbed aquatic environment.
| Dominant species | Washa (n = 20) | Dominant species | Borale (n = 20) | ||
|---|---|---|---|---|---|
| Total BBS cover (average) | F | Total BBS cover (average) | F | ||
| Geranium dissectum (gedi) | 117 (5.85) | 18 | Geranium dissectum | 102 (5.1) | 17 |
| Eleocharis marginatum | 105 (5.25) | 14 | Eleocharis marginatum | 102 (5.1) | 15 |
| Pennisetum thunbergii | 103 (5.15) | 19 | Pennisetum thunbergii | 102 (5.1) | 17 |
| Cyperus fischeranus | 101 (5.05) | 14 | Cyperus fischeranus | 97 (4.85) | 16 |
| Andropogon abyssinica | 93 (4.65) | 19 | Andropogon abyssinica | 88 (4.4) | 16 |
| Eleusine floccifolia | 91 (4.55) | 18 | Snowdenia petitiana | 77 (3.85) | 13 |
| Ludwigia stolonifera | 87 (4.35) | 12 | Eleusine floccifolia | 76 (3.8) | 15 |
| Snowdenia petitiana | 71 (3.55) | 11 | Rumex nepalensis | 65 (3.25) | 15 |
| Carduus nyassanus | 34 (1.7) | 7 | Trifolium decorum | 60 (3.0) | 11 |
| Argemone mexicana | 33 (1.65) | 6 | Medicago polymorpha | 60 (3.0) | 11 |
| Rumex nepalensis | 32 (1.6) | 12 | Ludwigia stolonifera | 58 (2.9) | 7 |
| Pennisetum setaceum | 32 (1.6) | 7 | Carduus nyassanus | 58 (2.9) | 11 |
| Conyza bonariensis | 32 (1.6) | 11 | Persicaria amphibia | 57 (2.85) | 8 |
| Trifolium decorum | 29 (1.45) | 6 | Trifolium quaritianum | 45 (2.25) | 8 |
| Pennisetum sphacelatum | 29 (1.45) | 6 | Alchemilla abyssinica | 42 (2.1) | 7 |
3.3. Indicators and Characteristic Species of Wetlands
Looking at the wetland indicator species, the Borale site had the highest abundance in FU category (15 species) and OU category (19 species). This trend continued at the Washa site, where FU species (14) and OU species (13) were again the most common. However, the OW category, which typically thrives in healthy aquatic environments, had the fewest species in both locations. Only 4 species were found in Washa and 6 in Borale. This low number suggests a potential ecological disturbance in these two reservoirs. To summarize the findings, the Washa and Borale sites had a relatively low percentage of wetland indicator species (OW + FW)—14 (27.45%) and 19 (29.68%), respectively.
Conversely, upland indicator species (FU + OU) were much more prevalent, with Washa at 27 (52.94%) and Borale at 34 (53.12%) (Table 3).
| Indicator status | Washa site | Borale site |
|---|---|---|
| OW | 4 | 6 |
| FW | 10 | 13 |
| F | 10 | 11 |
| FU | 14 | 15 |
| OU | 13 | 19 |
| Wetland species (OW and FW) | 14 (27.45%) | 19 (29.69%) |
| Upland species (FU and OU) | 27 (52.94%) | 34 (53.12%) |
| Total | 51 | 64 |
- Abbreviations: F, facultative; FU, facultative upland; FW, facultative wetland; OU, Obligate upland; OW, obligate wetland.
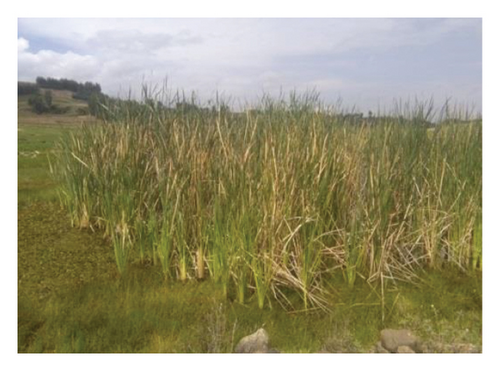
The Washa site revealed ten characteristic (unique) plant species, including Persicaria decipiens (R.Br.) K.L.Wilson, Cyperus pauper Rochat. exA. Rich., Cyperus brevifolius (Rottb.) Hassk, and Commelina diffusa Burm.f (Table 4). These species are mostly growing in relatively healthy aquatic ecosystems. In contrast, the Borale site contained 23 characteristic species, some of which were Typha latifolia L., Guizotia scabra (Yis.) Chiov., Plectranthus punctatus (Lf) L ′Her., Rumex abyssinicus Jacq, and Sida schimperiana Hochst. ex A. Rich (Table 4). These species, however, are more commonly found in ecologically impaired sites. In total, the study identified 33 characteristic plant species across both sites (Table 4). Notably, 90.9% of these were native species, and 54.54% were perennials. Interestingly, 41 species (or 55.4%) were common to both wetlands (Appendix C, Table 5). While examining the wetland indicator categories of these characteristic species, a surprising trend emerged. Over half (57.57%) were classified as upland species (occurring in drier areas or at the fringe of wetlands). OW species and FW species comprised only 39.39%, suggesting a potential ecological disturbance in both reservoirs.
| Washa site’s characteristic species | Native | Life cycle | Indicators |
|---|---|---|---|
| Anthemis tigreensis J. Gay ex A. Rich. | Yes | P | OU |
| Commelina diffusa Burm.f. | Yes | P | FW |
| Cyperus brevifolius (Rottb.) Hasskn | Yes | P | FU |
| Cyperus pauper Rochat. exA. Rich. | Yes | A | OW |
| Emilia leptocephala (Mattf.) C. Jeffrey | Yes | A | FU |
| Galium acrophyum Hochst. ex | Yes | P | FW |
| Persicaria decipiens (R.Br.) | Yes | A | OW |
| Senecio myriocephalus Sch. Bip. ex A. Rich. | Yes | P | OU |
| Taraxacum officinale Webber ex Wiggers | No | P | OU |
| Thymus schimperi Ronniger | Yes | P | OU |
| Borale site’s characteristic species | |||
| Cyanotis barbata D.Don | Yes | A | FW |
| Cyperus elegantulus Steud. | Yes | A | OW |
| Epilobium hirsutum L. | No | A | OW |
| Ferula communis L. | Yes | A | OU |
| Guizotia scabra | Yes | A | OU |
| Helichrysum stenopterum DC. | Yes | P | OU |
| Inula confertiflora A. Rich. | Yes | P | FU |
| Juncus effuses L. | Yes | A | FW |
| Kniphofia foliosa Hochst. | Yes | A | OU |
| Laggera tomentosa | Yes | P | OU |
| Ludwigia abyssinica | Yes | P | OW |
| Medicago lupulina L. | Yes | A | OU |
| Orobanche minor Smit | Yes | A | FU |
| Peucedanum mattirolii Chiov. | Yes | P | FW |
| Plectranthus punctatus (Lf) L′Her. | Yes | A | FW |
| Rumex abyssinicus | Yes | A | OU |
| Salix subserrata Willd. | Yes | P | FW |
| Sida schimperiana Hochst. ex A. Rich | Yes | P | FU |
| Snowdenia polystachya (Fresen.) Pilg. | Yes | A | OU |
| Sphaeranthus suaveolens var. abyssinica (Forssk.) DC | Yes | P | OU |
| Typha latifolia L. | No | P | OW |
| Verbena officinalis L. | Yes | P | OU |
| Zehneria minutiflora (L.f.) Sond. | Yes | P | FW |
- Abbreviations: A, annual; B, biannual; F, facultative; FU, facultative upland; FW, facultative wetland; OU, obligate upland; OW, obligate wetland; p, perennial.
| Indicator status | In both sites |
|---|---|
| OB | 2 |
| FW | 8 |
| F | 10 |
| FU | 12 |
| OU | 9 |
| Wetland plant species (OB and FW) | 10 (24.39%) |
| Upland plant species (FU and OU) | 21 (51.22%) |
| Total | 41 |
A total of 41 (55.4%) common plant species were found in both wetlands. These common species were primarily native (92.68%) and annuals (56.1%) (Appendix C). Perennials made up a smaller portion (17 species, 41.46%), and only one species (2.44%) was biannual. An analysis of these shared plants revealed insights into the wetlands’ health. Over half (51.22%) were upland plant indicators (FU + OU), suggesting alterations to the original wetland habitat. In contrast, only a quarter (24.39%) were wetland indicators (OB + FW), typically associated with healthy aquatic ecosystems. Another quarter (24.39%) were classified as F), meaning they can tolerate both wet and dry conditions. The high number of upland plants suggests ecological disturbance in the wetlands. This indicates potential changes in water levels or habitat modifications that have pushed the ecosystems toward a drier state.
3.4. Ecosystem Condition
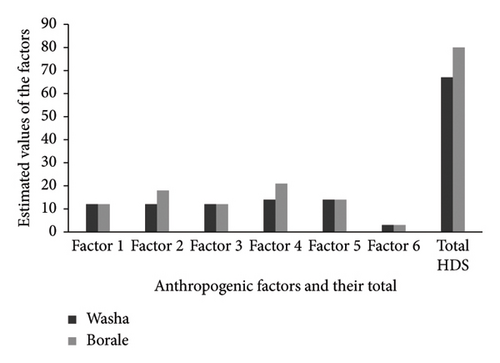
The two created wetlands were unlike in their severity of vegetative, habitat, and hydrological changes. Based on the survey made using HDGS format (Appendix A) and field checklist, the HDGS value of each factor for the Washa site was ranged from 3 to 21 and the same thing for the Borale site (Figure 4). For example, the HDGS of landscape disturbance within 500-m radius (Factor 2) was 12 and 18 for Washa and Borale sites, since their landscapes are nearly and all filled with human uses, respectively (Appendix D, Figure 4). However, the buffer landscapes within 50-m radius of the two reservoirs were fair and scored the same vale (12) (Factor 1) of Figure 4. Compared with other factors, hydrological change (Factor 4) and chemical pollution (Factor 5) were high in both wetlands, but higher in landscape disturbance (Factor 2) in Borale site (Figure 4) due to extensive anthropogenic activities such as grazing, farming, urbanization, cattle watering, and water extraction for irrigation, besides the intrusion of cattle, domestic, and urban wastes and other inputs like silts and fertilizers to the reservoirs with floods. Moreover, since fish and birds are found in both reservoirs, they scored the same value of three (Factor 6). Accordingly, the total values of HDGS of Washa and Borale sites were 67 and 80, and belonged to mid- and most impacted wetlands, respectively (Figure 4).
4. Discussion
The present study was carried out in two human-made wetlands, Washa and Borale, situated in the North Shewa Zone highlands of Central Ethiopia. Based on the findings of this study, the floristic composition, diversity, wetland indicators, and characteristic species were discussed. Additionally, the dominant plant taxa and the overall ecological health (ecological condition) of the wetlands were debated as follows.
4.1. Plant Species Composition
As the results revealed, 74 different plant species identified from 26 plant families from the study area. This supports the idea that wetlands are crucial for protecting biodiversity [6]. Interestingly, even though the wetlands were disturbed by human activities, this created a variety of microhabitats that provided suitable conditions for many plant species to grow, leading to the high plant diversity observed. Handa et al. [38] and Moges et al. [11] also found that human disturbances in ecosystems can create new microhabitats, favoring the establishment of invaders or upland plant species through replacing native aquatic plants.
Regarding the families, Asteraceae and Poaceae were the most common, making up over a third of the total plant species. This finding aligns with similar studies in Ethiopia by Moges et al. [5] and Uganda by Odull and Byaruhanga [39]. These two dominant families also contained a significant portion of the total plant genera. Lamiaceae, Commelinaceae, and Apiaceae were the next most abundant families. This suggests that these dominant and codominant families are better adapted to disturbed wetlands compared to other plant families. This is likely because the wetlands in our study area were rated as moderately and highly impacted by human activities such as drainage, farming, and pollution.
These disturbances can modify the water flow and overall health of the wetland, creating new microhabitats that favor the growth of both native and non-native plants, including some resistant aquatic species. However, these disturbances can also lead to the decline or disappearance of sensitive plant species. As a result, the remaining 16 plant families only contributed a small portion of the total species and genera found in the wetlands.
When comparing the two study sites, Borale Wetland had a higher number of plant families than Washa Wetland. This difference is likely due to the higher level of disturbance in Borale. This finding is similar to previous research types conducted in southwestern highlands of Ethiopia by Mulatu et al. [20] and Moges et al. [5], who reported that disturbed wetlands in Ethiopia tend to have more plant species than undisturbed ones.
Despite unlike in their extent of their ecological disturbances and number of taxa, the two wetlands had common physiognomies in their climate (moisture and temperature) and were located in the same ecological zone. This resulted in over half of the plant families (∼54%) being common to both sites. Climate and altitude are likely the most important factors determining which plant species can grow in these wetlands.
Finally, this study found that the wetlands primarily consisted of herbaceous plants (∼92%), followed by shrubs (∼7%), and climbers (∼1). This is likely due to the frequent human activities around the wetlands, such as farming and grazing. This is likely due to the frequent human activities around the wetlands, such as farming, grazing, water extraction for irrigation, and settlement, which may have removed larger plants like trees and shrubs. Additionally, wetlands with surface or shallow subsurface water tend to support more herbaceous plants than other plant types. This finding is consistent with previous studies by Mulatu et al. [20] and Moges et al. [5].
4.2. Plant Diversity, Dominant, and Similarity of Plant Species in Wetlands
The scientists used various methods to evaluate the richness and spread of plant life across each wetland. Richness is an apt measure of diversity, and the richness of a range of habitats (of both wetlands) is also termed as gamma diversity, but the average richness is called beta diversity [40]. Yet, the total number of species per wetland site is called alpha diversity [41]. Thus, besides Shannon diversity and evenness, the species richness (S) is the most repeatedly used index [42] for comparing the diversity between sites (wetlands) [43], as discussed as follows.
4.2.1. Species Richness
This refers to the total number of plant species found in an area. The study found a high overall richness (gamma diversity) of 74 plant species across the entire study area. Within individual plots (2 square meters), the richness ranged from 8 to 20 species, with an average of 14.55 species per plot. This indicates a relatively high number of plant species per square meter compared to other land-use systems. Still, there were the variations in species richness (alpha diversity) and beta diversity between Washa and Borale wetlands. These all indicated that Borale supported more species than Washa. Murillo-Pacheco et al. [44] also reported similar findings that in aquatic plants, there are marked differences in alpha diversity among all study sites.
4.2.2. Shannon Diversity and Evenness
These indices consider both the number of species and their relative abundance, while both wetlands showed moderate diversity and high evenness (uniform distribution of species). However, based on the nonparametric U-test, Borale had a significantly higher Shannon diversity index (H′ = 2.53) and evenness (J = 0.96) compared to Washa (H′ = 2.32 and J = 0.93) at p value < 0.05. This suggests a greater diversity and evenness distribution of plant species in Borale than Washa sites. The researchers attributed this difference to the higher human impact on the Borale site, which could be due to the extent of variations of the anthropogenic activities taking place in and around the two study sites. This is because wetlands in nature are dynamic ecosystems; there are always ecological changes or disturbances in wetlands due to anthropogenic activities [6]. Connell [45] and Moges et al. [5] also reported that environmental disturbance, heterogeneity, and competitive exclusive processes are also the determinant factors, resulting in increasing their diversity. Generally, diversity patterns seem to be driven by high landscape heterogeneity and wetland management.
4.2.3. Comparison With Natural Wetlands
Interestingly, the human-made wetlands in this study exhibited higher plant diversity than natural wetlands in other parts of Ethiopia. For instance, the natural wetlands such as Haro, Agaro, Bonchie, and Duda [5] and another nonagricultural impacted wetland [20] from the southwestern parts of Ethiopia were less rich in species than the present artificial wetlands. Similar studies in the United States [18] and others (Florida and Australia) [10] confirmed that artificial wetlands supported a greater diversity of plant and bird species than their natural counterparts, respectively. Overall, the study highlights the interesting phenomenon of human-made wetlands sometimes harboring a greater variety of plant life compared to natural ones. However, it is important to note that many of these species might be invaders introduced by human activity. Maintaining a balance between promoting plant diversity and managing invasive species is crucial for sustainable wetland management.
4.2.4. Dominant Species and Similarity
The species E. marginatum, C. fischerianus, L. stolonifera, P. thunbergii, and G. dissectum were the most common dominant species in the two wetlands, besides other common, but nondominant species. Thus, this study identified several common plant species present in both Washa and Borale, indicating more similarity in their plant communities. This finding was further confirmed by a statistical analysis of SSC showing a 71% similarity in species composition between the two wetlands. Barbour et al. [46] also reported that any two plant communities have more than 50% similarity showed the same association. Additionally, Kent and Coker [47] and Kent [35] stated that a comparison is made between all pairs of quadrats of a study area, or between two sites, a similarity or dissimilarity matrix is produced. Thus, based on this general rule, the Washa and Borale sites had similarities in their plant composition, but dissimilarity between the natural [2, 48] and the present human-made settings.
4.3. Indicators, Characteristics, and Common Species of Wetlands
Evaluating individual plant species as indicators of the physical environment in wetlands is currently becoming one of the means to show the ecological condition of wetlands. According to Lawton and Gaston [49], a group of wetland indicators that reflect the abiotic or biotic state of an environment provide evidence for environmental change. Accordingly, as revealed in the results, the majority of the plant species identified from the whole study area was upland indicators (21, 51.22%), whereas the wetland indicators were smaller in number (10, 24.39) (Table 5). Even while considering each wetland indicator species (Table 3), many species of Washa (52.94%) and Borale (53.12%) were uplands, indicating the two wetlands’ ecosystem disturbance, particularly the Borale’s one. As also described here, in the characteristic and common species of wetlands, many of them were upland indicators, implying hydrological and ecosystem changes of the studied wetlands.
The characteristic species are species that characterize the specific site or habitat being unique to only that of other sites of the study area. Thus, 10 characteristic species were identified from Washa site, of which Persicaria decipiens, Cyperus pauper, Cyperus brevifolius, and Commelina diffusa were chiefly unique and wetland indicators of Washa, and relatively showed good health condition of the wetland. Contrarily, of the 23 characteristic species identified from Borale Wetland, the plant species including T. latifolia, L. tomentosa, Guizotia scabra, Plectranthus punctatus, Rumex abyssinicus, and Sida schimperiana are considered as good indicators of ecosystem disturbance. Moreover, some of these characteristic plants such as T. latifolia and Emilia leptocephala (Mattf.) C. Jeffrey are indicators of water pollution. As also reported by Moges et al. [5] from Jimma highlands, Boye human-made wetland was highly impaired and invaded by T. latifolia (and Emilia leptocephala). In contrast, from the total characteristic species (33), 90.9% and 54.54% were native and perennials, respectively. This indicates the potentiality of the study sites to be restored, if a good management of the sites is made in the future.
Additionally, 55.4% species were found in both Washa and Borale wetlands, of which 92.68% and 56.1% were native and annual species, respectively, and 24.39% and 51.22% were wetland and upland indicator species, respectively. This also indicates that the majority of indicator species growing in both wetlands were uplands, which might be due to their ecosystem disturbance/changes that could be suitable for growing native upland species invasively (randomly). This finding is in line with Thompson et al. [37]. These all also imply that the invasion of/exotic/alien species in the study sites was very low; however, due to their ecosystem disturbances, many of the aquatic plants were replaced by native and annual upland invaders. Still, those OB, FW, and F characteristic species together represent about 41%, which grow and easily adapt the wetland ecosystems, and which indicate the restoration potential of the wetlands.
4.4. Ecosystem Condition of Wetlands
Finally, based on the assessment made in and around the study sites using the protocol of Gernes and Helgen [33], besides the field checklist, both wetlands, particularly Borale, were impaired due to the anthropogenic activities such as farming, grazing, cattle watering, water extraction for irrigation, and entry of other inputs to the reservoirs with floods. Thus, Borale Wetland was higher disturbed than Washa one. This might be owing to Washa Wetland’s buffer zone, relatively covered with grasses up to 50-m radius, despite farming in between. Additionally, the parts of the catchment of this wetland were nontilled land compared to Borale site. However, owing to free grazing in the catchment including the buffer zone of the Washa site, the water quality was relatively poor than the Borale’s one. Hence, the two study sites were different depending on the extent and severity of their habitat, vegetation, and hydrological alterations; buffer and upper catchment landscapes; and chemical stressors. The analysis of plant indicators also showed that the majority of the two sites’ species were upland indicators due to habitat and hydrological modifications, resulting in the replacement of aquatic plants with upland species. Generally, the changes of the landscape and land size of wetlands are indicators of ecological degradation [50], besides wetland indicator status [31, 36, 51].
5. Conclusions
Seventy-four plant species were identified and documented from two human-made wetlands located in Central Ethiopia. Asteraceae and Poaceae were the most dominant families, and 90% of the plant species were herbaceous. The species most dominant species growing in the two wetlands also include E. marginatum, C. fischerianus, L. stolonifera, P. thunbergii, and G. dissectum, indicating the similarity of the two wetlands in their plant species composition. However, despite rich the two wetlands in their plant biodiversity, their values of the Shannon diversity indices showed significant differences between Borale and Washa sites. That is, Borale is richer than Washa site due to the higher heterogeneity of Borale than Washa sites as a result of extensive anthropogenic activities. Additionally, the two wetlands largely supported the native, but upland plant species indicators considered as native invaders due to unplanned human activities, resulting in hydrological and habitat modifications of the two wetlands. These modifications, in turn, led to the similarity of the most dominant species growing in the two sites despite supporting some unique species at each site. Moreover, the ecological assessment of the two wetlands showed that both of them were impaired, but more severity of the Borale site. The implication of all the findings is that if not appropriate measures are taken soon, both wetlands, especially Borale site, would reach unrestored conditions. Therefore, the present study is very vital in providing an inclusive biodiversity and ecosystem condition of the two wetlands to the local stakeholders and decision-makers as well as to other scholars and readers in understanding the fast mechanisms of evaluating the overall status of aquatic ecosystems. Consequently, to ensure a long-term conservation of biodiversity and sustainable use of wetlands, it is urgent and essential to develop and implement professional and community participatory-led restoration strategic plans that take both sites and their catchments into consideration.
Conflicts of Interest
The authors declare no conflicts of interest.
Author Contributions
Admasu Moges proposed and designed the research project and wrote the manuscript. However, material preparation, data collection, species identification, and analysis were performed by both Admasu Moges and Abyot Dibaba. Both authors commented read and approved the final manuscript.
Funding
This work was supported by Debre Berhan University (DBU) (Grant No. 386-03-01). The author, Admasu Moges, has received the research support from DBU. The authors declare that no funds or other support were received during the preparation and for publication of this manuscript.
Acknowledgment
We are grateful to Debre Berhan University for their financial support of this research project. We would also like to express our appreciation to all participants involved in data collection, as well as the experts from the Urban Agricultural Office and the 01 Kebele administrative bodies of Debre Birhan Town for their assistance in facilitating data collection and providing access to relevant documents.
Supporting Information
Additional supporting information can be found online in the Supporting Information section.
Appendix A: Rating Form of Wetlands for the Human Disturbance Gradient Scores (HDGS)
| Factor 1. Buffer landscape disturbance (within 50 m from wetland edge) | |
|---|---|
| Extent and intensity | Points |
| Best—no evidence of disturbance (called reference site) | 0 |
| Moderate—some human use influence | 6 |
| Fair—significant human influence, buffer area nearly filled with human use | 12 |
| Poor—nearly all or all of the buffer human use (intensive land use) | 18 |
| Factor 2. Landscape disturbance (within 500-m landscape wetland edge) | |
| Extent and intensity | Point |
| Best—landscape natural (no evidence of disturbance) | 0 |
| Mod.—predominately undisturbed, some human use influence | 6 |
| Fair—landscape area nearly filled with human use | 12 |
| Poor—nearly all or all of the landscape in human use | 18 |
| Factor 3: Habitat alteration and activities (within and beyond the buffer) | |
| Severity and extent of alteration | Point |
| Best—no evidence of disturbance (called reference site) | 0 |
| Mod.—Low-intensity alteration or past alteration that is not currently affecting wetland | 6 |
| Fair—highly altered, but some recovery if previously altered | 12 |
| Poor—almost no natural habitat present, highly altered habitat | 18 |
| Factor 4. Hydrologic alteration (within the wetland) | |
| Severity and degree of alteration | Point |
| Best—no evidence of disturbance (called reference site) | 0 |
| Moderate—low-intensity alteration or past alteration that is not currently affecting wetland | 7 |
| Fair—less intense than “poor,” but current or active alteration | 14 |
| Poor—currently active and major disturbance to natural hydrology | 21 |
| Factor 5. Chemical pollution (TN, TP, and Cl from water sample) | |
| Severity and degree of pollution | Point |
| Best—no evidence of chemical input (called reference site) | 0 |
| Moderate—selected chemical data in low range, little, or no evidence of chemical input | 7 |
| Fair—selected chemical data in midrange, high potential for chemical input | 14 |
| Poor—chemical input is recognized as high, with a high potential for biological harm | 21 |
| Factor 6. Additional concerns: Maximum of 4 additional points added to the cumulative disturbance total (0–4 points). | |
- Note: Source: Genes and Helgen (2002).
Appendix B: A List of Plant Species Identified from Borale (B) and Washa (W) Wetlands (Collected From September 2020 to March 2021)
| Scientific name | Local name (narratives) | Family name | Habit | Site | Voucher number |
|---|---|---|---|---|---|
| Agrocharis melanantha Hochst. | Karot mesay | Apiaceae | Herb | B, W | AA07 |
| Alchemilla abyssinica | Yemidir Kosso | Rosaceae | Herb | B, W | AA61 |
| Andropogon abyssinica | Gaja | Poaceae | Herb | B, W | AA11 |
| Anthemis tigreansis | White flower | Asteraceae | Herb | W | AA54 |
| Argemone mexicana L. | Yahiya suf/Kosheshila | Papaveraceae | B, W | AA67 | |
| Artemisia abyssinica Sch. Bip. exA. Rich. | Chiqugn | Asteraceae | Herb | B, W | AA51 |
| Bidens macroptera (Sclt. Bip. ex Chiav.) Mesfin | Adey abeba | Asteraceae | Herb | B, W | AA01 |
| Bidens rueppellii (Sch. Bip. ex Walp.) Sherf | Adey abeba mesay | Asteraceae | Herb | B, W | AA72 |
| Carduus nyassanus (5. Moore) R.E. Fr. | Kosheshila tinshua | Asteraceae | Herb | B, W | AA40 |
| Cheilanthes coriacea | Fern | Sinopteridaceae | Herb | B, W | AA09 |
| Commelina benghalensis | Wuha anqur (yellow flower) | Commelinaceae | Herb | B, W | AA58 |
| Commelina diffusa Burm.f. | Wuha anqur (with yellow flower) | Commelinaceae | W | AA71 | |
| Conyza bonariensis (L.) Cronq. | (Small ball yellow flower) | Asteraceae | Herb | B, W | AA49 |
| Cyanotis barbata D.Don | (Wuha ankur mesay) | Commelinaceae | Herb | B | AA26 |
| Cynodon dactylon | Serido | Poaceae | Herb | B, W | AA03 |
| Cyperus alatus | Engecha tinshua | Cyperaceae | Herb | B, W | AA27 |
| Cyperus brevifolius (Rottb.) Hasskn | Mush-3 | Cyperaceae | Herb | W | AA66 |
| Cyperus elegantulus | Dengaro | Cyperaceae | Herb | B | AA19 |
| Cyperus esculentus L. | Engecha-3 | Cyperaceae | Herb | B, W | AA65 |
| Cyperus fischeranus | Engecha | Cyperaceae | Herb | B, W | AA25 |
| Cyperus pauper Rochat. exA. Rich. | Qetema | Cyperaceae | Herb | W | AA64 |
| Eleocharis marginatum | Mush | Cyperaceae | Herb | B, W | AA20 |
| Eleusine floccifolia (Forssk.) Spreng. | Akrima | Poaceae | Herb | B, W | AA23 |
| Emilia leptocephala (Mattf.) C. Jeffrey | Gomen mesay | Asteraceae | Herb | W | AA74 |
| Epilobium hirsutum L. | With red flower | Onagraceae | Herb | B | AA29 |
| Eragrostis braunii Schweinf. | Sar (with black fluorescence) | Poaceae | Herb | B, W | AA63 |
| Eragrostis cilianensis | Sar | Poaceae | Herb | B, W | AA16 |
| Eriochloa fatmensis | Sar | Poaceae | Herb | B, W | AA53 |
| Ferula communis L. | Dog | Apiaceae | Herb | B | AA39 |
| Galium acrophyum | Ashkt mesay | Rubiaceae | Herb | W | AA60 |
| Geranium dissectum L | Yemid koso | Geraniaceae | Herb | B, W | AA42 |
| Gladiolus abyssinicus (Brongn. ex Lemaire) Goldblatt & de Vos | (Red gullet flower) | Iridaceae | Herb | B, W | AA48 |
| Gnaphalium americanum Mill. | Nechilo mesay | Asteraceae | Herb | B, W | AA17 |
| Guizotia scabra (Yis.) Chiov. | Mechi | Asteraceae | Herb | B | AA44 |
| Helichrysum stenopterum DC. | Helic (yellow flower) | Asteraceae | Herb | B | AA22 |
| Inula confertiflora A. Rich. | Woynagifit (woody) | Asteraceae | Shrub | B | AA45 |
| Juncus effuses L. | Qetema | Juncaceae | Herb | B | AA18 |
| Kniphofia foliosa Hochst. | Yejib shinkurt | Asphodelaceae | Herb | B | AA52 |
| Kniphofia thomsonii Hochst. | Seliti mesay (Pink flower) | Asphodelaceae | Herb | B, W | AA57 |
| Laggera tomentosa (Sch. Bip. ex A. Rich.) Oliv. & Hiern | Keskeso | Asteraceae | Shrub | B | AA10 |
| Ludwigia abyssinica | Dodot-1 | Onagraceae | Herb | B | AA33 |
| Ludwigia stolonifera (Guill. & Perr.) Raven | Onagraceae | Herb | B, W | AA34 | |
| Medicago lupulina L. | Wajima (trifoliate, yellow flower) | Fabaceae | Herb | B W | AA56 |
| Medicago polymorpha L. | Wajima (yellow flower, 3 leaflet) | Fabaceae | Herb | B, W | AA15 |
| Melinis repens Willd Zizka | Qechin serido | Poaceae | Herb | B, W | AA70 |
| Ocimum forskolei Benth. | Tolelas | Lamiaceae | B, W | AA12 | |
| Ocimum sp. | Lomishet | Lamiaceae | Herb | B, W | AA06 |
| Orobanche minor Smit | Sata yejib-ras | Orobanchaceae | Herb | B | AA30 |
| Pennisetum setaceum | Sar (Titi mesay) | Poaceae | Herb | B, W | AA37 |
| Pennisetum sphacelatum | Sindedo/sebez | Poaceae | Herb | B, W | AA02 |
| Pennisetum thunbergii Kunth | Ye-wusha sar | Poaceae | Herb | B, W | AA24 |
| Persicaria decipiens (R.Br.) K.L.Wilson | Polygonaceae | Herb | W | AA62 | |
| Persicaria amphibia (L.) S.F. Gray | Polygonaceae | Herb | B, W | AA28 | |
| Peucedanum mattirolii | Insilal mesay | Apiaceae | Herb | B | AA13 |
| Plantago lanceolata L | Worteb | Plantaginaceae | Herb | B, W | AA04 |
| Plectranthus punctatus (Lf) L ′Her. | Dembo | Lamiaceae | Herb | B | AA38 |
| Rumex abyssinicus | Meqimeqo | Polygonaceae | Herb | B | AA36 |
| Rumex nepalensis Spreng | Tult | Polygonaceae | Herb | B, W | AA73 |
| Salix subserrata Willd. | Wonz admiq | Salicaceae | Shrub | B | AA08 |
| Salvia nilotica Jacq. | Hulegeb | Lamiaceae | Herb | B, W | AA35 |
| Senecio myriocephalus Sch. Bip. ex A. Rich. | Asteraceae | Shrub | W | AA69 | |
| Sida schimperiana Hochst. ex A. Rich | Chifrig | Malvaceae | Shrub | B | AA43 |
| Snowdenia petitiana (A. Rich) C. E. Hubb | Muja (qey) sar | Poaceae | Herb | B, W | AA41 |
| Snowdenia polystachya | Muja (with 3–5 spikelets) | Poaceae | Herb | B | AA47 |
| Sphaeranthus suaveolens var. abyssinica (Forssk.) DC | Dodot-2 (violet spikes) | Asteraceae | Herb | B | AA32 |
| Taraxacum officinale Webber ex Wiggers | Gomen mesay (lobed leaf, yellow flower) | Asteraceae | Herb | W | AA59 |
| Thymus schimperi Ronniger | Tosign | Phytolaccaceae | Herb | W | AA68 |
| Trifolium decorum Chiov. | Maget (violet flower) | Fabaceae | Herb | B, W | AA14 |
| Trifolium quartinianum L. | Maget (tinishu) | Fabaceae | Herb | B, W | AA50 |
| Typha latifolia L. | Fila | Typhaceae | Herb | B | AA31 |
| Verbascum sinaiticum Benth. | Yahiya jero | Scrophulariaceae | Herb | B, W | AA21 |
| Verbena officinalis L. | Seliti mesay | Verbenaceae | Herb | B | AA46 |
| Veronica persica Poiret | Blue flower | Scrophulariaceae | Herb | B, W | AA55 |
| Zehneria minutiflora (L.f.) Sond. | Yait hareg | Cucurbitaceae | Climber | B | AA05 |
| Some of the plant species found in the catchment of the study area, but not in sampling sites | |||||
| Buddleja polystachyum | Anfar | Asteraceae | Tree | B | |
| Cupressus lusitanica | Ye-ferenji Tsid | Cupressaceae | Tree | W | |
| Echinops kebericho Mesfin | Kebericho | Asteraceae | Shrub | B | |
| Eucalyptus globules | Nech bahir zaf | Myrtaceae | Tree | B, W | |
| Hagenia abyssinica | Kosso | Rosaceae | Tree | W | |
| Juniperus procera | Ye-abeshs Tsid | Cupressaceae | Tree | W | |
| Sesbania sesban | Turmatur | Fabaceae | Shrub | W | |
Appendix C: Plant Species Growing in Both Wetlands With Their Nativity, Life Cycle and Indicators
| Botanical names | Native | Life cycle | Wetland indicators |
|---|---|---|---|
| Agrocharis melanantha | Yes | P | Up |
| Alchemilla abyssinica | Yes | P | F |
| Andropogon abyssinica | Yes | A | FU |
| Argemone mexicana | No | A | F |
| Artemisia abyssinica | Yes | A | F |
| Bidens macroptera | Yes | A | F |
| Bidens rueppellii | Yes | A | F |
| Carduus nyassanus | Yes | P | F |
| Cheilanthes coriaceae | Yes | P | FU |
| Commelina benghalensis | Yes | P | F |
| Conyza bonariensis | Yes | A | Up |
| Cyndon dactylon | Yes | P | Up |
| Cyperus esculentus | Yes | A | FW |
| Cyperus alatus | Yes | P | FW |
| Cyperus fischeranus | Yes | P | FW |
| Eleocharis marginatum | Yes | P | OW |
| Eleusine floccifolia | Yes | P | Up |
| Eragrostis braunii | Yes | P | Up |
| Eragrostis cilianensis | Yes | A | F |
| Eriochloa fatmensis | Yes | A | FU |
| Geranium dissectum | No | A | F |
| Gladiolus abyssinicus | Yes | A | F |
| Gnaphalium americanum | Yes | A | Up |
| Kniphofia thomsonii | Yes | P | FW |
| Ludwigia stolonifera | Yes | P | OW |
| Medicago polymorpha | Yes | A | Up |
| Melinis repens | Yes | A | FU |
| Ocimum forskolei | Yes | A | FU |
| Ocimum sp. | Yes | P | FU |
| Pennisetum setaceum | Yes | A | FU |
| Pennisetum sphacelatum | Yes | A | FU |
| Pennisetum thunbergii | Yes | A | FU |
| Persicaria amphibia | Yes | P | FW |
| Plantago lanceolata | Yes | A | FU |
| Rumex nepalensis | Yes | P | Up |
| Salvia nilotica | Yes | P | FU |
| Snowdenia petitiana | Yes | A | FW |
| Trifolium decorum | Yes | A | FW |
| Trifolium quartinianum | Yes | A | FW |
| Verbascum sinaiticum | Yes | B | Up |
| Veronica persica | No | A | FU |
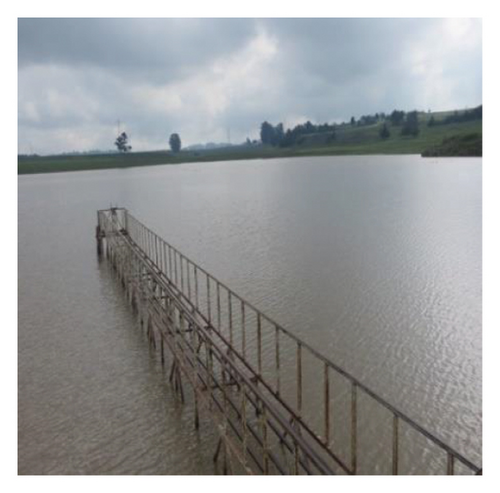
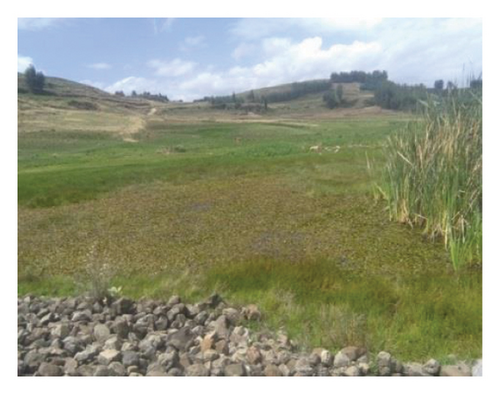
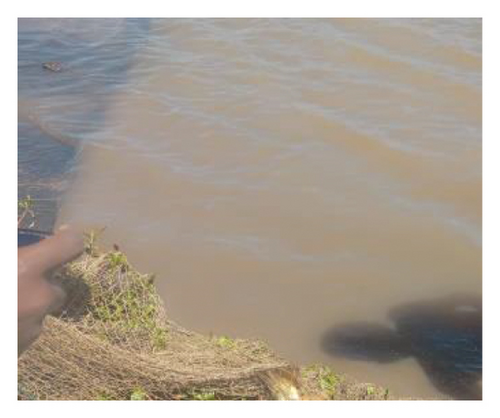
Appendix D: Photos Illustrating Birds in and Around (a) and (b) and Fish (d) and (e) With Fish Net (i), Eucalyptus and Cupressus trees, and New Settlement in the Catchment of Washa (a) and (c), and the Downstream Vegetation Like Cyperus and Typha spp. (g) and (h) of Borale Reservoir (f)
Open Research
Data Availability Statement
The datasets generated during the current study are available in the appendix section as well as in a file of an Excel format, uploaded to this journal with this manuscript.


