Spatial Distribution of Low Birth Weight and Factors Associated With Birth Weight Among Live Births in the 2 Years Before the Survey in Jordan 2023 Using the Log-Gamma Mixed-Effect Model
Abstract
Introduction: Low birth weight (LBW), defined by the WHO as a birth weight under 2500 g, is a significant risk factor for perinatal death, health issues, and an increased risk of chronic diseases in adulthood. The purpose of this study was to examine the geographic distribution of LBW and identify the factors influencing birth weight in Jordan.
Method: This study analyzed secondary data from the 2023 Jordan Population and Family Health Survey, including 4886 neonates. Spatial autocorrelation was used to examine the clustering of LBW cases, while spatial scan statistics and ordinary kriging interpolation helped identify local hotspots and predict high-risk areas. A log-gamma mixed-effects model assessed individual and community-level factors linked to LBW. The Global Moran’s I test was applied to determine if LBW patterns in Jordan were randomly distributed, spread out, or clustered. Adjusted rate ratio (ARR) with 95% confidence intervals was reported for the log-gamma model.
Results: LBW was spatially clustered in Jordan. Hotspot areas (clusters with high frequencies of LBW) were observed in the Rabid, Ajloun, Jarash, and borders of the Mafraq regions of Jordan. Neonates who were born from primary education (ARR = 0.786, 95% CI: 0.721–0.856) and secondary education and above (ARR = 0.814, 95% CI: 0.755–0.878), women with normal weight (ARR = 0.899, 95% CI: 0.829–0.976), women with one child (ARR = 0.442, 95% CI: 0.287–0.680), women with two children (ARR = 0.450, 95% CI: 0.293–0.693), women with three or more child (ARR = 0.442, 95% CI: 0.287–0.679), women with multiple births (ARR = 0.806, 95% CI: 0.752–0.864), women delivered by caesarean section (ARR = 0.932, 95% CI: 0.909–0.956), and regions Ma’an, Karak, Irbid, and Mafraq had significantly associated with LBW babies.
Conclusion: This study identifies key factors affecting LBW in Jordan, including maternal education, weight, parity, gender, multiple births, and delivery method. Hotspots of LBW were found in Irbid, Ajloun, Jarash, and Mafraq, highlighting areas for targeted interventions. Regional differences were observed, with Ma’an and Karak showing higher birth weights, while Irbid and Mafraq had lower birth weights compared with Amman. These findings stress the importance of region-specific strategies to reduce LBW and enhance maternal and child health in Jordan.
1. Introduction
An infant’s birth weight is the initial weight measured shortly after birth, preferably within the first few hours, before significant weight loss occurs. According to the World Health Organization (WHO), low birth weight (LBW) is defined as a weight of less than 2500 g (up to and including 2499 g) [1]. LBW is a strong indicator of perinatal mortality and health complications, and it also raises the likelihood of developing chronic noncommunicable diseases (NCDs) later in life [2].
LBW is estimated to represent 15%–20% of all births globally, which translates to over 20 million LBW births annually. In total, around 30 million babies are born with LBW each year, making up 23.4% of all births worldwide. South-Central Asia accounts for half of these cases, with 27% of births in the region being under 2500 g. In contrast, LBW rates in sub-Saharan Africa are estimated at around 15% [3]. Over 80% of neonatal deaths occur among LBW newborns in South Asia and Sub-Saharan Africa [4].
The global prevalence of LBW is 14.6%, resulting in 25 million LBW infants born annually. Of these, 95% are born in low- and middle-income countries (LMICs), with South Asia contributing to nearly 52% of the global LBW cases [5].
LBW can result from either preterm birth (before 37 weeks of gestation), being small for gestational age (due to slower growth during pregnancy), or a combination of both factors [6].
Maternal undernutrition, including macronutrient and micronutrient deficiencies, is causally linked with LBW and two of its underlying causes, including preterm births and small for gestational age [7]. Nutrition counseling during pregnancy [8–10], iron/folic acid supplementation during pregnancy, [9, 11], maternal undernutrition [9, 12], maternal anemia [9, 13], inadequate minimum dietary diversity score of women [9, 14], and mothers’ educational attainment and socioeconomic status of living [15] were factors associated with LBW.
Understanding the spatial distribution of LBW and identifying the factors contributing to variations in birth weight is crucial for designing targeted public health interventions [16].
In Jordan, despite significant advancements in healthcare, there are still substantial gaps in maternal and neonatal health outcomes, which may vary by region, socioeconomic factors, and access to healthcare services [17]. Geographic disparities in the incidence of LBW could be influenced by factors such as maternal age, education, socioeconomic status, nutritional intake, and quality of prenatal care [18]. Understanding how these factors contribute to LBW at the regional level can guide policymakers and health authorities in allocating resources more efficiently, especially to underserved areas with higher rates of LBW. Furthermore, identifying specific geographic areas with elevated LBW rates can prompt targeted interventions, such as improving prenatal care access, nutritional support programs, and maternal health education.
This study is significant because it will provide empirical evidence on the regional variation in LBW within Jordan. By addressing these gaps, the study aims to contribute to a better understanding of the broader determinants of LBW in Jordan. Therefore, this study aimed to identify factors associated with LBW and high-risk (hotspot) areas of LBW through spatial analysis.
2. Methodology
2.1. Patient and Public Involvement
This study utilized a publicly accessible dataset (JPFHS 2023), so no patients or members of the public were directly involved.
2.2. Data Source
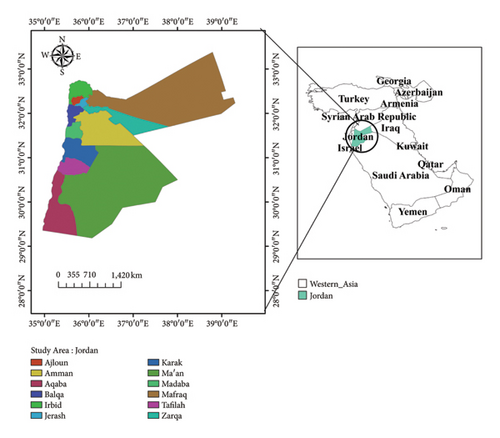
Secondary data analysis was used to explore the spatial distribution of LBW and the factors related to birth weight. Permission to use the data was granted through an authorization letter from Measure DHS, and the dataset was downloaded from their website. https://dhsprogram.com/data/available-datasets.cfm. The survey included all 12 governorates of Jordan (Figure 1).
Participants were chosen using a stratified two-stage cluster sampling method. The survey gathered data from a nationally representative sample of 5585 eligible women across 970 enumeration areas.
Moreover, although the dataset is based on a nationally representative sample, the sampling method used, including stratified two-stage cluster sampling can still result in sampling biases. Variations in data collection methods across different clusters and regions may introduce inconsistencies or errors in the data. These factors should be considered when interpreting the study’s results. For instance, discrepancies in data quality across regions may affect the spatial distribution of LBW and the reliability of findings related to geographic factors.
In addition, measurement errors or inconsistencies in how data were collected (e.g., discrepancies between birth records and maternal recall) could also influence the accuracy of the outcome variable (birth weight). Despite these limitations, sampling weights were applied in the analysis to account for any potential biases in the sampling process, improving the representativeness of the estimates.
Sampling weights were used to adjust for unequal selection probabilities and nonresponse. They ensure the sample accurately represents the population. Weights are calculated by taking the inverse of the selection probability and adjusting for nonresponse. This makes the results more reliable and generalizable to the entire population.
The quality and completeness of the DHS dataset have important implications for the study’s results. The reliance on maternal recall for birth weight, the exclusion of cases with missing data, and potential sampling biases could influence the accuracy of the conclusions drawn. For example, if birth weight data are inaccurate or incomplete, this could lead to misclassification of LBW, affecting the spatial distribution analysis and the identification of factors associated with LBW. In addition, missing data on maternal characteristics or other predictors could result in biased estimates of the factors influencing LBW. While the data are comprehensive, it is crucial to acknowledge these potential limitations in the study, as they may affect the overall findings.
The complete methodology used for data collection in the JPFHS 2023 has been published in another source [19]. This study included 4886 neonates from 939 clusters. Sampling weights were applied in the analysis to ensure accurate and reliable estimates.
2.3. Study Variables
2.3.1. Dependent Variable
The primary outcome of this study was birth weight. Data on birth weight were obtained from mothers who had given birth within the 2 years prior to the survey, either by reviewing birth records or through the mother’s recall of the child’s birth weight. Births without recorded birth weight were excluded. For the mixed-effects model, birth weight was treated as a continuous variable, while for spatial analysis, it was categorized into two groups: normal birth weight (≥ 2.5 kg) and LBW (< 2.5 kg).
2.3.2. Independent Variables
The factors influencing LBW were identified through a review of global literature. Individual-level predictors included maternal body mass index (BMI), maternal education, place of delivery, number of living children, child’s sex, multiple pregnancies, and cesarean delivery. Community-level variables included the place of residence and region.
2.4. Spatial Analysis
2.4.1. Spatial Autocorrelation Analysis
The Global Moran’s I statistic test was applied to determine whether LBW patterns in Jordan were randomly distributed, spread out, or clustered. Moran’s I value close to −1 suggests dispersion, values near +1 indicate clustering, and values around 0 imply a random distribution of LBW cases [20, 21].
2.4.2. Spatial Scan Statistical Analysis
Spatial scan statistics is used to identify areas with unusually high concentrations of events, such as LBW cases, by comparing observed and expected event counts within a moving window. This method scans different locations and window sizes, applying statistical tests to detect spatial clusters. LBW newborns were treated as cases and non-LBW newborns as controls in the Bernoulli model [22].
2.4.3. Spatial Interpolation
The spatial interpolation method was applied to predict LBW rates in unsampled areas using data from sampled enumeration regions. Ordinary kriging interpolation was used to estimate LBW prevalence in these unsampled areas, as it accounts for spatial autocorrelation and optimizes the weight statistically.
2.5. Multilevel Linear Regression Analysis
Because of the hierarchical nature of data and the continuous outcome variable, the multilevel linear regression model was used.
When we have checked the assumptions of the multilevel linear regression model, one of the assumptions was normality, that is, residuals (the differences between observed and predicted values) should be normally distributed at each level of the hierarchy.
While the model assumes that the residuals are normally distributed, we have found the result of the Shapiro–Wilk W test, with a p value < 0.001. This means there is strong evidence to suggest that the residuals (or the data we tested) are not normally distributed.
Since the residuals are not normally distributed, we need to consider transformations of the dependent variable or use a different modeling approach. When dealing with continuous, positively skewed data, log-gamma models are appropriate. We have used a generalized linear model, that is, log-gamma mixed-effect model.
The individual- and community-level factors related to LBW were initially analyzed separately using a simple multilevel linear regression model. Variables with a p value less than 0.05 were then selected for inclusion in the multivariable log-gamma mixed-effects model.
The first null model (without explanatory variables) was used to evaluate community-level variance and determine the suitability of multilevel analysis. The second model adjusted for individual-level variables, while the third (final) model incorporated both individual and community-level variables. Fixed effects were used to assess the relationship between LBW risk and explanatory factors at both levels, with results reported as rate ratios with 95% confidence intervals. Deviance and likelihood-ratio tests were applied to evaluate model variation and compare the fit of the different models.
3. Results
There were 4886 live births in the 2 years before the survey. Among mothers with no education, 81.8% had no LBW infants, while 18.2% had LBW infants. In contrast, 81.6% of the mothers with primary education and 84.3% with secondary education or higher had no LBW infants. Of mothers classified as underweight, 81.8% had no LBW infants, compared with 80.8% of normal-weight mothers and 84.0% of overweight mothers. Among those delivering at home, 83.3% had no LBW infants, while 82.2% of those delivering in health facilities experienced the same outcome. When examining the sex of the child, 84.0% of male infants and 80.7% of female infants were born without LBW. The incidence of LBW was significantly higher in multiple births, with 60.1% classified as LBW. Among those who delivered vaginally (no cesarean), 85.4% had no LBW infants.
Conversely, this proportion dropped to 77.8% for cesarean deliveries. In Amman, 86.3% of births were without LBW, while the lowest percentage was observed in Ma’an with 75.0% without LBW. Other regions such as Zarqa and Balqa showed 84.6% of infants with no LBW (Table 1).
| Variables | Weighted frequency (%) | No low birth weight | Low birth weight |
|---|---|---|---|
| Maternal education | |||
| No education | 145 (2.6%) | 99 (81.8%) | 22 (18.2%) |
| Primary | 3656 (65.5%) | 2550 (81.6%) | 576 (18.4%) |
| Secondary and above | 1784 (31.9%) | 1300 (84.3%) | 243 (15.7%) |
| Maternal body mass index (BMI) | |||
| Underweight | 65 (1.2%) | 45 (81.8%) | 10 (18.2%) |
| Normal weight | 974 (17.4%) | 687 (80.8%) | 163 (19.2%) |
| Overweight | 2114 (37.9%) | 1526 (84.0%) | 290 (16.0%) |
| Place of delivery | |||
| Home | 14 (0.3%) | 10 (83.3%) | 2 (16.7%) |
| Health facility | 4658 (83.4%) | 3733 (82.2%) | 808 (17.8%) |
| No living children | |||
| No living children | 72 (1.3%) | 4 (80.0%) | 1 (20.0%) |
| One child | 768 (13.8%) | 552 (84.9%) | 98 (15.1%) |
| Two child | 1234 (22.1%) | 854 (82.0%) | 188 (18.0%) |
| 3+ | 3511 (62.9%) | 2539 (82.1%) | 554 (17.9%) |
| Sex of child | |||
| Male | 2574 (46.1%) | 2122 (84.0%) | 404 (16.0%) |
| Female | 2312 (41.4%) | 1827 (80.7%) | 437 (19.3%) |
| Multiple pregnancies | |||
| Single birth | 5391 (96.5%) | 3880 (84.0%) | 737 (16.0%) |
| Multiple births | 194 (3.5%) | 69 (39.9%) | 104 (60.1%) |
| Cesarean delivery | |||
| No | 3024 (54.1%) | 2506 (85.4%) | 429 (14.6%) |
| Yes | 1887 (33.8%) | 1443 (77.8%) | 412 (22.2%) |
| Region | |||
| Amman | 738 (13.2%) | 529 (86.3%) | 84 (13.7%) |
| Balqa | 314 (5.6%) | 220 (84.6%) | 40 (15.4%) |
| Zarqa | 791 (14.2%) | 578 (84.6%) | 105 (15.4%) |
| Madaba | 276 (4.9%) | 182 (75.8%) | 58 (24.2%) |
| Rbid | 739 (13.2%) | 534 (83.0%) | 109 (17.0%) |
| Mafraq | 588 (10.5%) | 443 (80.0%) | 111 (20.0%) |
| Jarash | 501 (9.0%) | 331 (80.5%) | 80 (19.5%) |
| Ajloun | 464 (8.3%) | 317 (85.7%) | 53 (14.3%) |
| Karak | 329 (5.9%) | 239 (85.7%) | 40 (14.3%) |
| Tafiela | 319 (5.7%) | 216 (78.8%) | 58 (21.2%) |
| Ma’an | 280 (5.0%) | 180 (75.0%) | 60 (25.0%) |
| Aqaba | 246 (4.4%) | 180 (80.7%) | 43 (19.3%) |
3.1. The Magnitude of LBW in Jordan
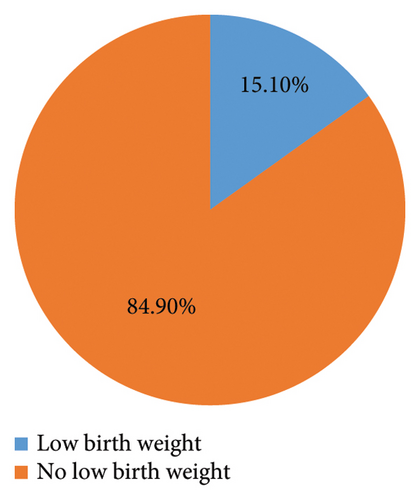
The pie chart illustrates that 15.1% of children in Jordan are classified as having LBW (Figure 2). The mean birth weight of children was 3.088 kg (95% CI: 3.055–3.122).
The bar chart presents a clear comparison of LBW rates across different regions in Jordan (Figure 3). In Amman, the highest percentage of infants with no LBW is reported at 86.3%, with only 13.7% classified as LBW. Following closely are the regions of Balqa and Zarqa, both showing 84.6% of children without LBW, with respective LBW rates of 15.4%. Madaba stands out with the lowest proportion of infants without LBW, at just 75.8%, and a corresponding high rate of 24.2% for LBW. The region of Irbid shows a slightly better outcome, with 83.0% of infants having no LBW, translating to a 17.0% LBW rate. Mafraq and Jarash also demonstrate notable figures, with 80.0% and 80.5% of infants, respectively, falling into the no LBW category, alongside low birth weight rates of 20.0% and 19.5%. Ajloun and Karak present similar outcomes, each with 85.7% of infants not experiencing LBW, while Tafiela shows a lower percentage of 78.8% for no LBW and a higher 21.2% for LBW. Finally, Ma’an has a concerning rate, with only 75.0% of infants classified as not LBW and a substantial 25.0% in the LBW category. Aqaba rounds out the data with 80.7% of infants having no LBW and 19.3% classified as LBW.
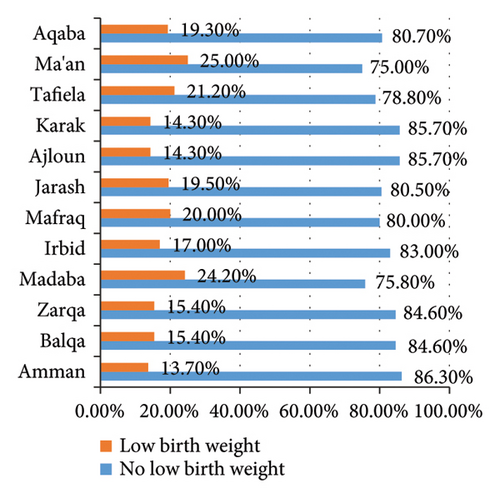
Overall, the chart underscores significant regional disparities in LBW rates, with Amman exhibiting the most favorable outcomes while Madaba and Ma’an present more alarming figures that highlight the need for targeted health interventions.
3.2. Spatial Distribution of LBW
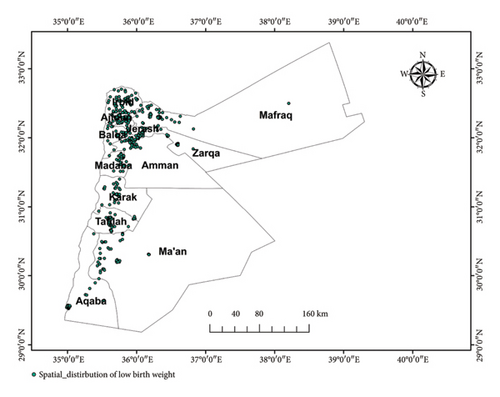
The majority of the Mafraq, Amman, Ma’an, and Aqaba regions had the lowest percentage of LBW. Large amounts of LBW were detected in the Balqa, rabid, Jarash, Ajloun, Madaba, Karak, and Tafiela regions (Figure 4).
3.3. Spatial Autocorrelation of LBW
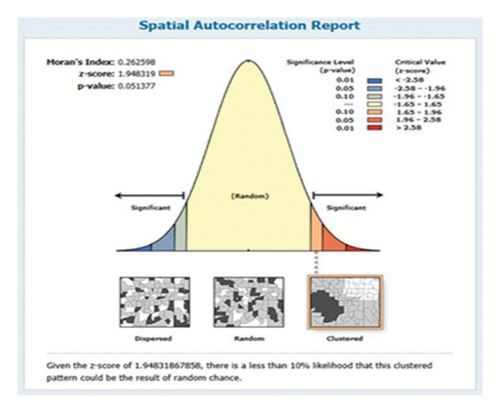
In Jordan, LBW had a nonrandom geographic distribution (Moran’s I = 0.26, p value = 0.05). The observed Moran’s index value (0.26) was higher than the expected index (−0.001623). With a Z-score of 1.948319, the probability that this clustered pattern is the product of random chance is less than 10% (Figure 5).
3.4. Hotspot Analysis of LBW
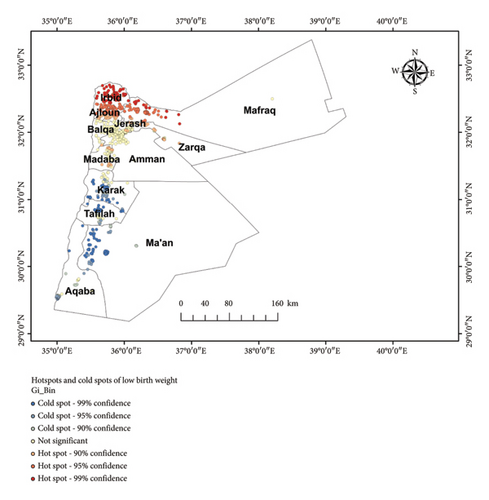
The LBW hotspots and cold spot zones of the research area were identified using the Getis-Ord GI∗ statistical analysis. The blue coloration represented the significant cold spot areas in the Karak, Tafiela, borders of Ma’an, and some parts of the Aqaba regions, where a significant proportion of children with no LBW (clusters with no LBW). The red color, however, was reserved for hotspot areas (clusters with high frequencies of LBW) in Rbid, Ajloun, Jarash, and borders of Mafraq regions (Figure 6).
3.5. Spatial Scan Statistical Analysis
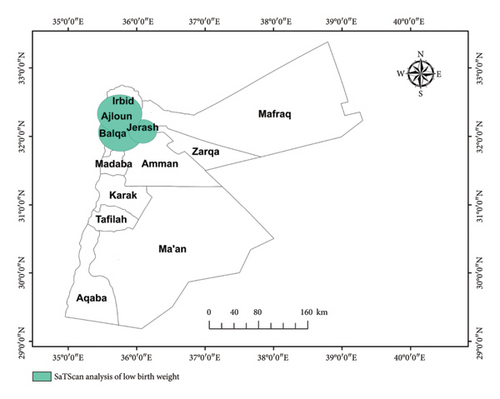
We have applied purely spatial analysis and scanning for clusters with low rates using the Bernoulli model. The spatial scan analysis identified six significant clusters of LBW, with four primary clusters being the most notable. The first cluster, located in the Irbid, Jarash, Ajloun, and Balqa regions, showed a relative risk (RR) of 0.75, indicating a 25% lower likelihood of LBW than average (LLR = 9.62, p < 0.01). A second cluster in the Balqa and Zarqa regions exhibited a RR of 0.78, reflecting a 22% reduction in risk compared to the overall population (LLR = 5.59, p = 0.018) (Table 2 and Figure 7).
| Type of cluster | Significant clusters identified | Coordinates/radius | Population | No_ of cases | RR | LLR | p-value |
|---|---|---|---|---|---|---|---|
| 1 | Rbid, Jarash, Ajloun, Balqa | 32.057703 N, 35.766038 E/30.59 km | 1926 | 282 | 0.75 | 9.624338 | 0.00014 |
| 2 | Balqa Zarqa | 32.072750 N, 36.087960 E/19.20 km | 1296 | 189 | 0.78 | 5.598588 | 0.018 |
3.6. Interpolation of Space
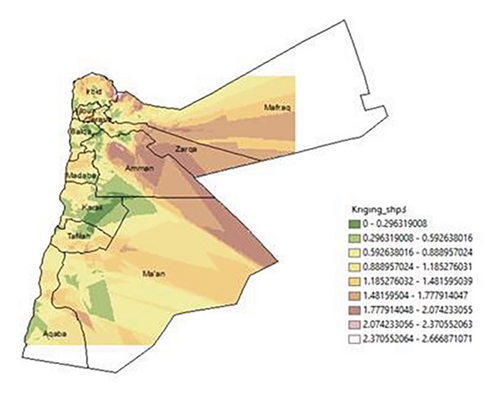
To forecast the magnitude of LBW among children using a survey conducted in various Jordan regions. Standard Kriging interpolation was used. Geostatistical Kriging analysis indicates that there are 0–0.29 cases in the Karak region. In the borders of Amman, Karak, and Ma’an, there are 0.29–0.59 cases predicted for unsurveyed children; in some areas of Zarqa, borders of Ma’an, central areas, and borders of Amman, there are 1.77–2.07 cases, and in some areas of Mafraq and Aqaba, there are 2.37–2.66 cases predicted for unsurveyed children (Figure 8.).
3.7. Random Effect Analyses and Model Comparison
Model I shows significant variance (2,539,444) with a standard error (SE) of 768,734.7. Model II has a higher variance (3,447,375) and a larger SE (1,378,885). Model III has a much lower variance (0.0127104), suggesting a reduced community-level effect. Log-likelihood and deviance of the model were used to assess model fitness. Model I has the lowest log-likelihood (−40,510.383), indicating the poorest fit. Models II and III have similar values (−21,723.004 and −21,706.836), suggesting better fits. For Models I and II, the LR test results (X2 = 0.00, p = 1.0000) suggest no significant improvement over the baseline model. Model III shows a significant result (X2 = 0.00, p < 0.001), indicating a substantial improvement. Lower deviance values indicate better model fit, with Model III having the lowest (43,413.672). Both Akaike Information Criterion (AIC) and Bayesian Information Criterion (BIC) values are lowest for Model III (AIC = 43,461.67, BIC = 43,602.56), suggesting it is the best model among the three (Table 3).
| Parameters | Model I | Model II | Model III |
|---|---|---|---|
| Community-level variance (SE) | 2,539,444 (768,734.7) | 3,447,375 (1,378,885) | 0.0127104 |
| Log-likelihood | −40510.383 | −21723.004 | −21706.836 |
| LR test | X2 == 0.00, p = 1.0000 | X2 == 0.00, p = 1.0000 | X2 == 0.00, p < 0.001 |
| Deviance | 81,020.766 | 43,446.008 | 43,413.672 |
| AIC | 81,026.77 | 43,474.01 | 43,461.67 |
| BIC | 81,046.25 | 43,556.19 | 43,602.56 |
3.8. Factors Associated With LBW
In simple linear regression analysis, variables such as maternal BMI, maternal education, place of delivery, no living children, sex of the child, multiple pregnancy, cesarean delivery, and region were associated with LBW (p value < 0.05).
Multilevel mixed-effect linear regression model assumptions were checked.
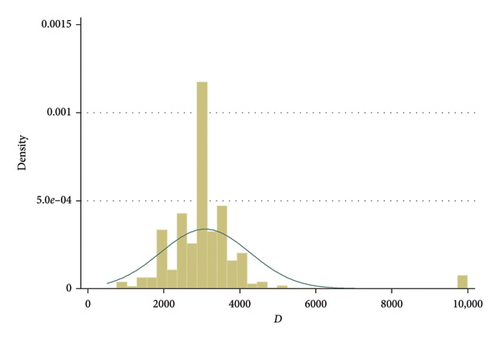
A histogram of the outcome variable (birth weight) can help assess whether the distribution of the outcome is approximately normal, which is a key assumption in linear regression.
To check the distribution of the outcome variable (birth weight), we have done a histogram of the birth weight (Figure 9).
A Quantile–Quantile plot (QQ plot) is a diagnostic tool used to assess whether the residuals from the model follow a normal distribution (Figure 10).
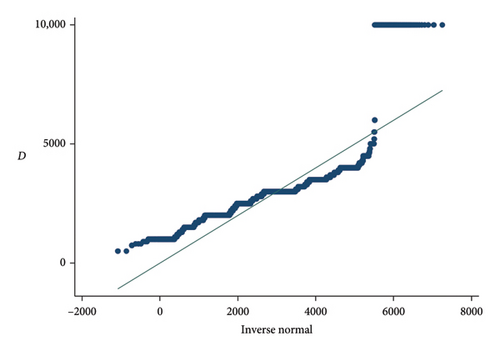
A QQ plot compares the quantiles of the residuals (or random effects) to the quantiles of a normal distribution. The plot provides a visual method to check if the residuals deviate from normality.
If the residuals are normally distributed, the points on the QQ plot will fall approximately along a straight line.
If the residuals are not normally distributed, the points will deviate from this straight line, especially at the ends (tails), indicating skewness, kurtosis (heavy tails), or other forms of non-normality.
One of the assumptions was normality, that is, residuals (the differences between observed and predicted values) should be normally distributed at each level of the hierarchy.
While the model assumes that the residuals are normally distributed, we have found the result of the Shapiro–Wilk W test, with a p value < 0.001. This means there is strong evidence to suggest that the residuals (or the data you tested) are not normally distributed (Table 4).
| Variable | Obs | W | V | z | Prob > z |
|---|---|---|---|---|---|
| Birth weight | 4886 | 0.64532 | 941.478 | 17.954 | 0.00000 |
Skewness measures the asymmetry of the distribution of the data. Pr(Skewness) = 0.0000 means the p value associated with the skewness test is 0.0000, which is highly statistically significant. In the context of normality tests, this indicates that the data significantly deviate from a normal distribution in terms of its skewness. In other words, the distribution of birth weight is not symmetric, and it is likely skewed. Pr(Kurtosis) = 0.0000 means the p value for the kurtosis test is also 0.0000, which is statistically significant. This suggests that the distribution of birth weight deviates significantly from a normal distribution in terms of kurtosis (Table 5).
| Variable | Obs | Pr (skewness) | Pr (kurtosis) |
|---|---|---|---|
| Birth weight | 4886 | 0.0000 | 0.0000 |
Since the residuals are not normally distributed, we need to consider transformations of the dependent variable or use a different modeling approach. When dealing with continuous, positively skewed data log-gamma models are appropriate. We have used a generalized linear model, that is, log-gamma mixed-effect model.
3.9. In the Log-Gamma Mixed-Effects Model
The analysis reveals that a unit increase in primary education is associated with a 21.4% decrease in birth weight (RR = 0.786, p < 0.001), while women with secondary education and above experience an 18.6% decrease (RR = 0.814, p < 0.001). In addition, women with normal weight have 11.1% lower birth weights compared with those who are underweight (RR = 0.899, p = 0.011). Women with one child see a substantial 55.8% decrease in birth weight (RR = 0.442, p < 0.001) and those with two children experience a 55.0% decrease (RR = 0.450, p < 0.001). Similarly, women with three or more children also have a 55.8% decrease (RR = 0.442, p < 0.001). Furthermore, birth weight decreases by 3.3% for female neonates (RR = 0.967, p = 0.006), while women with multiple births show a 19.4% decrease (RR = 0.806, p < 0.001). Finally, there is a 7.3% decrease in birth weight for women delivered by cesarean section (RR = 0.932, p < 0.001).
Birth weight increases by 8.6% (RR = 1.086, p = 0.007) and 12.7% (RR = 1.127, p < 0.001) in Ma’an and Karak, respectively, compared with Amman. Birth weight decreases by 4.7% (RR = 0.953, p = 0.037) and 6.1% (RR = 0.939, p = 0.023) in Irbid and Mafraq compared with Amman (Table 6).
| Variables | Model I | Model II ARR (95% CI) p value |
Model III ARR (95% CI) p value |
|---|---|---|---|
| Maternal education | |||
| No education | 1.00 | 1.00 | |
| Primary | 0.782 (0.718–0.852)∗ < 0.001 | 0.786 (0.721–0.856) < 0.001∗ | |
| Secondary and above | 0.812 (0.753–0.876)∗ < 0.001 | 0.814 (0.755–0.878) < 0.001∗ | |
| Maternal body mass index (BMI) | |||
| Underweight | 1.00 | 1.00 | |
| Normal weight | 0.896 (0.825–0.973) 0.009∗ | 0.899 (0.829–0.976) 0.011∗ | |
| Overweight | 0.920 (0.849–0.998) 0.045% | 0.923 (0.852–1.00) 0.053 | |
| Place of delivery | |||
| Home | 1.00 | 1.00 | |
| Health facility | 0.848 (0.692–1.038)∗ 0.110 | 0.847 (0.692–1.03) 0.110 | |
| No living children | |||
| No living children | 1.00 | 1.00 | |
| One child | 0.441 (0.287–0.677) < 0.001 | 0.442 (0.287–0.680) < 0.001∗ | |
| Two child | 0.449 (0.293–0.690) < 0.001 | 0.450 (0.293–0.693) < 0.001∗ | |
| 3+ | 0.440 (0.287–0.675) < 0.001 | 0.442 (0.287–0.679) < 0.001∗ | |
| Sex of child | |||
| Male | 1.00 | 1.00 | |
| Female | 0.967 (0.944–0.990) 0.006∗ | 0.967 (0.944–0.990) 0.006∗ | |
| Multiple pregnancies | |||
| Single birth | 1.00 | 1.00 | |
| Multiple births | 0.805 (0.751–0.863) < 0.001 | 0.806 (0.752–0.864) < 0.001 | |
| Cesarean delivery | |||
| No | 1.00 | 1.00 | |
| Yes | 0.932 (0.909–0.956) < 0.001 | 0.932 (0.909–0.956) < 0.001 | |
| Region | |||
| Amman | 1.00 | ||
| Balqa | 1.012 (0.959–1.067) 0.658 | ||
| Zarqa | 0.977 (0.935–1.021) 0.310 | ||
| Madaba | 0.998 (0.941–1.059) 0.964 | ||
| Rbid | 0.953 (0.911–0.997) 0.037∗ | ||
| Mafraq | 0.939 (0.890–0.991) 0.023∗ | ||
| Jarash | 1.013 (0.962–1.067) 0.612 | ||
| Ajloun | 1.020 (0.962–1.067) 0.612 | ||
| Karak | 1.127 (1.065–1.193) 0.000∗ | ||
| Tafiela | 0.958 (0.902–1.018) 0.169 | ||
| Ma’an | 1.086 (1.022–1.155) 0.007∗ | ||
| Aqaba | 0.985 (0.925–1.049) 0.656 |
- Note: The significant values for asterisk is p value < 0.05.
4. Discussion
The finding that birth weight decreases by 3.3% for female neonates (RR = 0.967, p = 0.006) suggests a statistically significant trend where female babies tend to have lower birth weights compared with their male counterparts. This observation aligns with existing research that often indicates a pattern of male infants generally having higher birth weights than female infants [23, 24]. This difference starts after 28 weeks of gestation. Although the exact mechanism impacting the difference in birth weight is unknown, it might be due to androgen activities or the Y chromosome that carries genetic material for fetal growth. As a result, male infants could have higher intrauterine growth and birth weight than their female counterparts [24, 25]. Several factors may contribute to this difference in birth weight between male and female neonates. Biologically, male fetuses tend to grow larger and accumulate more weight during pregnancy, which could be influenced by genetic and hormonal factors [26]. In addition, societal and environmental factors might play a role, including variations in maternal nutrition and health behaviors influenced by the sex of the child [27]. It is also important to consider potential health risks associated with female births. In some contexts, there may be cultural or socioeconomic pressures that impact maternal care and nutrition based on the expected sex of the child, which could indirectly affect birth weight [28].
Overall, this finding emphasizes the importance of considering sex as a factor in birth weight assessments and maternal health strategies, ensuring that both male and female infants receive appropriate care and support for healthy growth and development.
The finding that women with one, two, or three or more children experience significant decreases in birth weight—55.8% for one child, 55.0% for two children, and 55.8% for three or more children suggests an inverse relationship that aligns with some existing literature on maternal health and birth outcomes. A study found that multiparity is associated with lower birth weights, attributing this to resource dilution and increased maternal health risks with each successive pregnancy [29]. The researchers highlighted that as the number of children increases, the maternal body may face greater physiological demands, which can negatively impact fetal growth [30]. In addition, previous research corroborates these findings, indicating that women with multiple children often experience diminished resources—both in terms of financial support and maternal attention—leading to lower birth weights for subsequent children [31]. Another study emphasized the importance of maternal health interventions tailored to women with higher parity [32]. Moreover, the findings are consistent with a systematic review, which examined the effects of parity on birth weight across various populations. The review concluded that higher parity is associated with lower birth weights, suggesting a need for targeted prenatal care for women with multiple pregnancies to mitigate these risks [33].
The finding that women with normal weight have 11.1% lower birth weights compared with those who are underweight (RR = 0.899, p = 0.011) indeed challenges common assumptions about the relationship between maternal weight and neonatal outcomes. This result diverges from much of the existing literature, which typically indicates that underweight mothers are more likely to have lower birth-weight infants. The research found that underweight mothers had higher rates of LBW infants, confirming the expectation that higher maternal BMI is generally associated with better birth outcomes [34]. In contrast, the current findings may suggest that normal-weight women could be experiencing stressors or health issues that are not present in underweight mothers, potentially leading to adverse birth outcomes. For instance, previous studies found that normal-weight women might have increased levels of stress or face greater societal pressures that can negatively affect pregnancy health, contributing to lower birth weights [35–38].
Another study explored the complexities of maternal health, indicating that factors such as maternal age, socioeconomic status, and access to healthcare can influence birth outcomes in ways that are not solely determined by weight status. They noted that normal-weight mothers might face other risk factors that could impact fetal growth, complicating the interpretation of weight-related outcomes [39, 40]. One possible explanation is underweight women might also be more closely monitored by healthcare providers due to their weight status, leading to increased attention to their nutritional and health needs during pregnancy [41]. Conversely, women with normal weight may experience different health dynamics that could negatively impact birth weight. For instance, normal-weight women may encounter stressors related to body image, lifestyle factors, or other health conditions that could affect fetal development [42]. In addition, normal weight does not always equate to optimal health, as it is essential to consider other factors such as diet, exercise, and overall health status [43].
This finding underscores the need for a comprehensive understanding of maternal health that goes beyond weight alone. It suggests that weight status should be considered in conjunction with other health indicators to better understand its impact on birth outcomes. Future research should further investigate the interplay between maternal weight, health behaviors, and birth weight to inform effective maternal care strategies.
The analysis indicates a surprising association between education levels and birth weight, where an increase in primary education corresponds to a 21.4% decrease in birth weight (RR = 0.786, p < 0.001), and women with secondary education or higher show an 18.6% decrease (RR = 0.814, p < 0.001). These results suggest that higher educational attainment is linked to lower birth weights, which contradicts the common assumption that increased education generally leads to better health outcomes for mothers and infants. A study found that higher educational levels are positively associated with higher birth weights, indicating that women with more education tend to have better access to prenatal care and healthier lifestyles, leading to improved birth outcomes [44].
However, infants born to higher-educated mothers (≥ 12 years of schooling) have significantly lower mean weights [45]. Another study observed that while education generally predicts better maternal health, and contextual factors, such as socioeconomic status and healthcare access, can mediate this relationship. They found that in some populations, education did not sufficiently compensate for other adverse conditions that lead to lower birth weights [46]. This counterintuitive finding may require a deeper exploration of contextual factors influencing these outcomes. One possible explanation is that women with higher education may be more likely to delay childbirth or prioritize career and education over early family formation [47]. This delay can lead to pregnancies at older ages, which are often associated with higher risks of complications, potentially resulting in lower birth weights [48]. In addition, socioeconomic factors could play a role; women with higher education levels might experience stress related to balancing work and family responsibilities, impacting their overall health during pregnancy [49]. In conclusion, the analysis calls for a nuanced understanding of how educational attainment impacts maternal and infant health. Rather than assuming a straightforward correlation between education and improved birth outcomes, it is crucial to consider the broader social, economic, and healthcare contexts that influence these relationships.
The unexpected link between higher education and lower birth weights in Jordan could be due to several factors. Educated women may delay childbirth for career or studies, leading to higher pregnancy risks due to older age. Balancing work and family can also cause stress, affecting health. Moreover, education alone doesn’t guarantee better healthcare or lifestyle, particularly if other socioeconomic challenges exist. Therefore, a broader context must be considered when examining the connection between education and birth outcomes.
The findings indicate significant regional variations in birth weight across Jordan, with notable increases in Ma’an and Karak compared with Amman, as well as decreases in Irbid and Mafraq. Specifically, birth weight in Ma’an increased by 8.6% (RR = 1.086, p = 0.007) and in Karak by 12.7% (RR = 1.127, p < 0.001). These results suggest that factors contributing to improved birth outcomes in these regions may include better access to maternal healthcare, enhanced prenatal services, or socioeconomic improvements [50]. Conversely, the analysis reveals a decrease in birth weight in Irbid and Mafraq, with reductions of 4.7% (RR = 0.953, p = 0.037) and 6.1% (RR = 0.939, p = 0.023), respectively, compared with Amman.
This decline raises concerns about potential underlying issues in these regions, such as inadequate healthcare access, higher levels of poverty, or environmental factors that could negatively impact maternal and infant health [51].
While Ma’an and Karak exhibit positive outcomes, the declines in Irbid and Mafraq underscore the need for targeted interventions to address the specific challenges faced by these areas. It is crucial for policymakers to consider these disparities when designing public health strategies, ensuring that resources are allocated effectively to regions with declining birth weights while also promoting successful practices observed in Ma’an and Karak. By addressing the specific factors contributing to both positive and negative birth weight outcomes, public health efforts can be better directed toward improving overall maternal and infant health in the country.
The findings from both spatial scan analysis and hotspot analysis reveal important but seemingly contradictory insights into the spatial distribution of LBW in Jordan, particularly in the Irbid, Jarash, and Ajloun regions. The hotspot analysis identifies these areas as having a high frequency of LBW cases, which highlights a pressing public health concern that warrants further investigation and intervention. Conversely, the spatial scan analysis indicates that these same regions exhibit a RR of 0.75, suggesting a 25% lower likelihood of LBW compared with the average, with statistical significance (LLR = 9.62, p < 0.01). The difference in these findings may be due to the analysis difference that we have done, spatial scan statistics by scanning for clusters with low rate using the Bernoulli model we have used the number of cases and controls in regions of Jordan, and hot spot analysis was done using a number of cases in 970 clusters included during the survey. The contrasting results from the spatial scan statistics and hot spot analysis in the context of LBW in Jordan present an interesting dilemma for public health planning. To determine which result is better suited for generalization and intervention strategies, we need to evaluate both methodologies and their implications.
Given the pressing nature of public health issues surrounding LBW, hot spot analysis may be more suitable for immediate intervention and generalization. This is particularly important for identifying areas with high frequencies allowing public health officials to allocate resources effectively where they are most needed [52].
This discrepancy may arise from larger population sizes in these regions that dilute RR, leading to a situation where many cases exist but with an overall lower likelihood compared to other areas. Irbid is second by number of population in Jordan while Jarash is eight and Ajloun is nine by number of population in Jordan [53].
The Bernoulli model used in spatial scan statistics might assume different distributions of cases compared with the direct count method of hot spot analysis [54]. Prioritize interventions in regions identified as hot spots for LBW to address urgent health needs. This could involve enhanced maternal healthcare services and education [52]. Conduct detailed studies in the identified regions to understand the underlying causes of LBW, including socioeconomic, environmental, and healthcare access factors [55]. In summary, while both analyses provide valuable insights into the spatial distribution of LBW in Jordan, hot spot analysis is more immediately actionable for public health interventions.
The finding that women with multiple births experience a 19.4% decrease in birth weight (RR = 0.806, p < 0.001) highlights the significant impact of carrying more than one fetus on neonatal outcomes. This study aligns with a broader body of literature indicating that multiple gestations typically result in lower birth weights compared to singletons. A study found that twins and triplets have a significantly lower average birth weight compared to singletons [56]. Similarly, another study reported that the prevalence of LBW is much higher among multiple births, highlighting that the risks associated with multiple gestations are compounded by factors such as prenatal care and maternal health [57]. The study suggests that the decrease in birth weight is attributed to several factors inherent in multiple pregnancies [58]. These include increased competition for nutrients and space in the womb, higher rates of preterm labor, and potential complications that arise during pregnancy [59].
Several factors contribute to lower birth weights in multiple births. First, the physiological demands on a woman’s body increase substantially when carrying multiple fetuses, which can lead to insufficient nutrient and oxygen supply for each developing baby. As the available resources are divided among the fetuses, it often results in lower birth weights compared with singletons [60].
In addition, women with multiple pregnancies may face higher risks of complications, such as preterm labor, gestational hypertension, and other health issues, which can further compromise fetal growth [61]. Preterm births are particularly common in multiple pregnancies, and infants born prematurely typically have lower birth weights due to their shorter gestational periods [62]. In conclusion, this finding emphasizes the importance of providing specialized support and resources for women with multiple pregnancies to promote healthier birth outcomes.
By understanding the factors that contribute to lower birth weights in these cases, healthcare providers can implement more effective monitoring and interventions to improve maternal and neonatal health.
The finding that there is a 7.3% decrease in birth weight for women delivered by cesarean section (RR = 0.932, p < 0.001) indicates a significant association between the mode of delivery and neonatal birth weight. This result suggests that babies born via cesarean section tend to have lower birth weights compared to those delivered vaginally. However, it is important to note that C-section deliveries may often be performed in cases where LBW is anticipated, rather than being the direct cause of LBW. Research has highlighted that infants delivered by C-section tend to have lower birth weights compared to those born vaginally [63], but causality should not be assumed without further investigation into the underlying medical conditions influencing the decision to perform a cesarean. Another study suggested that factors such as the timing of delivery and maternal health status may contribute to LBW [55]. In addition, maternal characteristics such as obesity and gestational diabetes are often associated with higher rates of C-sections, which could impact birth weight outcomes [64]. These factors support the idea that the mode of delivery plays a role in neonatal outcomes, but it is essential to approach this association with caution and avoid assuming a direct cause-and-effect relationship. In conclusion, this finding underscores the need for careful monitoring and management of pregnancies that may lead to cesarean deliveries. It also highlights the importance of providing support and education for pregnant mothers regarding the potential impacts of delivery mode on birth outcomes, while recognizing that other medical factors may also contribute to these outcomes.
4.1. Strengths of the Study
This study leverages the Jordan Population and Family Health Survey (JPFHS 2023), which provides a nationally representative sample of 5585 women across 970 enumeration areas, ensuring that the findings are generalizable to the population of Jordan. The study employs well-established methodologies for spatial analysis (e.g., Moran’s I, spatial scan statistics) and multilevel modeling, which are appropriate for analyzing hierarchical data structures like those in this study. These methods also account for spatial autocorrelation and optimize statistical weight for more accurate estimates. The study’s use of generalized linear models with log-gamma mixed-effects modeling addresses issues with non-normally distributed residuals, making it a robust method for analyzing the continuous nature of birth weight data.
4.2. Limitations of the Study
First, the data used in this study are secondary and sourced from the JPFHS 2023, which means there is limited control over the original data collection process. This could introduce potential issues such as recall bias, particularly in the reporting of birth weight, as well as missing data for certain variables. These factors may impact the accuracy and reliability of the findings. In addition, the study’s cross-sectional design limits the ability to examine the temporal sequence of events leading to LBW, making it difficult to establish causal relationships. A longitudinal study design would be more appropriate for exploring the causal pathways of LBW over time.
While the study includes a wide range of individual- and community-level factors, other potential confounders, such as maternal smoking, access to prenatal care, or underlying health conditions, may not have been included in the analysis. The exclusion of these variables could limit the comprehensiveness of the study and affect the generalizability of the results. Furthermore, model assumptions used in the analysis may not fully account for all sources of variability or bias, which could also impact the validity of the conclusions.
Lastly, the findings of this study may not be fully generalizable beyond the specific population represented in the JPFHS 2023. Differences in regional, cultural, or demographic factors may influence the applicability of these results to other populations.
5. Conclusion
This study highlights key spatial and sociodemographic factors influencing LBW in Jordan. Hotspot areas in Irbid, Ajloun, Jarash, and Mafraq were identified, emphasizing the need for targeted interventions. Factors such as maternal education, weight status, parity, gender, multiple births, and delivery method were all associated with variations in birth weight. Regional disparities were also found, with Ma’an and Karak showing increased birth weights, while Irbid and Mafraq had decreased birth weights compared to Amman. These findings underscore the need for region-specific policies to reduce LBW and improve maternal and child health in Jordan.
Ethics Statement
There is no information gathering from subjects in this study. We gave the DHS program office a one-page proposal abstract for the study. They are able to view the information.
Consent
The authors have nothing to report.
Conflicts of Interest
The authors declare no conflicts of interest.
Author Contributions
K.T.T. was responsible for the project’s conception and design, data collection, analysis, and interpretation. K.T.T., E.T.T., M.K.T., S.E.T., A.A.C., T.K.W., A.Z.W., A.A.D., M.T.A., and J.M.K. were responsible for data curation, article drafting, critical revision for intellectual content, validation, and final approval of the version to be published. The final manuscript was read and approved by all writers.
Funding
No fund was received for this work.
Acknowledgments
We thank the Measure DHS for providing us with the data and shape files for the study area.
Open Research
Data Availability Statement
The dataset used and analyzed in this study is available from DHS program official database https://dhsprogram.com/data/available-datasets.cfm upon formal request. Approval for dataset access is typically confirmed via email.


