Focus on Visceral Fat Screening in Nonobese Patients With Type 2 Diabetes to Prevent Nonalcoholic Fatty Liver
Abstract
Objective: To identify risk factors associated with nonalcoholic fatty liver disease (NAFLD) in patients with type 2 diabetes (T2DM) and provide a basis for improved prevention and treatment strategies for NAFLD.
Methods: A total of 156 hospitalized patients with T2DM were enrolled and divided into NAFLD and non-NAFLD groups (75 and 81 patients, respectively) based on the ultrasonic diagnosis results. Biochemical data were collected from all patients. A bioelectrical impedance analyzer (OMRON, HDS-2000 DUALSCANR) was used to analyze visceral adipose tissue (VAT) and subcutaneous adipose tissue (SAT) in the abdomen. Statistical analyses were conducted using SPSS 22.0 software.
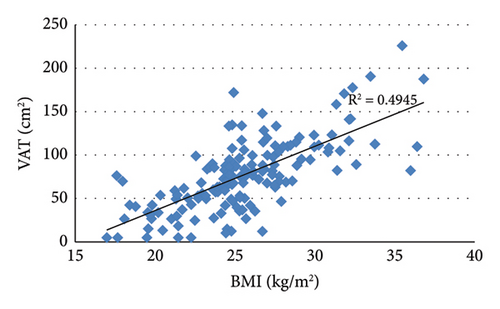
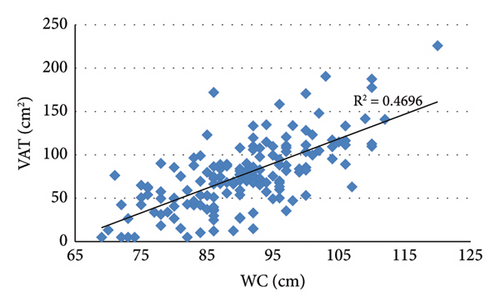
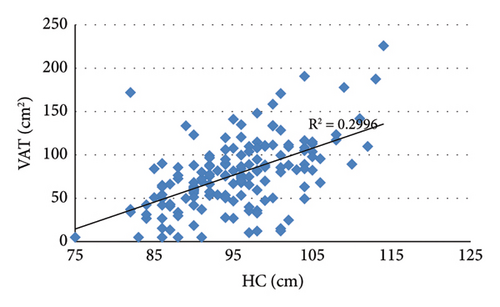
Results: Statistically significant differences were observed between the NAFLD and non-NAFLD groups in body weight, body mass index (BMI), waist and hip circumference (WC and HC), waist-to-hip ratio (WHR), fasting C-peptide (FCP), alanine aminotransferase (ALT), gamma-glutamyl transpeptidase (GGT), total triglycerides (TG), high-density lipoprotein cholesterol (HDL-C), apolipoprotein B (apoB), superoxide dismutase (SOD), free fatty acids (FFA), VAT, and SAT (all p < 0.05). VAT was positively correlated with BMI (r = 0.703, p < 0.001), WC (r = 0.685, p < 0.001), HC (r = 0.547, p < 0.001), SAT (r = 0.774, p < 0.001), TG (r = 0.365, p < 0.001), FCP (r = 0.287, p < 0.001), ALT (r = 0.282, p < 0.001), and GGT (r = 0.273, p = 0.001) and negatively correlated with HDL-C (r = −0.201, p = 0.012). Multivariable logistic regression analysis indicated that VAT and FFA are independent influencing factors for NAFLD (p < 0.01). A receiver operating characteristic curve showed that the sensitivity and specificity of VAT for predicting NAFLD in T2DM were 88.0% and 57.8%, respectively.
Conclusions: VAT and FFA are independent risk factors for NAFLD in patients with T2DM, with VAT serving as a reliable predictor for NAFLD screening. Screening for NAFLD should not be limited to overweight or obese individuals; attention should also be given to nonobese and lean patients.
1. Introduction
Nonalcoholic fatty liver disease (NAFLD) is the most common chronic liver disease and the leading cause of chronic hepatopathy worldwide. Epidemiological studies estimate that NAFLD affects approximately 30% of the adult population globally, with prevalence rates varying based on region, race, nutritional status, and socioeconomic status. The highest prevalence is observed in North Africa and the Middle East (42.62%), followed by North America and Australia (38.47%). In China, the prevalence is approximately 30% as it aligns with those of East Asia (32.31%) and South Asia (29.29%) [1, 2].
NAFLD is characterized by hepatic steatosis exceeding 5%. Diagnosis typically requires imaging that reveals diffuse hepatocyte steatosis or histological evidence, along with the exclusion of excessive alcohol intake and other chronic liver diseases that may lead to hepatic adipose degeneration. Despite the growing morbidity rate of NAFLD, it remains a underappreciated chronic disease due to underdiagnosis and inadequate recording in clinical practice [3]. NAFLD is often discovered during routine physical health examinations and is the leading cause of abnormal liver transaminase levels, which are closely associated with metabolic dysfunction. Therefore, some scholars have proposed renaming NAFLD to metabolic-associated fatty liver disease (MAFLD) [4]. However, some scholars disagree with this view, believing that the term MAFLD is still associated with a great deal of ambiguity, making it premature to change the terminology [5].
Obesity and type 2 diabetes (T2DM) are important components of metabolic syndrome and are both relevant risk factors for NAFLD. The prevalence of NAFLD is increasing in parallel with rising rates of obesity and the T2DM epidemic [6]. Notably, obesity is characterized by the accumulation of an excessive amount of abnormally distributed body fat. Within the body, adipose tissue includes visceral adipose tissue (VAT) and subcutaneous adipose tissue (SAT). Importantly, substantial epidemiological evidence shows that VAT is an independent risk factor for cardiovascular and metabolic diseases [7]. Furthermore, hepatic fat deposition results in dysfunctional liver metabolism, abnormal glucose and lipid metabolism, and impaired antioxidant capacity. This underscores the complex interplay between liver function and metabolic health.
Adipose tissue is closely linked to NAFLD, T2DM, and obesity; however, the mechanisms of the relationship between these three factors remain unclear. Identifying the associations between VAT and SAT with NAFLD in patients with T2DM can contribute to the identification of risk factors for NAFLD, facilitating prevention strategies and timely individualized treatment approaches. Therefore, in this study, we measured the VAT and SAT areas in the abdomen, serum free fatty acid (FFA) levels, indices of glucose metabolism, superoxide dismutase (SOD), and other blood lipid components in patients with T2DM, both with and without NAFLD. We also analyzed the relationships among these measurements and NAFLD, aiming to provide a foundation for improved prevention and treatment of NAFLD.
2. Materials and Methods
2.1. Study Subjects
Participants were recruited from hospitalized patients with T2DM in the Department of Endocrinology at the First Affiliated Hospital of Bengbu Medical University, China. The inclusion criteria were as follows: aged between 18 and 80 years; diagnosed with diabetes according to the World Health Organization (WHO) Expert Committee on Diabetes (1999) guidelines; classified diagnosis of T2DM; and ultrasound diagnosis of hepatic diffuse steatosis. The exclusion criteria included a history of excessive alcohol consumption (> 30 g/day for men or > 20 g/day for women); hepatolenticular degeneration; autoimmune or viral hepatitis; hepatoma; drug-induced liver injury; or other conditions that may lead to fatty liver changes and important organ failure.
2.2. Methods
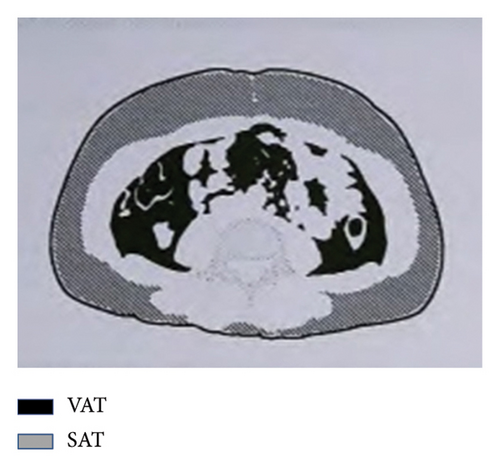
General data were collected from all participants, including blood pressure, disease duration, body height and weight, waist circumference (WC), hip circumference (HC), body mass index (BMI), and waist-to-hip ratio (WHR). A sample of 3–5 mL of fasting elbow venous blood was sent to a biochemical laboratory in a heparin anticoagulant tube for testing. An automatic biochemical analyzer was used to measure the following biochemical parameters: alanine aminotransferase (ALT), aspartate aminotransferase (AST), gamma-glutamyl transpeptidase (GGT), uric acid (UA), creatinine (Scr), and blood urea nitrogen (BUN) and serum lipids, including total cholesterol and triglycerides (TC and TG), high-density lipoprotein cholesterol and low-density lipoprotein cholesterol (HDL-c and LDL-c), apolipoprotein A and B (apoA and apoB), FFA, C-reactive protein (CRP), and SOD. High-performance liquid chromatography was used to test glycosylated hemoglobin (HbA1c). All participants underwent standard bread meal tests and fasting (FPG) and 2-h postprandial plasma glucose (2h-PG) tests, as well as fasting and 2-h postprandial C-peptide (FCP and 2h-CP) tests. Abdominal ultrasonography was conducted to diagnose fatty liver. A bioelectrical impedance analyzer (OMRON, HDS-2000 DUALSCANR) measured the VAT and SAT areas in the abdomen (Figure 1). According to the absence or presence of NAFLD, participants were divided into two groups: The NAFLD group and the non-NAFLD group.
2.3. Statistical Analysis
The data were analyzed utilizing the SPSS 22.0 statistical software. Continuous variables were represented as means with standard deviations (SDs) or medians with interquartile ranges (M [Q25, Q75]). The Mann–Whitney U test was employed to compare continuous variables, while the Chi-square test was utilized to compare categorical variables. The relationships between variables were examined using Pearson and Spearman correlation analyses. Multivariable logistic regression was conducted to analyze the factors independently associated with NAFLD. Receiver operating characteristic (ROC) curve analysis was performed to evaluate predictive factors. Statistical significance was determined when the two-tailed p value was less than 0.05.
3. Results
3.1. Comparison of Parameters Between the Non-NAFLD and NAFLD Groups
There were statistically significant differences in weight, BMI, WC, HC, WHR, FCP, ALT, GGT, TG, HDL-c, apoB, SOD, FFA, VAT, and SAT between the non-NAFLD group and the NAFLD group. There were no statistically significant differences in other indexes between the groups (Table 1).
| n | Gender | Age (years) | Height (cm) | Weight (kg) | BMI | WC (cm) | HC (cm) | WHR | SBP (mmHg) | DBP (mmHg) | ||
|---|---|---|---|---|---|---|---|---|---|---|---|---|
| Male | Female | |||||||||||
| Non-NAFLD | 81 | 42 | 39 | 58.2 (11.8) | 164.9 (7.7) | 64.6 (10.9) | 23.7 (3.6) | 86.5 (8.9) | 93.0 (7.0) | 0.9 (0.9,1.0) | 133.1 (21.3) | 74.3 (10.5) |
| NAFLD | 75 | 44 | 31 | 56.1 (14.7) | 166.7 (9.8) | 76.7 (13.5) | 27.5 (3.1) | 94.6 (8.9) | 97.4 (6.6) | 1.0 (0.9,1.0) | 136.3 (18.9) | 76.8 (11.4) |
| p | 0.393 | 0.322 | 0.200 | < 0.001 ∗ | < 0.001 ∗ | < 0.001 ∗ | < 0.001 ∗ | < 0.001 ∗ | 0.337 | 0.149 | ||
| Disease course (years) | FPG (mmol/L) | 2h-PG (mmol/L) | FCP (ng/mL) | 2h-CP (ng/mL) | HbA1c (%) | ACR (mg/mmol) | ALT (u/L) | AST (u/L) | GGT (u/L) | UA (mmol/L) | Scr (μmol/L) | |
| Non-NAFLD | 8.0 (2.0,15.0) | 8.6 (3.2) | 16.9 (5.3) | 1.3 (0.7,1.8) | 4.3 (2.9) | 9.1 (2.1) | 2.7 (0.9,23.9) | 14.0 (12.0,16.0) | 19.0 (17.0,21.0) | 16 (12.2) | 284.6 (97.7) | 68.0 (57.0,77.0) |
| NAFLD | 6.0 (0.3,13.0) | 9.6 (3.5) | 18.4 (4.7) | 1.9 (1.1,2.8) | 5.2 (3.0) | 9.5 (2.2) | 1.9 (0.8,19.4) | 17.0 (13.0,23.0) | 19.0 (16.0,21.0) | 21 (17.3) | 296.0 (85.5) | 66.0 (55.0,73.0) |
| p | 0.065 | 0.050 | 0.076 | < 0.001 ∗ | 0.053 | 0.364 | 0.586 | 0.002 ∗ | 0.935 | < 0.001 ∗ | 0.443 | 0.360 |
| BUN (mmol/L) | TC (mmol/L) | TG (mmol/L) | HDL-c (mmol/L) | LDL-c (mmol/L) | apoA (g/L) | apoB (g/L) | CRP (mg/L) | SOD (ku/L) | FFA (μmol/L) | VAT (cm2) | SAT (cm2) | |
| Non-NAFLD | 6.4 (2.6) | 4.2 (1.5) | 1.2 (0.9,1.9) | 1.0 (0.3) | 2.5 (1.9,2.9) | 1.0 (0.9,1.2) | 0.8 (0.6,1.0) | 1.6 (0.8,5.2) | 157.4 (28.8) | 370.0 (180.7) | 58.1 (33.1) | 163.6 (63.6) |
| NAFLD | 5.7 (2.0) | 4.40 (1.1) | 2.2 (1.5,3.9) | 0.9 (0.2) | 2.4 (2.0,3.0) | 1.0 (0.9,1.2) | 0.9 (0.7,1.1) | 2.1 (1.2,4.2) | 166.9 (27.4) | 449.6 (178.7) | 97.4 (37.8) | 229.5 (61.7) |
| p | 0.055 | 0.342 | < 0.001 ∗ | 0.008 ∗ | 0.781 | 0.946 | 0.027 ∗ | 0.289 | 0.037 ∗ | < 0.001 ∗ | < 0.001 ∗ | < 0.001 ∗ |
- Note: Data are presented as mean (standard deviation) or median (interquartile range). HbA1c, glycosylated hemoglobin; Scr, creatinine.
- Abbreviations: 2h-CP, 2-h c-peptide; 2h-PG, 2-h plasma glucose; ACR, albumin-to-creatinine ratio; ALT, alanine transaminase; apoA, apolipoprotein A; apoB, apolipoprotein B; AST, aspartate transaminase; BMI, body mass index; CRP, c-reactive protein; DBP, diastolic blood pressure; FCP, fasting c-peptide; FFA, free fatty acids; FPG, fasting plasma glucose; GGT, gamma-glutamyl transpeptidase; HC, hip circumference; HDL-c, high density lipoprotein cholesterol; LDL-c, low density lipoprotein cholesterol; SAT, subcutaneous adipose tissue; SBP, systolic blood pressure; SOD, superoxide dismutase; TC, total cholesterol; TG, triglycerides; UA, uric acid; UN, urea nitrogen; VAT, visceral adipose tissue; WC, waist circumference; WHR, waist-to-hip ratio.
- ∗p < 0.05.
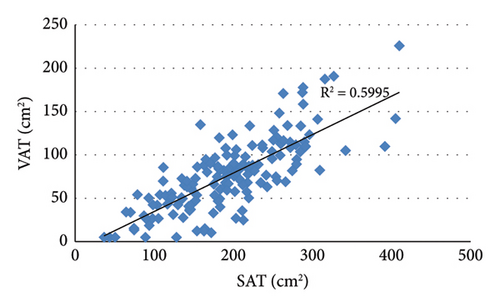
3.2. Correlation Analysis Showed That VAT Was Positively Correlated With BMI, WC, HC, and SAT (Figure 2)
Analysis of the correlation between VAT and lipid indicators showed that VAT was negatively correlated with HDL (r = −0.201, p = 0.012) and positively correlated with TG (r = 0.365, p < 0.001). In addition, VAT was positively correlated with FCP (r = 0.287, p < 0.001), ALT (r = 0.282, p < 0.001), and GGT (r = 0.273, p = 0.001).
3.3. Multivariable Logistic Regression Analysis Showed That VAT and FFA Were Independent Influencing Factors for NAFLD in Patients With T2DM (Table 2)
The results of multivariable logistic regression analysis of related influencing factors for NAFLD in patients with T2DM are shown in Table 2.
| Variable | B | S.E | Wald | Sig. | Exp (B) | 95% confidence interval | |
|---|---|---|---|---|---|---|---|
| Lower bound | Upper bound | ||||||
| VAT | 0.039 | 0.007 | 28.450 | 0.000 | 1.040 | 1.025 | 1.055 |
| FFA | 0.005 | 0.001 | 16.771 | 0.000 | 1.005 | 1.003 | 1.008 |
- Note: After adjusting for age; gender; HbA1c, glycosylated hemoglobin.
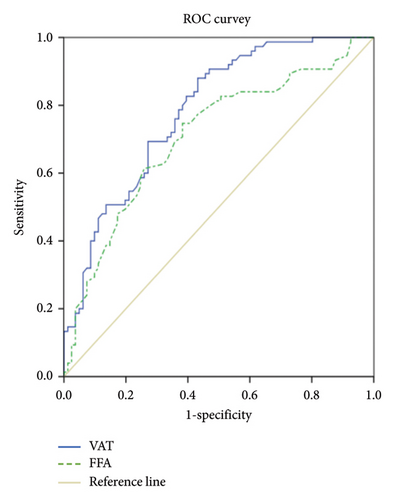
3.4. The ROC Curve Showed That the Area Under the Curve (AUC) of VAT Is Larger Than That of FFA (Figure 3)
The ROC curve shows the AUC of VAT is 0.783, 95% CI (0.713, 0.854) (p < 0.001). The sensitivity and specificity of VAT for predicting NAFLD in T2DM are 88.0% and 57.8%, respectively (cutoff value = 62.45). The AUC of FFA is 0.708, 95% CI (0.626, 0.790) (p < 0.001). The sensitivity and specificity of FFA for predicting NAFLD in T2DM are 74.7% and 61.7%, respectively (cutoff value = 365). VAT, visceral adipose tissue; CI, confidence interval; FFA, free fatty acids; NAFLD, non-alcoholic fatty liver disease.
4. Discussion
NAFLD is regarded as the chief cause of hepatic disease, affecting approximately one in four adults worldwide [8]. As a result, it has become a high-profile health concern worldwide. The onset of NAFLD is closely associated with obesity and T2DM [9, 10], forming a complex interplay among these three conditions. Notably, insulin resistance plays a pivotal role in linking them [11]. Moreover, the presence of both NAFLD and T2DM is frequently observed as complications arising from obesity [12], and T2DM and obesity are also risk factors for NAFLD [13]. The parallel rise in the prevalence of these three diseases has elevated them to epidemic status, imposing a huge burden on society and the economy [14–16]. However, in clinical practice, NAFLD in patients with T2DM is often overlooked, especially in nonobese and lean patients. Given the pathophysiology of NAFLD and its strong association with glucose and lipid metabolism disorders, this article studies the relationship between the area of abdominal fat tissue (VAT and SAT), FFA levels, and NAFLD in patients with T2DM.
The results of this study show that there were no statistically significant differences in sex, age, height, course of T2DM, FPG, 2h-PG, or HbA1c between the NAFLD group and the non-NAFLD group. The results also indicated that the mean values of BMI, WC, HC, and WHR were higher in individuals with NAFLD compared with those without. In addition, it was found that among patients with T2DM, those with higher BMI are more likely to have NAFLD. Notably, while BMI was higher in patients with NAFLD, it remained within a range suggesting that NAFLD is not confined to obese and overweight individuals. Globally, nonobese patients account for approximately 40% of the NAFLD population and 20% of these patients are lean; therefore, screening for NAFLD should cover all BMI ranges [17].
Overweight and obesity can be assessed through anthropometric measurements. By measuring height, weight, WC, and HC, BMI and WHR can be calculated. These are accurate and simple indexes of overweight and obesity, particularly central obesity. Specifically, BMI is a commonly used measure to define obesity and overweight. Nevertheless, the abovementioned indicators cannot distinguish body composition, such as VAT and SAT. As a result, two individuals with the same BMI may have different disease risks and comorbidities [18]; thus, relying solely on these metrics to assess disease risk may present substantial bias. Moreover, due to the heterogeneity of obesity, relying solely on BMI as a parameter to assess pathological status is oversimplified. Therefore, considering factors such as fat distribution becomes crucial in accurately assessing obesity [19].
Medical imaging technology advancements have made the quantitative analysis of human body composition possible. For instance, computed tomography (CT) and magnetic resonance imaging (MRI) can generate different imaging parameters of body fat, thereby differentiating between VAT and SAT [20]. However, given that CT exposes patients to ionizing radiation and that these methods are relatively expensive, their use may be limited in clinical settings. In contrast, bioelectrical impedance is a modality that estimates body fat composition and is radiation free, easily accessible, and cheaper than CT and MRI; thus, it is widely used in clinical studies [21–24].
In the present study, we estimated abdominal VAT and SAT levels using the bioelectrical impedance method. The statistical results showed that the mean VAT, SAT, and FFA levels in the NAFLD group were higher than those in the non-NAFLD group. VAT refers to fat around the mesentery and omentum, which differs from SAT. Specifically, adipocytes in SAT and VAT differ in size: SAT contains smaller adipocytes with greater insulin sensitivity, while VAT contains larger adipocytes. Furthermore, while both VAT and SAT contribute to fat accumulation, they do so through different mechanisms. Venous blood returns from SAT and VAT to the liver through the systemic venous system and hepatic portal vein, respectively [25]. Notably, VAT secretes FFA and adipokines directly into the liver via portal drainage, which may have a greater impact on fat accumulation in the hepatic area than SAT. Thus, it is clear that SAT and VAT differ in structure, function, and endocrine metabolism.
The fascia scarpa separates SAT into deep SAT and superficial SAT. It is thought that, in patients with obesity, deep SAT in men and superficial SAT in women are related to hepatic steatosis [26]. Furthermore, many clinical and epidemiological studies have suggested a strong link between VAT and hepatic steatosis, showing a significant correlation between VAT and cardiometabolic risk [27–29]. However, there are conflicting reports suggesting that liver fat accumulation is independent of BMI and intraperitoneal fat, leaving the role of VAT in this process uncertain [30]. Our statistical results demonstrate that VAT and FFA levels are independent risk factors for NAFLD. For VAT, the area under the ROC curve was larger than that for FFA, indicating that VAT has higher sensitivity and specificity for NAFLD and that patients with T2DM and high VAT levels are more likely to develop NAFLD.
Insulin resistance (IR) results from the impairment of insulin postreceptor signaling, which is a key mechanism linking T2DM, NAFLD, and obesity. Specifically, increased circulating FFA, caused by lipolysis in adipose tissue, are diverted to the liver. Subsequently, FFA derived from adipose tissues, along with the imbalance between FFA output and input, lead to excessive FFA in the circulation, promoting triglyceride accumulation in the liver [31]. Moreover, the heightened metabolic activity of VAT promotes the circulation of FFA molecules, which induces IR in surrounding tissues [32]. Notably, insulin acts on adipocytes to regulate the delivery of FFA to the liver. Furthermore, the liver is the organ most sensitive to insulin impairment; when IR occurs, it causes dysregulation of lipolysis, leading to excessive FFA entering the liver and resulting in NAFLD. This disruption contributes to a spectrum of metabolic changes, leading to an abnormal hepatic lipid profile, where defective TG metabolism causes fat accumulation [33–35]. In line with these mechanisms, we found that FCP and SOD levels in the NAFLD group were significantly higher, and there were no statistically significant differences between the groups in FPG, 2h-PG, 2h-CP, and HbA1c. Importantly, C-peptide reflects islet cell function, and FCP levels were higher in patients with NAFLD than in patients with non-NAFLD. However, a statistically significant difference in 2h-CP between the two groups was not found, with a p value close to 0.05 (p = 0.053), indicating that the NAFLD group had better insulin secretion and may have stronger IR.
The homeostasis model assessment of IR (HOMA-IR) is a common parameter reflecting IR, influenced by fasting blood glucose and insulin levels. However, the participants in our research were hospitalized patients with T2DM who had varying disease duration and treatment methods. For instance, some patients were taking oral hypoglycemic drugs, including sulfonylureas, while others were receiving insulin therapy. Thus, given the effects of these drugs on fasting plasma glucose and fasting insulin, we did not calculate HOMA-IR values.
Excessive fat accumulation decreases the liver’s ability to clear free radicals, significantly increasing the number of free radicals in the body. This leads to the production of more superoxide dismutase to neutralize the free radicals, resulting in elevated SOD levels. However, the pathogenic pathways of NAFLD are not completely understood, as they are influenced by environmental, genetic, metabolic, and microbiome factors, as well as oxidative stress. These factors contribute to the mechanisms underlying the incidence of NAFLD and may be involved in initiating liver and extrahepatic injury in line with the multiple parallel-hit hypothesis [36, 37]. In addition to oxidative stress, many lipid components mediate liver lipotoxicity, including FFA, TG, and cholesterol. Notably, the export of very low-density lipoproteins (VLDLs) or the β-oxidation of dietary lipids affects hepatic steatosis [38]. To explore this further, we compared the lipid profiles of our two groups, and our results showed that the NAFLD group had significantly higher TG and apoB concentrations than the non-NAFLD group, while the result was the opposite for HDL.
Under normal circumstances, liver uptake of FFA balances with FFA oxidation and secretion into plasma as VLDL triglycerides (VLDL-TGs). However, when lipid homeostasis is disrupted, it leads to TG deposition in the liver [39]. Moreover, FFAs are not only the primary contributor to hepatic TG but also to fasting plasma TG [40]. Nevertheless, not all patients with fatty liver have hypertriglyceridemia, as TG levels are influenced by the liver’s capacity to metabolize fatty acids. In addition, TG levels are affected by lifestyle, diet, and age, displaying significant variation between individuals. Conversely, HDL is the densest lipoprotein in serum, and elevated HDL levels assist peripheral tissues in clearing cholesterol. Thus, HDL is considered an antiatherosclerotic factor with cardioprotective properties [41]. Notably, some research has reported that HDL-C efflux capacity is damaged in patients with NAFLD [42, 43], and we also observed a decrease in HDL levels in the NAFLD group. In addition, apoB, the most abundant protein in LDL, regulates VLDL synthesis in the liver. In this context, Sarmadi et al. found that the anti-inflammatory capacity of apoB-depleted plasma was impaired, which correlated with VAT and ALT levels, as well as obesity indices, independently of HDL-C levels [44]. Thus, the relationship between blood lipids and NAFLD is complex, and the potential causal relationship remains unclear.
The immune response is regulated by lipid metabolism, and immune-metabolic dysregulation occurs in multiple tissues, including the liver [45]. This dysregulation is one of the factors contributing to the pathogenesis of metabolic diseases. In line with this, our results demonstrated higher ALT and GGT levels in the NAFLD group. Moreover, VAT was positively correlated with ALT and GGT, while no significant association was found between SAT and ALT or GGT. These results are consistent with those of Tang et al. [46], who found that VAT was related to ALT and GGT independently of IR. Therefore, the relationship between VAT and IR requires further investigation.
5. Conclusion
This study highlights that VAT and FFA are independent risk factors for NAFLD in patients with T2DM. Among these, VAT emerges as a particularly reliable predictor for screening NAFLD. Importantly, these findings underscore the need to expand NAFLD screening efforts beyond overweight and obese individuals to include nonobese and lean individuals.
Ethics Statement
Ethical documents related to human subjects involved in this study were approved by the Ethics Committee for Clinical Research of the First Affiliated Hospital of Bengbu Medical University. All participants signed informed consent prior to participation.
Conflicts of Interest
The authors declare no conflicts of interest.
Funding
This research did not receive any specific funding.
Acknowledgments
The authors would like to thank all the patients who participated in this study.
Open Research
Data Availability Statement
The data that support the findings of this study are available from the corresponding author upon reasonable request.


