Analysis of Structural Characteristics of the HALE Joined-Wing Configuration UAV
Abstract
This study focuses on a high-altitude long-endurance (HALE) joined-wing configuration UAV and completes a preliminary structural design based on aircraft design indices and the fundamental principles of aircraft structure design. Based on the preliminary structural design scheme and aerodynamic shape, a structural finite element model and a vortex lattice aerodynamic analysis model of the UAV are established, and the aerodynamic loads in typical states are obtained. The aerodynamic loads of the UAV are applied to a finite element model using the multipoint row method, and the structural static characteristics are obtained. The study further explores typical structural dynamic characteristics, including natural mode, static aeroelastic, flutter, and gust response characteristics. A comparison with the structural characteristics of a conventional configuration UAV with the same structural weight reveals that the HALE joined-wing configuration UAV exhibits significant advantages in structural stiffness, mode characteristics, flutter characteristics, and static aeroelastic characteristics, whereas the gust response characteristics are essentially equivalent to those of the conventional configuration. This superiority can be attributed to the reduced wingspan while providing the same lift and effective support effect of the rear wing on the front (Frt) wings, which enhances the structural stiffness of high-aspect-ratio HALE UAVs. This configuration is particularly suitable for deployment in high-subsonic HALE configurations that require close coordination with conventional tactical aircraft. By comparing with the structural characteristics of the conventional configuration UAV with equal structural weight, the paper comprehensively analyzes the structural characteristics of the HALE joined-wing configuration and obtains the advantages and disadvantages of applying the joined-wing configuration in HALE aircraft and defines the design direction, which lays a solid foundation for the engineering application in the next stage.
1. Introduction
As an unconventional configuration, the joined-wing configuration has gained increasing attention in the design of high-altitude long-endurance (HALE) aircraft. For a HALE aircraft, it is usually necessary to adopt a high-aspect-ratio layout to reduce the influence of induced drag. However, this choice can lead to serious structural and aeroelastic problems, and the potential for improving the aircraft lift–drag ratio by increasing the wing’s aspect ratio is limited.
The joined-wing configuration, which features two wings, allows for the allocation of wing area to the front (Frt) and rear wings, thereby achieving the same lift with a 20%–30% reduction in wingspan compared with conventional configuration aircraft. The rear wing supports the Frt wing, and the connection between them forms a structural framework that is similar to a torsion-resistant wing box, thereby increasing the stiffness of the wings and reducing their structural weight. This not only effectively reduces the difficulty of controlling elastic deformation but also reduces the technical difficulty of the manufacturing process and material selection to significantly surpass the potential aspect ratio increase achievable with the conventional configuration. Additionally, the large sweep angle of the wings of the joined-wing configuration effectively reduces the wave resistance during high-subsonic-speed flight, which significantly improves its flight speed compared with that of the conventional configuration. Hence, the joined-wing configuration meets the needs of tactical use.
The joined-wing configuration aircraft was proposed by Wolkovitch in the 1970s [1]. Since then, both domestic and foreign experts have conducted extensive research on its structural aspects [2–14]. Livne compared the structural characteristics of various unconventional aircraft configurations. A 2002 study by Patil and Hodges [10] in the United States explored the flutter speed of a joined-wing configuration aircraft, revealing its correlation with the connection positions of Frt wings and rear wings as well as the wing sweep angle. When the wingspan of the plane was constant, the flutter speed decreased with a decreasing wing sweep angle. The closer the connection positions of two wings to the wingtip, the lower the flutter speed. Reichenbach, Castelluccio, and Sexton [11] conducted wind tunnel tests on the structural characteristics of the joined-wing configuration sensor aircraft and obtained quite a number of conclusions with reference values. Zhang et al. [12] conducted a study on the trim problem arising from the influence of the aeroelasticity of the joined-wing configuration UAV and investigated the change characteristics of the lift and moment characteristics of the Frt wing and rear wings, as well as their influence on the longitudinal stability. Samuels [13] at the University of Cincinnati further studied the nonlinear characteristics of the structure of a high-aspect-ratio joined-wing configuration aircraft using the ANSYS commercial finite element software. It showed that the joined-wing configuration can effectively reduce wing deformation, albeit with increased stress at the Frt wing and rear wing joint sections. The results indicate that the maximum difference between the linear and nonlinear calculation methods is small. However, small structural deformations of the wings of the joined-wing configuration aircraft can cause significant changes in the aerodynamic loads. Therefore, it is necessary to use nonlinear analysis methods to calculate the structural displacement. Cheng et al. [15] used the data interaction method to obtain the accurate aerodynamic load of the nonplanar wing on the basis of the high-fidelity computational fluid dynamics (CFD) and the structural finite element method and simulated the static indeterminate structure of the joined-wing configuration UAV to study the structural hydrostatic properties. In this paper, the dynamic aeroelastic properties of a flexibly joined-wing configuration aircraft are investigated, and the interaction of the lifting surfaces of such an aircraft and its influence on the aeroelastic behavior of the aircraft are discussed using a low-order geometric nonlinear aeroelastic simulation tool [16]. These studies have a good guiding effect on the research of this paper.
However, there are also some shortcomings in the research of the above papers, which usually focus on the study of the structural characteristics of the unconventional configuration. The structural model established by the reference usually adopts only a simple fishbone beam model and a simple solid model, and its structural arrangement and cutting are quite arbitrary, usually without considering engineering constraints.
Such research usually only has qualitative analysis significance, which may lead to the loss of a large number of structural details, and usually does not consider the actual mass distribution and installation during the research; especially when the mode characteristics and static aeroelastic characteristics of the structure, flutter, and gust response characteristics of the UAV are closely related to the structural stiffness and mass distribution, the conclusion will be greatly biased.
This study focuses on a HALE joined-wing configuration UAV based on previous research findings. By using a comprehensive structural design and finite element modeling, this study analyzes the structural static characteristics and some typical structural dynamic characteristics of the joined-wing configuration, including normal mode, static aeroelastic, flutter, and gust response characteristics. The advantages and disadvantages of the joined-wing configuration applied to the HALE UAV are comprehensively analyzed by comparing them with the structural characteristics of a conventional configuration UAV with equal takeoff and structural weight, which provides theoretical support for the detailed structural design.
2. The Configuration and the Finite Element Modeling
2.1. The Configuration
The subject of the study is a HALE joined-wing configuration UAV. The macroscopic characteristics of this UAV are as follows: (1) joined-wing configuration; (2) the Frt wing is swept and has dihedral, and the rear wing is swept forward and has a cathedral; (3) the rear wing is connected to the 60% span of the Frt wing; (4) high aspect ratio; (5) V-tails; and (6) the nose top is equipped with a satellite antenna and synthetic aperture radar located at the nose bottom.
For HALE aircraft, it is particularly important to select airfoils with low drag and high lift-to-drag ratio characteristics at subsonic speeds. Simultaneously, the thickness of the airfoil has an extremely significant impact on the structural arrangement of the UAV. Considering the aerodynamic and structural design requirements, the HALE joined-wing configuration UAV Frt wing selected an airfoil that was approximately 12% thicker than the Global Hawk UAV [8] airfoil. In contrast, the rear wing with a relatively small aspect ratio utilizes an airfoil that is approximately 8% thinner than that of the Global Hawk UAV. The joined-wing configuration UAV is shown in Figure 1.

For comparison, a HALE conventional configuration UAV was designed with the same take-off weight and structural weight as the joined-wing configuration UAV. Table 1 lists the parameters of both UAV configurations.
| Parameters | The joined wing configuration | The conventional configuration |
|---|---|---|
| Takeoff weight | 4800 kg | 4800 kg |
| Span | 21 m | 28 m |
| Chord of the Frt wing | 0.85 m | 1.1 m |
| Aspect ratio of the Frt wing | 25 | 25.5 |
| Chord of the rear wing | 0.8 m | |
| Aspect ratio of the rear wing | 13.5 | |
| Wing area | 33.5 m2 | 29 m2 |
| Cruising speed | 0.8 Ma | 0.6 Ma |
| Flight altitude | 20 km | 18 km |
In the selection of flight parameters, the joined-wing configuration UAV exhibited a significantly higher flight speed and altitude than the conventional configuration, representing a crucial advantage. Taking the Global Hawk UAV as an example, its cruising flight speed can only reach Ma = 0.6. When the speed increases above Ma = 0.6, the wing will show obvious shockwaves, owing to the compressibility of the airflow, which seriously affects the aerodynamic performance.
Unlike conventional configurations, the joined-wing design overcomes issues related to shockwaves caused by compressibility at high speeds. The shockwave resistance at high subsonic speeds can be effectively reduced by appropriately selecting the sweep angles of wings. This enables the joined-wing configuration UAV to achieve a higher flight speed of Mach 0.8, which is comparable to the cruising speed of the main tactical aircraft, and can better coordinate with various aircraft to achieve better tactical effects. A higher speed also allows the UAV to achieve a higher flight altitude, which further improves its reconnaissance coverage. Moreover, the joined-wing configuration UAV significantly reduces its wingspan when the wing area increases, compared with the conventional configuration, which is also advantageous for the structural design of the UAV and contributes to its overall efficiency and performance.
2.2. The Structural Preliminary Design
The preliminary designs of the joined-wing configuration and the conventional configuration were compared. The characteristics of the HALE UAV with high aspect ratios necessitate the use of multibeam wing structures. The bending moment is shared by several beams with different stiffness values, and the torsion is borne by multiple closed-cell structures. Given the relatively small chord length, the longitudinal components of the two wings are primarily composed of three C-shaped wing beams, whereas the conventional configuration UAV employs four beams. Both configurations use the composite laminate structure of a carbon fiber honeycomb sandwich for the wing skin and the hot-pressing method of a carbon fiber foam sandwich to process the wing ribs. Finally, an integrated molding technology is adopted to process large wings. The structural forms of the aircraft tails are similar.
For ease of comparison, the fuselages of the two UAV configurations had the same structural weight and structural forms. The fuselage skin adopted a carbon fiber honeycomb structure with a large thickness and formed a box section with a truss beam and bulkheads made of carbon fiber foam sandwich composite materials. This structure supports the engine, antenna, electronic equipment, fuel tank, and landing gear of the aircraft. However, considering the differences in the wing–fuselage connection sections between the two configurations, the arrangement of the fuselage bulkheads also differed.
A structural finite element model was established by loading concentrated masses of satellite communication antennas and engines onto the model using the model predictive control (MPC) method. The fuel, landing gear, and airborne equipment masses were loaded into the finite element model via direct node loading. The finite element model, as depicted in Figure 2(a), included the simulated skin, rib web, and beam web of the wing using quadrilateral shell elements, whereas the girders, beam flanges, and rib flanges were simulated using section beam elements. The model comprises 45,158 finite elements, including 21,412 shell elements, 17,302 quadrilateral shell elements, 4110 triangular shell elements, 21,746 beam elements, and 752 centralized mass units. For comparison, a conventional configuration structural finite element model is established and shown in Figure 2(b).
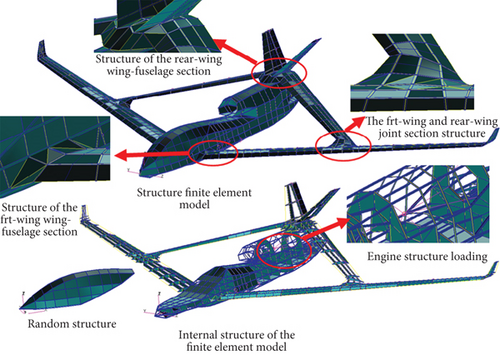
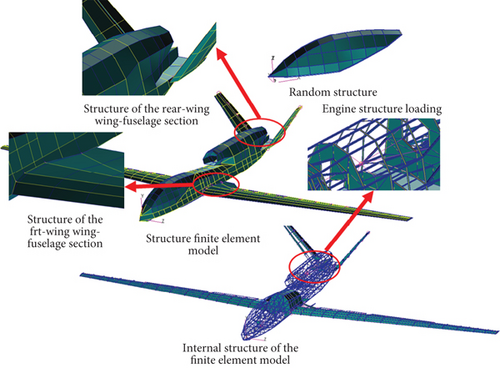
The main material properties used are shown in Tables 1, 2, and 3.
| Material | Modulus of elasticity | Poisson | Density |
|---|---|---|---|
| 7075 aluminum alloy | 71.5 GPa | 0.3 | 2800 kg/m3 |
| Titanium alloy | 118 GPa | 0.3 | 4500 kg/m3 |
| Foam | 0.1 GPa | 0.2 | 73 kg/m3 |
| Parameter | Value | Parameter | Value | Parameter | Value |
|---|---|---|---|---|---|
| Density | 1760 kg/m3 | ν12 | 0.24 | G12 | 22 GPa |
| E11 | 295 GPa | ν13 | 0.28 | G13 | 5.05 GPa |
| E22 | 20 GPa | ν23 | 0.24 | G23 | 22 GPa |
| E33 | 20 GPa |
3. Analysis of Structural Static Characteristics
The takeoff weight of the two configurations of UAVs in this paper is exactly the same. So, the structural cutting is required to be carried out with this constraint in the structural design of the UAVs in both configurations, and the analysis of the structural static characteristics of the cutting results is the basic process for the preliminary verification of the structural design results. At the same time, the conclusions obtained by comparing the UAVs in both configurations under the constraint of equal structural weights are more practical.
As the primary component generating aerodynamic lift, the wing encounters two main types of external loads: distributed loads, including aerodynamic forces and the wing structure’s self-mass force, and concentrated loads, such as those from the racks and joints. The mass force in the distributed and concentrated loads can be set directly in the finite element model, whereas the aerodynamic load in the distributed loads must be obtained via external calculations.
In a static analysis, the focus is on structural static characteristics, such as stress, strain, torsional deformation, and internal force distribution under different overload conditions (aerodynamic load/gravity). To satisfy these conditions, it is necessary to obtain the aerodynamic loads corresponding to the overload conditions and load them onto a finite element model for calculation.
3.1. Methods of Obtaining Aerodynamic Loads
In this study, a modified aerodynamic analysis program based on the open-source vortex lattice method was adopted. This program solves linear algebraic equations for the intensity of horseshoe vortices formed by all control points on the wing to obtain the intensity of horseshoe vortices on each vortex lattice and then obtain the aerodynamic coefficient of the wing.
Simultaneously, by analyzing the intensity of the horseshoe vortex on the vortex lattice of the Frt wing and the distance between the two wings and then adding a correction factor, the aerodynamic interference effects were calculated.
The vortex lattice method was used to calculate the motion and mechanical properties of the fluid by arranging vortex lines on the simulated surface to form a vortex lattice system. The calculated lift and pitch moment coefficients were consistent with the conclusions derived from the thin-wing theory. The three-dimensional vortex lattice method is an extension of the two-dimensional case. Numerous practical results show that for most uncomplicated topology flows, the vortex lattice method has the advantages of simple modeling and low computational resource consumption.
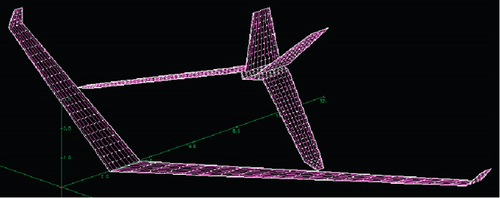
A joined-wing configuration UAV’s vortex lattice model of a UAV is established. The middle arcs of all control section airfoils on the wings were linearly interpolated to form a lifting surface with a certain curvature, and the vortex lattice was arranged on this lifting surface. The Frt wing is divided into 25 strips along the spanwise direction, each of which is subdivided into 10 vortex panels along the chord, which is divided into 15 strips along the spanwise direction, each of which is subdivided into 10 vortex panels along the chord. Moreover, the tail wing is divided into 10 strips along the spanwise direction, each of which is subdivided into 10 vortex panels along the chord. The aircraft was divided into 1000 aerodynamic panels. The spanwise and chord vortices are distributed according to the cosine function, where the vortices are denser in areas with high lift gradients, such as the wingtips and leading and trailing edges of wings, and sparser in areas with low lift gradients to capture wing lift changes more accurately. Considering the relatively minor impact of the fuselage on the lift characteristics of the entire aircraft, to simplify the calculations, the influence of the fuselage is neglected. The vortex lattice model is illustrated in Figure 3.
To verify the accuracy of the aerodynamic loads obtained using the vortex lattice model method, the aerodynamic data obtained were compared with those obtained using the turbulence model numerical simulation method to solve N–S (Navier–Stokes) equations. First, a semimodeled unstructured grid of a joined-wing configuration UAV without a fuselage was established. The schematic follows in Figure 4.
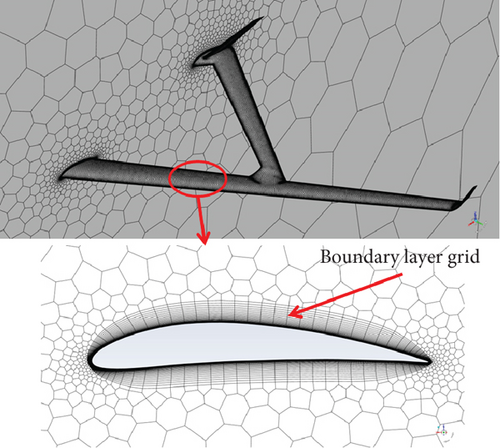
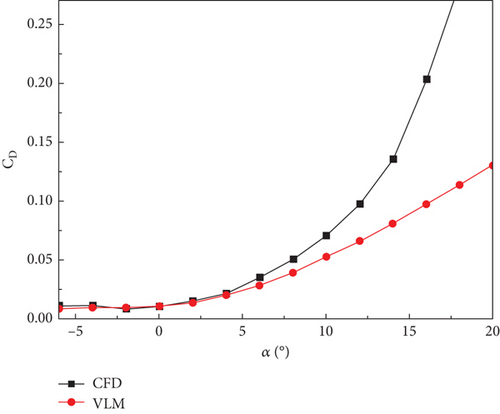
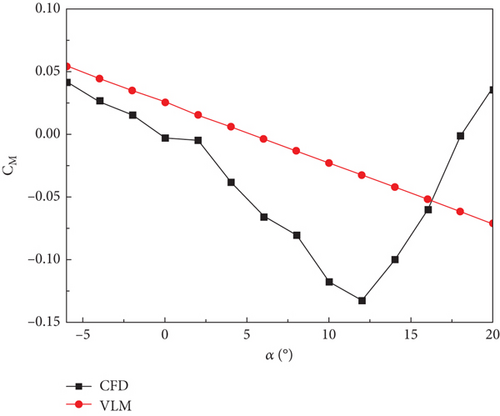
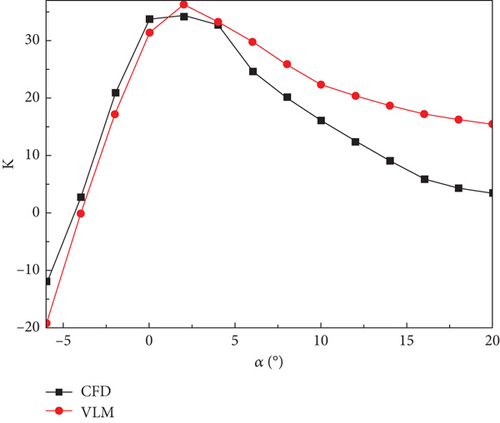
To ensure the calculation accuracy and thickness of the first layer of the wall mesh, an O-mesh was generated on the surface. Simultaneously, the grid was encrypted on the edges and joint sections of the two wings. Considering the need for viscosity calculations, the distance between the first layer grid and the wall surface is guaranteed to be y+ ≈ 1, and the number of calculation grids is approximately 5.26 million. The state of H = 20,000 m, Ma = 0.8, was chosen for the numerical simulations, where the Reynolds numbers were 1.6 × 10⁶. The longitudinal aerodynamic characteristics of the UAV were simulated using the numerical calculation method of the k − w − sst turbulence model [17] and compared with the computed data using the vortex lattice model, as shown in Figure 5.
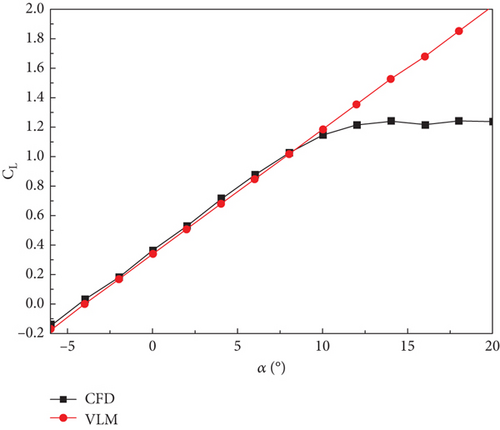
The calculation results show that when the wing does not have an obvious flow separation below α = 8°, the lift-line characteristics obtained are consistent with the results obtained via numerical simulation. In general, the lift values obtained by the vortex lattice method were slightly smaller than those obtained via CFD simulation.
There is a large gap between the vortex lattice method and numerical simulation results in the drag characteristics calculation. During the calculation, resistance characteristics equivalent to the actual characteristics were obtained by adding the zero-lift resistance. As shown in Figure 5(b), drag data that fit together quite well with the numerical simulation can be obtained by using the vortex lattice method and adding the zero-lift resistance method.
As the angle of attack increases, the flow separation occurs after α = 8°, and the error between the lift and drag characteristics estimated by the vortex lattice method and the numerical simulation increases dramatically, which shows that the large angle of attack numerical simulation ability of the vortex lattice method is flawed, leading to certain errors in the analysis of large overload deformation. However, it still has important referential significance.
The pitch moment characteristic curve calculated using the vortex lattice method is linear, and the numerical error between it and the CFD numerical simulation result is large. This is mainly because the UAV with the combined wing layout has two wings, and a small error in the estimation of the influence of the two wings has a significant impact on the pitching moment characteristics.
However, in the analysis of the structural characteristics, the lift characteristics are the main factor, and the effects of the drag and pitch moment characteristics on the UAV structure are limited. Therefore, in the initial design phase, the vortex lattice method calculation program used in this study can obtain the aerodynamic loads relatively accurately and rapidly.
3.2. Aerodynamic/Structural Load Conversion
In the analysis of a structure, the computational environment of aerodynamics and structure is different, and the direct application of the calculated aerodynamic loads to finite element nodes is not feasible. Therefore, the aerodynamic loads of each element must be converted into loads on the equivalent nodes of a structural finite element.
This study employed a multipoint-row method [18] to convert the lift on each aerodynamic element into an equivalent nodal force of the structural model. The transformed finite element node forces are equivalent to the aerodynamic static force. A schematic of the structural load obtained using the multipoint-row method is shown in Figure 6.
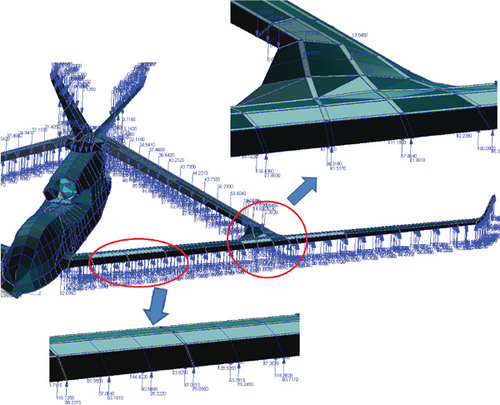
As shown in Figure 6, the aerodynamic forces have been reasonably converted into loads and evenly loaded onto the nodes in the structural model.
3.3. The Structural Static Characteristic Analysis
In this study, MSC Patran was used for structural finite element modeling and postprocessing, MSC Flds was used for aeroelastic modeling, and MSC Nastran was used for the calculations and analyses.
After conducting a flight mechanics simulation of the longitudinal maneuvering of the UAV, the overload boundary data were calculated. The results showed that under the condition of 1 g overload, α = 1.5° and δe = 0°. Under the condition of 3.8 g overload, α = 16° and δe = 14.5°. For comparison, the angle of attack of the conventional configuration aircraft under 1 g overload is α = 2.5° and δe = 0°. Under the condition of 3.8 g overload, α = 14.5° and δe = 15.2°.
Different angles of attack and elevator deviation states yielded different lift distributions and generated different local loads. Different loads can effectively affect the structural and static characteristics of a UAV. After the aerodynamic analysis of two typical overload situations of the joined-wing configuration UAV, a pressure distribution diagram was obtained, as is shown in Figure 7.
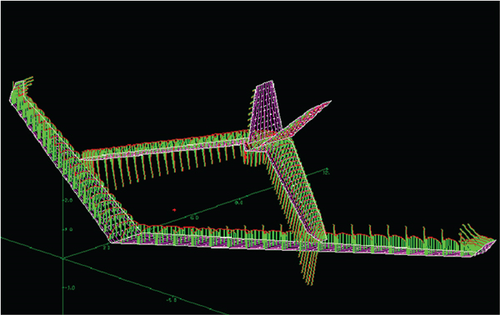
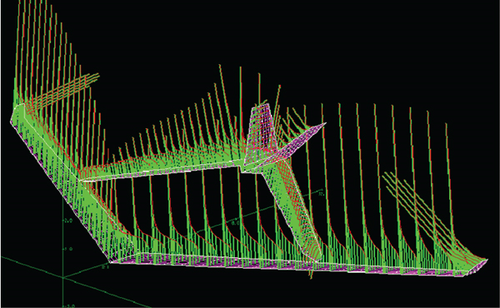
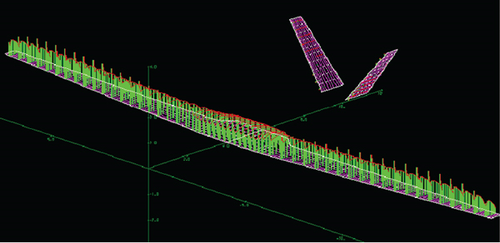
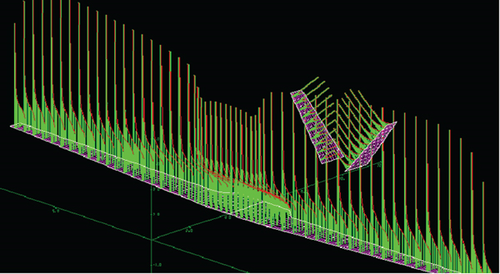
The green line in Figure 7 represents the pressure distribution of the two UAVs. There is a significant difference between the pressure distributions at α = 1.5° and α = 16°. This can lead to significant differences in the structural deformation caused by aerodynamic loads, even when the wing generates the same lift and its impact on the torsional deformation is greater. Therefore, when calculating aircraft overload, it is necessary to consider the aerodynamic load distribution under this overload situation in conjunction with flight mechanics.
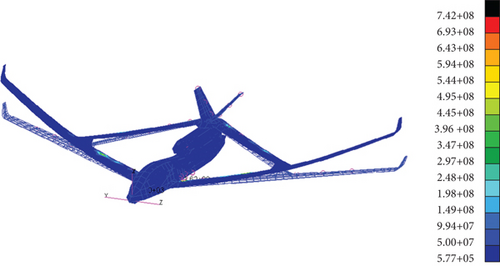
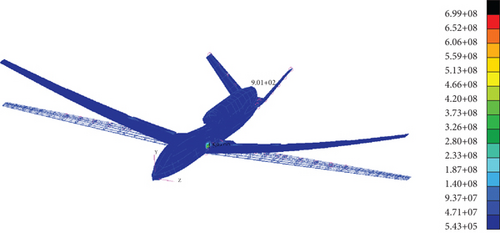
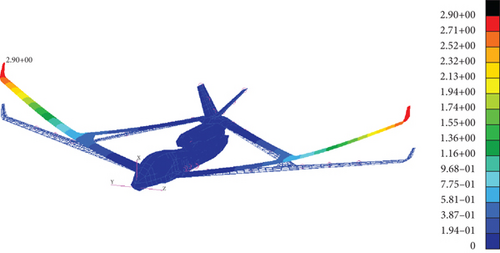
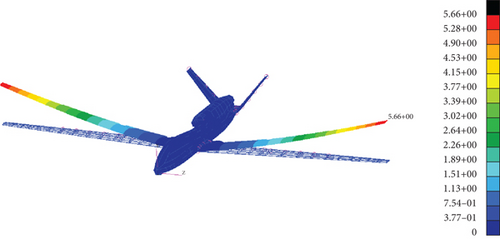
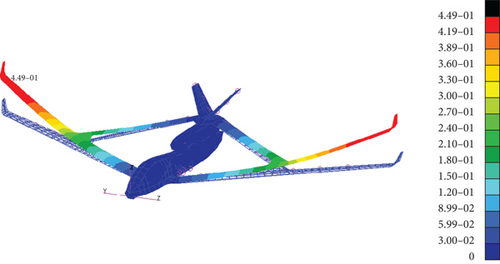
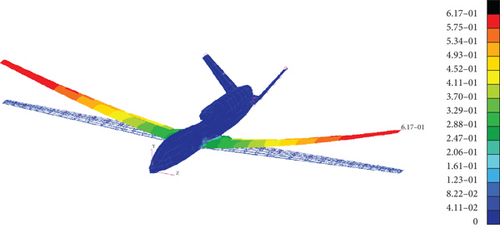
The calculated pressure distribution was converted into aerodynamic loads and applied to the structural model. The structural static characteristics under 1 and 3.8 g overloads were obtained via calculation and analysis. Cloud images of the structural stress, strain, and torsion deformation of the two types of UAVs under 3.8 g overload are shown in Figure 8. In addition, the structural static characteristics data are summarized in Table 4.
| Overload | Stress (MPa) | Deflection (m) | Torsional deformation (°) | |||
|---|---|---|---|---|---|---|
| Joined-wing | Conventional | Joined-wing | Conventional | Joined-wing | Conventional | |
| −1.5 g | 302 | 275 | −1.34 | −2.47 | −8.04492 | −11.03598 |
| −1 g | 223 | 212 | −1 | −1.7 | −4.2975 | −6.3603 |
| 0 g | 85 | 81 | −0.15 | −0.25 | 0.5157 | 0.3438 |
| 1 g | 195 | 184 | 0.76 | 1.41 | 4.05684 | 8.4231 |
| 2 g | 391 | 361 | 1.55 | 2.99 | 7.35732 | 11.75796 |
| 2.5 g | 488 | 453 | 1.91 | 3.84 | 10.17648 | 13.20192 |
| 3 g | 591 | 541 | 2.3 | 4.62 | 12.8925 | 15.6429 |
| 3.8 g | 742 | 699 | 2.9 | 5.66 | 15.43662 | 21.21246 |
Table 1 shows that during the 2.5 g overload test, the maximum deflection of the wingtip of the C919 aircraft is about 3 m, the span of the C919 aircraft is 35.8 m, and the maximum deflection of the wingtip is about 16.8%. For those HALE UAVs studied in this paper, under 2.5 g overload, the maximum deflection of the wingtip of the joined-wing configuration and the conventional configuration is 18.2% and 27.4%, respectively.
The HALE aircraft is a typical aircraft with greater flexibility, and its maximum deflection deformation is greater than that of conventional aircraft. From the data point of view, the model established by the author is basically reasonable.
Under 3.8 g, the maximum stress is approximately 742 MPa, all of which occur nearby the root of the wing. For comparison, the maximum stresses under these overloads in the conventional configuration were 699 MPa, respectively, and also occurred near the wing root. Under the entire overload envelope range, the joined-wing configuration maximum stress was comparable to or slightly greater than that of the conventional configuration. This is attributable to the smaller actual heights of the Frt wings and rear wings at the root compared with the conventional configuration. In addition, the three-beam layout used in the joined-wing configuration had a significantly smaller effect on the local stress distribution than did the conventional configuration using a four-beam layout. This method failed to effectively utilize the advantages obtained by distributing loads to the wings of the joined-wing configuration. Therefore, in the structural design, even at some cost, a smooth transition should be designed at the wing–fuselage connection section to increase the chord length and thickness of the wing root as well as improve the structural strength of the UAV.
Under 3.8 g, the maximum stress reached 742 MPa, and according to the safety factor of 1.5, it reached 1113 MPa, which is close to the allowable buckling strength of T1000 carbon fiber. Therefore, the use of Ti alloys for local reinforcement is recommended. However, considering that such aircraft usually limit their maneuvering overloads to approximately 2.5 g during flight, the results of the preliminary design meet the structural design requirements.
By looking at the deflection data in Table 1, the maximum strain was much smaller than that of the conventional configuration for the entire overload envelope range, both in terms of absolute values and inverted angles.
For the torsional deformation, when the spanwise deformation of the wing was calculated, the torsional deformation in most areas of the wing direction was smaller than that of the conventional configuration because of the supporting effect of the two wings.
The extraction of bending and torsional deformation of the middle beam, the Frt wings, and the rear wings’ deformation distribution curve along the span direction is shown in Figure 9.
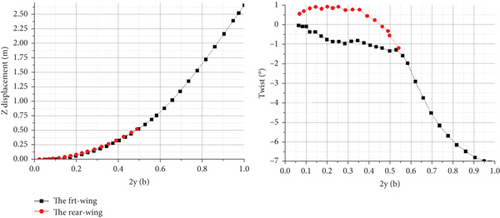
The transverse axis was set as the different stations along the spanwise direction, where b is the span length and 2y/b is the relative value of the half-spanwise position. In a given flight state, the aerodynamic load causes upward bending deformation of the wing structure. As can be seen from Figure 9, the bending deformation of the wing gradually increases from the wing root to the Frt wing and rear wing connect section in the middle, and the deformation curves of the Frt wings and rear wings are almost identical.
The variation characteristics of the spanwise twist angle of the joined-wing configuration UAV are different from those of a conventional configuration. The joined-wing configuration’ Frt wings swept forward produces a negative twist, while the rear wings swept produces a positive twist. Due to the mutual support of the Frt wings and rear wings, the torsion deformation of the inner section is relatively small, while the torsion deformation of the outer wing section of the Frt wings increases rapidly. So, the Frt wings are easy to occur in the “aileron reverse effect” phenomenon. The rear wings of the joined-wing configuration produce positive torsion under the action of lift, the angle of attack of the rear wings increases further, and the aerodynamic force of the rear wing is easy to occur in the “torsion divergence” phenomenon. This characteristic is also compounded by the characteristic of the structural and aerodynamic coupling of the typical swept-forward wing and swept wing.
Under aerodynamic loads, the force and transmission of the wing structure are reflected by the internal forces of the structural elements. Under the action of a lift, the wing undergoes upward bending deformation, and the force situation is reflected by the axial force of the upper and lower edge strips of the wing beam.
Fourteen observation sections were taken from the root to the wingtip of the Frt wing. In addition, nine observation sections were selected from the wing root to the joint of the Frt wing and rear wings. Simultaneously, 13 observation sections were selected in the conventional configuration. The vertical axis represents the axial forces acting on the beam flanges. A positive axial force value indicates that the edge strip is subjected to a tensile load, and a negative value indicates that the edge strip is subjected to a compressive load. The data were extracted, and an axis diagram was drawn, as shown in Figure 10.
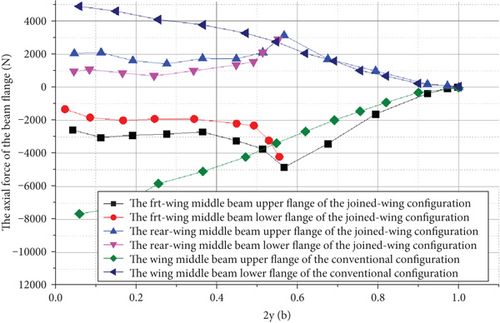
As the aerodynamic load at the wingtip was small, the internal force of the wingtips was also small. Beyond the joint sections, the axial forces of the upper and lower edge flanges of the middle beam of the wing gradually increased. At this point, the axial force distribution pattern of the wing was basically the same as that of the wing in the conventional configuration, and the axial force distribution patterns at the joint sections were significantly larger than those in the conventional layout configuration. However, as the position moved to the wing root, Figure 10 shows that the axial force of the beam flange of the Frt wing and rear wing began to decrease significantly after the peak in the joint section, and the increase in the beam flange axial force in the inner wing segment was significantly smaller than that in the conventional configuration. The main reason is that an oblique plane is formed by the swept dihedral Frt wing and the swept forward cathedral rear wing. Therefore, the lift force acting on the wing can be divided into the in-plane component in the Frt wing and rear wing planes and the out-of-plane component perpendicular to this plane. The in-plane component was balanced by the counterforce generated by the triangular truss structure formed by the Frt wing, rear wing, and fuselage supporting each other. The inner wing section primarily suffers from bending moments generated by the Frt wing outer wing section, which results in a significant reduction in the tensile and compressive axial forces on the upper and lower edge flanges of the center beam of the Frt wing inner section and rear wing section because of its distribution. This type of force is clearly different from the typical stress on the upper wing and tension on the lower wing in a conventional cantilever beam wing configuration.
The structural static analysis results show that the joined-wing configuration can effectively improve the structural stiffness of HALE UAVs. The amounts of stress, deflection, and torsional deformation were significantly smaller than those of the conventional configuration. The mutual support between the Frt wing and rear wing can also significantly reduce the structural stress on the inner wing section. Overall, the structural static characteristics were significantly better than those of the conventional configuration UAV.
4. Analysis of Structural Dynamic Characteristics
HALE UAVs have high flexibility and low structural stiffness, which can lead to serious aeroelastic problems. Therefore, the structural dynamic characteristic analysis is necessary. In this study, the static aerodynamic characteristics, flutter characteristics, gust response characteristics, and structural dynamic characteristics were compared with those of the conventional configuration.
4.1. Analysis of Natural Mode Characteristics
Through a normal mode analysis, the mode shapes and frequencies can be obtained. The mode analysis of the structure is essentially the calculation of the eigenvalue of the vibration equation, which is the square of the natural frequency of the structure. The mode frequencies are those at which the structure is prone to vibration when disturbed. The basis of flutter analysis is to obtain each number mode and natural frequency of the structure through mode analysis. Therefore, the natural mode characteristic analysis is necessary.
In this study, the Lanczos [19] real eigenvalue analysis method is used. The structural natural modes of the two configurations were analyzed. Because of the use of nonfixed support constraints, the first six mode frequencies are close to zero. Therefore, they can be ignored. The analysis results for the first six normal modes are calculated in Figure 11.
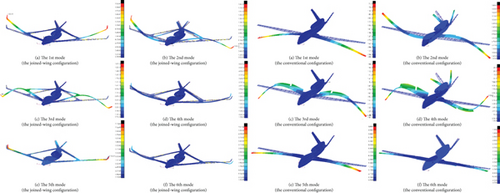
The normal mode frequency and model data of the joined-wing configuration and the conventional configuration are shown in Tables 5 and 6.
| Mode number | Mode shape | Mode frequency |
|---|---|---|
| The 1st mode | Vertical first-order bending mode | 3.01 Hz |
| The 2nd mode | Vertical first-order antisymmetric bending mode | 4.98 Hz |
| The 3rd mode | Vertical second-order bending mode | 7.76 Hz |
| The 4th mode | Vertical third-order bending mode | 9.78 Hz |
| The 5th mode | Horizontal first-order bending mode | 10.14 Hz |
| The 6th mode | Horizontal first-order antisymmetric bending mode | 10.87 Hz |
| Mode number | Mode shape | Mode frequency |
|---|---|---|
| The 1st mode | Vertical first-order bending mode | 1.45 Hz |
| The 2nd mode | Vertical first-order antisymmetric bending mode | 3.92 Hz |
| The 3rd mode | Vertical second-order bending mode | 6.21 Hz |
| The 4th mode | Vertical second-order antisymmetric bending mode | 7.94 Hz |
| The 5th mode | Horizontal first-order bending mode | 8.34 Hz |
| The 6th mode | Horizontal first-order antisymmetric bending mode | 9.7 Hz |
Figure 11 shows that, except for the fourth mode, the mode shapes and arrangement order of the other fifth number modes are similar. This is mainly because the joined-wing and conventional configurations are both typical high-aspect-ratio layouts, the arrangement of beams and ribs is similar, and the normal mode shows more typical mode characteristics inherent in high-aspect-ratio aircraft. The support effect of the rear wing eliminates the vertical second-order antisymmetric bending mode, similar to the fourth mode of the conventional configuration, and instead generates a third-order bending mode with a higher frequency separation vibration of the Frt wing and rear wings.
For a high-aspect-ratio aircraft, the most common cause of flutter is the coupling of the torsional and bending modes of the wings. Improving the bending resistance of a wing entails significant costs. Therefore, in the structural design, by carefully selecting the arrangement of the beam positions and using the advantages of the composite structure layup and molding, the design of the skin and stringer distribution can effectively improve the torsion resistance of the wings. Based on these results, the torsional mode was eliminated in the first six structural finite element normal mode analyses. This design method has a positive effect on improving the structural flutter speed of aircraft.
Tables 5 and 6 show that the frequency of the joined-wing configuration vertical first-order bending mode is the lowest and that its value is approximately 3.01 Hz, which is much higher than the 1.45 Hz value of the conventional configuration UAV. The frequencies of the other modes with the same number were also significantly higher than those in the conventional configuration. This phenomenon occurs mainly because, in the case of similar global parameters, the size of the joined-wing configuration aircraft can be effectively limited, which can improve the structural stiffness of the UAV.
From a data perspective, the value of the first bending mode of the joined-wing configuration UAV is still relatively small, and there is a possibility of coupling with the rigid-body short-period mode to produce body freedom flutter. Simultaneously, the frequencies of the fourth mode are close to those of the fifth and sixth modes, which may lead to the flutter.
4.2. The Structural Static Aeroelastic Characteristic Analysis
The problem with static aeroelasticity is the coupling effect between the elastic structure and aerodynamics. Its influence mainly has the following two aspects. The first type is the problems of aerodynamic torsional divergence and load redistribution. The second type is the problems of control efficiency and control reversal effects. HALE aircraft with high flexibility may experience significant deformation under the influence of aerodynamic loads during flight, which may lead to the two aforementioned issues. Therefore, it is necessary to conduct static aeroelastic characteristic analyses.
In this study, the dipole grid method (DLM) was used to obtain the aerodynamic load in the aeroelastic analysis of the Nastran software. The dipole grid mesh method [20] is commonly used for aeroelastic calculations and can be divided into subsonic and supersonic dipole mesh methods.
The subsonic DLM in the MSC Nastran software was chosen because a constant velocity pressure calculation was used in the static aeroelastic calculation, and the flight speed was subsonic.
In the analysis of flutter characteristics, it is possible to use the supersonic DLM, which applies supersonic linearization theory and is called the ZONA51 method in the MSC Nastran software.
The DLM simplifies the lifting surface into a planar terrain grid and calculates it by applying thin wing theory. The downwash points were arranged at the spanwise centerline of each trapezoidal grid to satisfy the downwash boundary conditions. The subsonic DLM has a midpoint at the 3/4 chord, whereas the supersonic dipole grid has a downwash at the 95% chord [21, 22].
During the calculation, the program automatically switches, according to the Mach number set in the software. It can simulate the aeroelastic characteristics over a wide range of velocities, from subsonic to supersonic.
The lifting surface model was established. The lifting surface model is divided into 30 regions. The unilateral Frt wing, rear wing, and tail wing were divided into 26 × 5, 15 × 4, and 6 × 4 aerodynamic panels, respectively. The aerodynamic grid and rudder surface position models are shown in Figure 12.

According to the flight envelope obtained by the simulation, the maximum velocity pressure state of the joined-wing configuration HALE UAV was determined to be at a flight altitude of H = 20 km, maximum flight speed of Ma = 0.9, sound speed of 295 m/s, air density of 0.0889 kg/m3, and velocity pressure of 3313.3 Pa. The corresponding low-altitude state under constant pressure is a flight altitude of H = 0 km, an air density of 1.226 kg/m3, and a flight speed of 71.45 m/s (Ma = 0.21).
The Mach numbers at H = 20 km and H = 0 km vary widely under constant dynamic pressure. This study employs the method of calculating the structural response in a large dynamic pressure range at H = 0 km to study the static aeroelastic characteristics of both configurations of UAVs.
The connection between the structural and aerodynamic grids was coupled using the spline interpolation method, and the static aeroelastic characteristics of the two UAV configurations within the velocity range of 1–180 m/s were calculated. The longitudinal static stability variation diagram is shown in Figure 13.
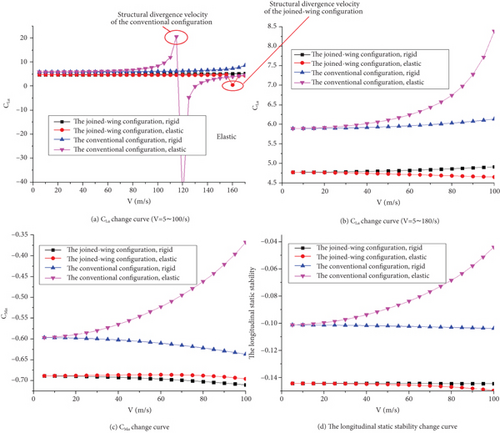
The rigid derivative is a stability derivative obtained by ignoring the elastic deformation of the aircraft structure. The elastic derivative is the stability derivative of an air-free UAV, which is a stability derivative that conforms to actual flight conditions. Under the design dynamic pressure, owing to the elastic deformation of two configurations, for the joined-wing configuration UAV, the CLα increases, the CMα decreases, and the elastic longitudinal static stability derivative is equivalent to approximately 102% of the rigid derivative. In contrast, the elastic longitudinal static stability derivative of the conventional configuration was equivalent to approximately 74.3% of that of the rigid configuration. Hence, the joined-wing configuration’s structural aerostatic deformation contributes to the improvement in longitudinal static stability [23–26].
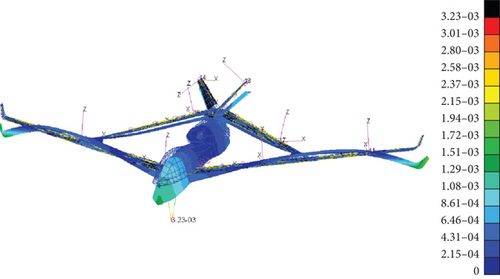
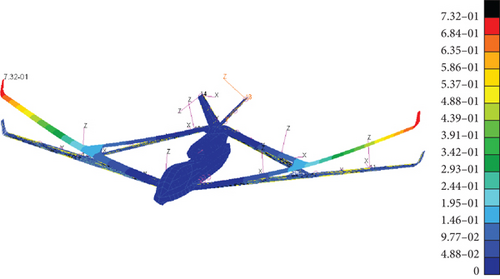
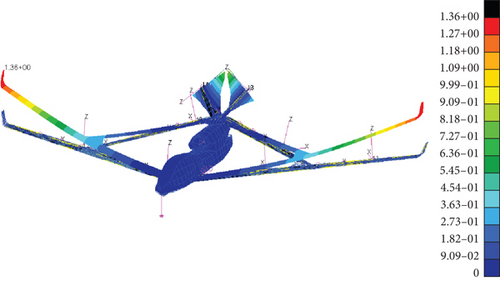
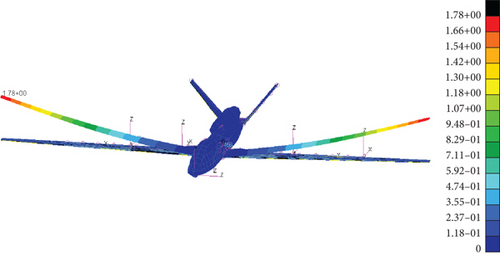
To study the reasons for this phenomenon, the displacement cloud diagrams of the multiple states of the two UAV configurations are as follows.
The change in the lift-line slope caused by the aeroelastic is mainly influenced by two factors: upturn and torsion. The displacement cloud diagram obtained via static aeroelastic analysis shows that the joined-wing configuration UAV undergoes wing reversal from down to up as the speed increases, and the bending deformation also increases significantly.
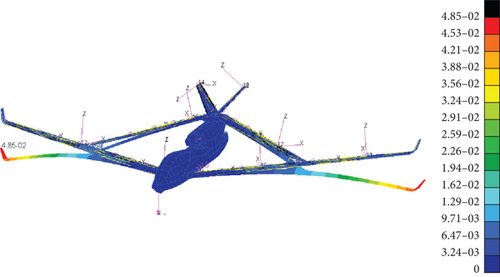
Usually, both up and down reversals of the aircraft cause a decrease in the lift-line slope. Therefore, the change in torsional characteristics caused by static aeroelasticity needs to be analyzed. The torsional distribution cloud image is expressed as shown in Figure 14.

As shown in Figure 14, the support between the Frt wing and rear wing leads to a corresponding torsional deformation, and the Frt wing has a negative torsional deformation, resulting in a loss of lift. The positive torsion deformation of the rear wing resulted in an increase in lift. The two have a counteracting effect, which inhibits the growth of the CLa of the UAV, whereas the conventional configuration UAV only produces a positive torsion deformation, which results in an increase in the lift. After the static aeroelastic deformation, the Frt wing lift decreases, the rear wing lift increases, and the resultant force point moves backward, resulting in a large increase in the nose-down moment. As a result, the CMα increases.
However, conventional UAVs do not exhibit such characteristics, and their longitudinal static stability is significantly reduced by static aeroelastic deformation. In general, static aeroelastic deformation is beneficial to the Frt wing structural design but not to the rear wing.
As shown in Figure 13(a), the joined-wing configuration UAV’s structural divergence eventually occurred at approximately 158 m/s. In Figure 15(d), the area where structural divergence occurs is in the tail, at which point the velocity corresponding to the velocity pressure exceeds the range of the maximum used, and its structural design can meet the requirements.
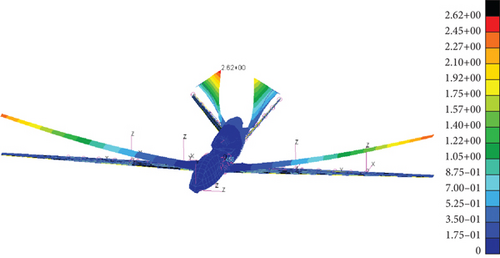
Similarly, the structural divergence of the conventional configuration UAV appears at approximately 117 m/s, and the area where structural divergence occurs is also located in the tail. Therefore, although the structure divergence speed is larger, it cannot be said that its structural divergence characteristics are definitely better than those of the conventional configuration.
The efficiencies of the main control surfaces of the two UAV configurations were analyzed. As the control surfaces were symmetrical, the main control surfaces on only one side of the wings were compared in Figure 16.
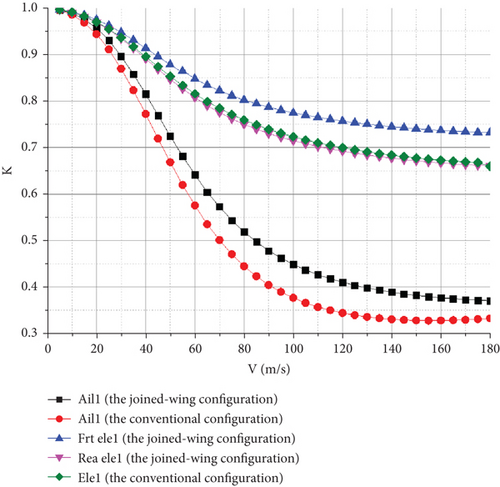
Figure 16 shows that the efficiency of the control surfaces declined rapidly. However, in both configurations, there was no aileron reversal problem in the range of dynamic pressures used. This is mainly because the layout of the aileron is relatively close to that of the interior, and the aileron is not easy to reverse. The efficiency loss of the ailerons is far less than that of the conventional configuration UAV. The control surfaces efficiency curve of the elevator shows that the control surfaces efficiency of the Frt wing was greater than that of the rear wing. This is mainly owing to the negative torsional characteristics of the Frt wing, whereas the control surfaces of the rear wing are positively torsional, and its control surface efficiency decreases significantly, even when compared with the conventional configuration. When the UAV adopts 0.8 Ma at H = 20,000 m, the dynamic pressure at this time is 2475.6 Pa, and the flight speed converted to the sea level condition is about 63.55 m/s. At this time, the aileron rudder effect is approximately 64%, and the control surface efficiency of the Frt wing and rear wing elevators are 84% and 79%, respectively, which can satisfy the flight control requirements.
Overall, the static aeroelastic characteristics were better than those of the conventional configuration UAV.
4.3. Analysis of Frequency Domain Flutter Characteristics
Flutter is a destructive self-excited vibration that results from the coupling of aerodynamic, inertial, and elastic forces. If this occurs during flight, it can cause catastrophic damage to aircraft structures. Therefore, in the structural design of an aircraft, it is important to ensure that flutter does not occur within the flight envelope. The HALE joined-wing configuration UAV is lightweight and flexible. If the design is based only on static calculations, it may cause structural damage before reaching the maximum flight speed, owing to flutter. Therefore, the structural flutter characteristics need to be carefully analyzed [27].
In this study, the P–K method was used to calculate the frequency domain flutter characteristics at altitudes of 0, 5, 10, 15, and 20 km. In the flutter analysis, the subsonic DLM is used to calculate the unsteady aerodynamic force, and the air density used in the calculation is the air density of the actual flight altitude.
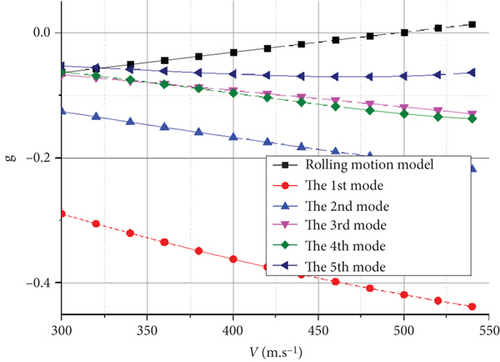
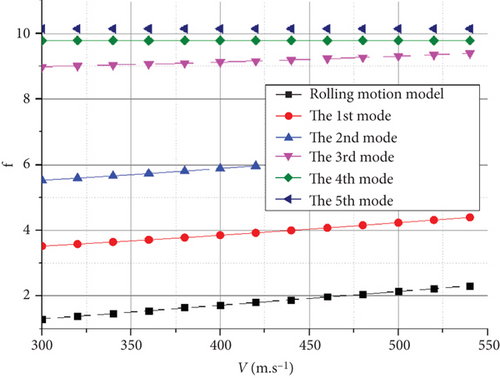
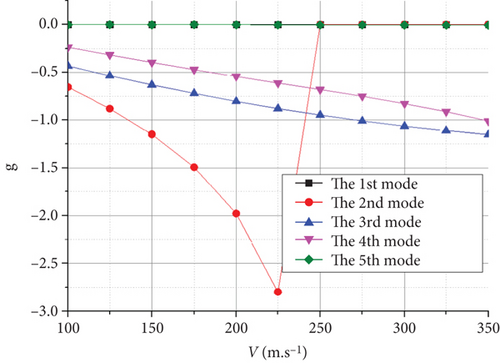
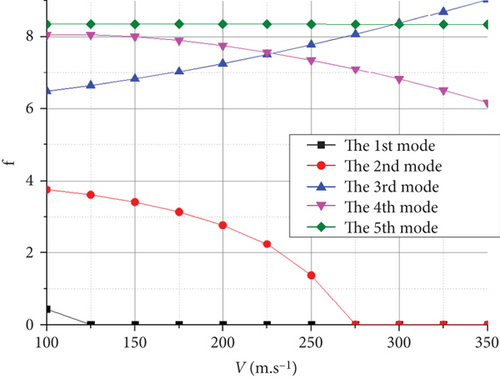
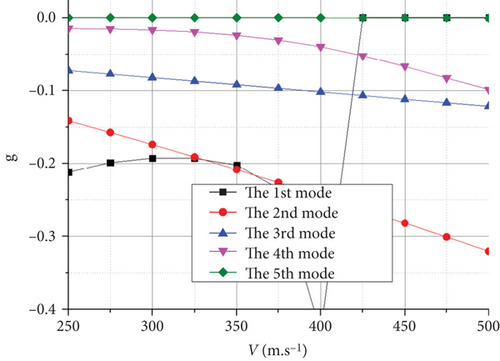
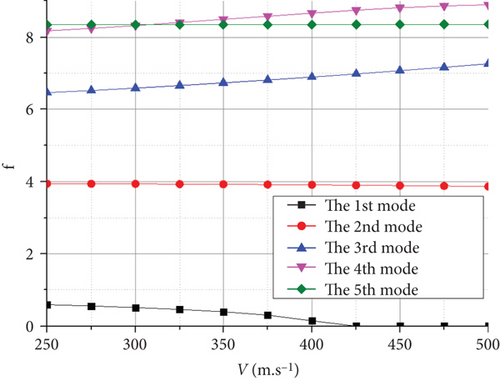
A wide search was conducted to identify the unmatched flutter speeds at each flight altitude. The flutter speed intervals were determined, subdivided, and matched. The V-g and V-f curves are shown in Figure 17.
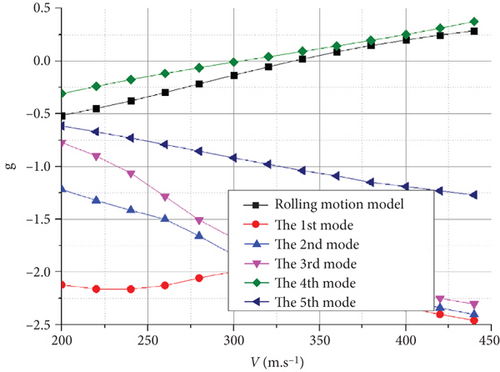
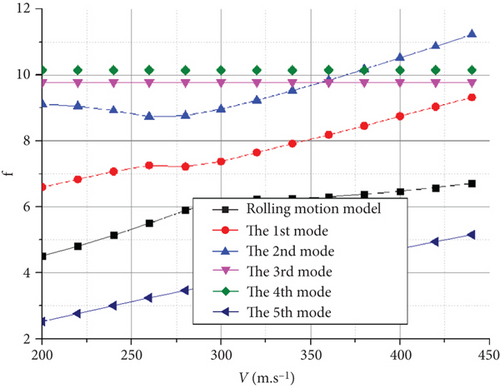
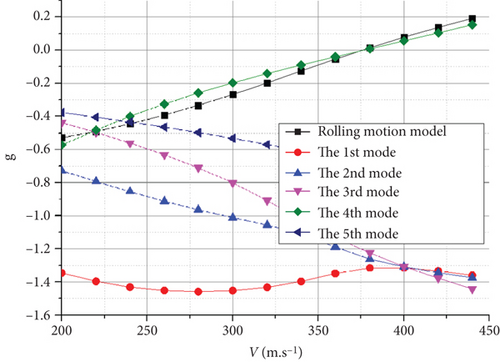
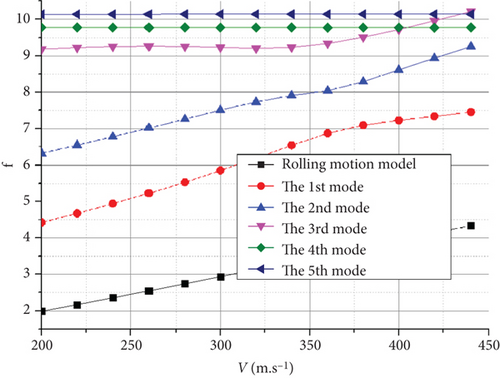
The flutter characteristics of the HALE joined-wing configuration UAV shown in Figure 17(a), at H = 0 m, the matching flutter speed was approximately 300 m/s, and its vertical third- and vertical second-order bending modes were coupled, producing flutter with a frequency of 10.2 Hz.
For UAVs with high stiffness, the high frequency of the first mode typically prevents coupling with the body freedom mode, thereby avoiding body flutter. However, this phenomenon may occur in HALE aircraft with greater flexibility. The flutter characteristics revealed that the coupling of the rolling motion mode and the first bending mode of the UAV may produce body freedom flutter.
When flying at H = 0 km, as shown in Figure 17(a), the flutter was mainly caused by the coupling of the vertical third-order bending mode and the vertical second-order bending mode. The speed at which the crossing phenomenon occurs, owing to the coupling of the rolling motion mode and the first bending mode, is greater than the above mode speeds. However, with an increase in flight altitude, the speed of the flutter caused by these two coupling forms is almost the same at approximately H = 7200 m in Figure 17(c), both of which are at approximately 380 m/s. As shown in Figure 17(e), when the altitude increased to H = 20 km, the body freedom flutter caused by the coupling of the rolling motion mode and the first bending mode became the main factor leading to flutter and caused a significant decrease in the flutter frequency from approximately 10.2 to 2.2 Hz. Because atmospheric disturbances are mostly low frequency, a decrease in the flutter frequency can lead to a significant increase in the likelihood of the UAV experiencing flutter if it accidentally enters this flight speed during flight.
The flutter characteristics of the conventional HALE UAV reveal that owing to the larger span compared with the joined-wing configuration, the stiffness of the vertical bending direction of the Frt wing is smaller. Moreover, the frequency of the vertical first-order bending mode and the vertical first-order antisymmetric bending mode of the UAV are reduced, which facilitates coupling-induced flutter.
As shown in Figure 18(a), the flutter appears as an explosive mode of the vertical first-order antisymmetric bending mode crossing at H = 0 km. Similarly, at H = 20 km, the flutter appeared as an explosive mode of the vertical first-order symmetric bending mode, as shown in Figure 18(c). The flutter occurrences in both cases were associated with the coupling of the first and second modes. Notably, the rigid-body short-period mode does not couple with the vertical first-order bending mode of the wing to produce a body freedom flutter. The flutter speeds of the UAV with the joined-wing and conventional configurations were calculated and compared, as listed in Table 7.
| Flight altitude (m) | 0 | 5000 | 7200 | 10,000 | 15,000 | 18,000 | 20,000 |
|---|---|---|---|---|---|---|---|
| Flutter speed of the joined-wing configuration (m/s) | 320 | 365 | 381 | 404 | 445 | 505 | |
| Flutter speed of the conventional configuration (m/s) | 248 | 292 | 321 | 384 | 412 | 425 |
Within the entire flight envelope, the flutter speed was significantly higher than that of the conventional configuration, making it more suitable for high-speed layout configurations. This is primarily attributed to the significantly smaller wingspan. Meanwhile, the support effect of the rear wing on the Frt wing structure increases the structural stiffness of this configuration, making it less prone to flutter. However, because of the larger wing area and smaller wing load of the joined-wing configuration, it is easier to couple with the rigid-body short-period mode to generate body freedom flutter. As a result, the UAV is more susceptible to fluttering when it accidentally reaches the flutter speed.
As shown in Table 7, the flutter speed is greater than the maximum flight speed at each flight altitude, confirming that the structural design meets the requirements of the UAV.
Since the frequency domain flutter method is a way to calculate the aerodynamic force obtained by the DLM, which is assumed to be simple harmonic motion in the frequency domain, it can usually only obtain the flutter velocity, flutter frequency, and the flutter trend of the subcritical state [28]. In order to further study the flutter characteristics, the authors carried out the time domain flutter characteristic analysis in Section 4.4.2 and analyzed the dynamic characteristics of the structural flutter of the HALE joined-wing configuration UAV.
4.4. Gust Response Characteristic Analysis
In the study of the structural dynamic characteristics of aircraft, the impacts of unsteady aerodynamic loads caused by atmospheric turbulence and gusts account for a significant proportion of the external forces that cause structural vibration. Considering the spatial scale of gusts, the 1-cos gust model is widely used to evaluate flight quality and design flight control systems [29].
The traditional flutter analysis is usually carried out in the frequency domain. Based on the generalized aerodynamic matrix under the condition of simple harmonic motion, the function of reduced frequency and Mach number is obtained to calculate the flutter characteristics. The unsteady aerodynamic force is obtained based on the DLM, which is relatively accurate in the analysis of both subsonic and supersonic flutter characteristics. However, in the transonic calculation, it usually adopts a relatively rough crater margin deduction method, and its accuracy may be difficult to guarantee. Therefore, the author carried out the time domain flutter characteristic analysis. The time domain flutter calculation method calculates the structure time response of generalized coordinates through the simultaneous advance of the unsteady aerodynamic equation and the structure motion equation in the time domain to judge whether the aircraft has flutter. In the MSC Nastran software, the calculation of time domain flutter is integrated into SOL146, which studies the response of the aeroelastic system under external load or atmospheric gust excitation too. During the analysis in the software, the structural response characteristics of the UAV in the equivalent flight height and larger flight speed range are analyzed and searched, and the speed of the UAV’s structural constant oscillation is finally obtained, which is the time domain flutter speed.
4.4.1. Gust Response Characteristic Analysis
- •
H = 0 km, V = 105.6 m/s, Ma = 0.31, Vgust = 20 m/s.
- •
H = 20 km, V = 221 m/s, Ma = 0.8, Vgust = 6.35 m/s.
Multiple points, as shown in Figure 19(a), indicate that owing to the high aspect ratio, both configurations will have significant displacement after being affected by gusts. Notably, the wingtip of the conventional configuration experienced approximately 3.2 m of displacement, which was significantly larger than the displacement of 2 m observed in the joined-wing configuration. However, considering that the wingspans are 28 m with the conventional configuration reaching 28 m and only 21 m with the joined-wing configuration, the relative displacement change affected by gusts remains nearly the same. This indicates that the joined-wing configuration UAV cannot simply be considered smaller when affected by gusts. The main reason was that the wing load of the joined-wing configuration UAV was lighter and more affected by gusts. Although it has the characteristic of high structural stiffness, it does not provide significant advantages over the conventional configuration.
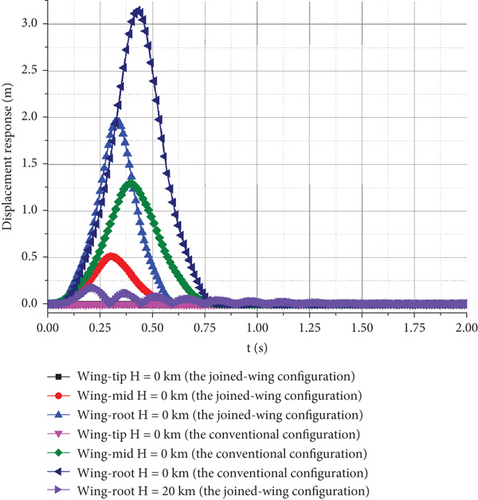
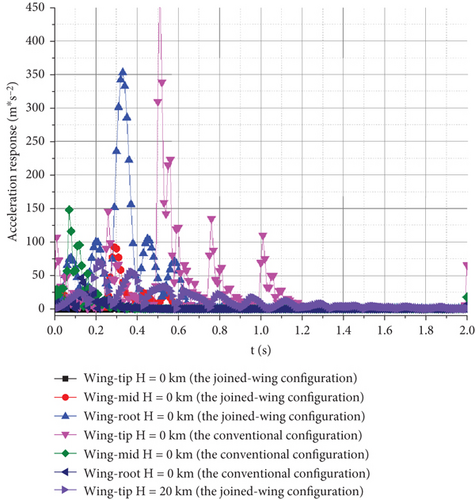
Comparisons of the displacement responses of different observation points on the wingtip, wing-mid, and wing root, as shown in Figure 19(b), show that the displacement response of the wingtip is significantly affected by gusts. As the observation points moved toward the wing root, the absolute values of their displacement responses decreased significantly. However, the extent of the reduction was different. The displacement deformation of the wing-mid node of the Frt wing was reduced to 27.7% of the wingtip, whereas the deformation of the wing-mid node of the conventional configuration UAV was 41.5% of the wingtip. This indicates that owing to the influence of gusts, the main deformation occurs in the outer wing section, whereas the deformation of the conventional configuration is relatively uniform along the spanwise direction. This ensures that the joined-wing configuration controls the deformation along the spanwise direction and reduces the influence of gusts.
Observations of the wingtip displacement response curves of H = 0 km and H = 20 km in Figure 15(a) show that the impacts of gusts at low altitudes are much greater than those at high altitudes. This is because an altitude of 20 km belongs to the stratosphere, where the gust speed is significantly lower than that on the ground. The flight speed is higher, and the scale factor (the ratio of gust speed to flight speed) of the gust speed is larger. The influence of the gusts was also relatively small. Simultaneously, because the air is less dense at H = 20 km, the energy of the gust is also low, and its impact on the structure of the UAV is relatively low. However, the lower air density at high altitudes also slows down the convergence rate of the wing affected by gusts. The wings of a UAV may experience long-term oscillations when encountering continuous gusts.
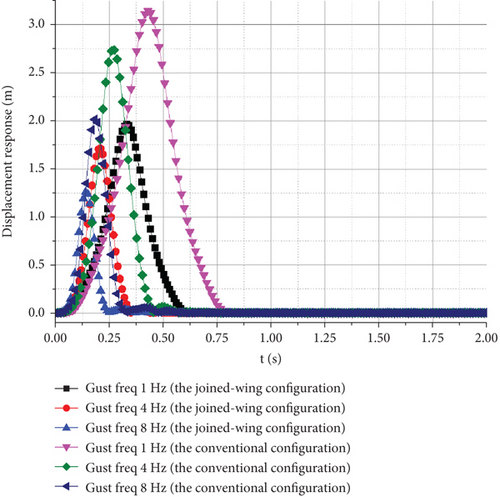
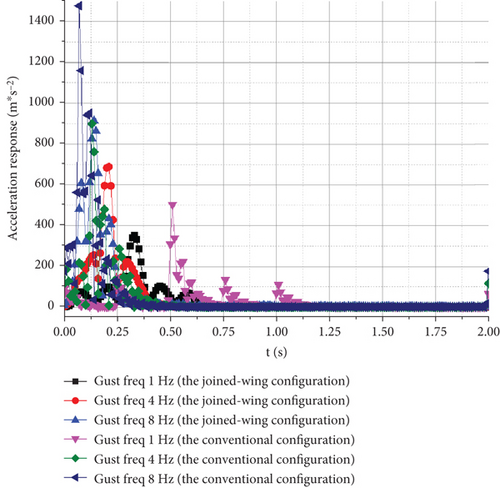
Hence, the gust speed can be regarded as an important factor that affects the amplitude of the aircraft’s structural response, but it does not directly affect the time characteristic of the response. Therefore, this study only investigates the influence of gust frequency on the UAV structure. The calculation conditions are H = 0 km, V = 105.6 m/s, and Vgust = 20 m/s. The response of the UAV was separately calculated at gust frequencies of 1–8 Hz. The displacement and acceleration responses of the wingtip in the vertical direction obtained by the calculation are as follows.
Figure 20(a) shows that the higher the gust frequency, the shorter the gust duration. As the gust frequency increased, the time and amplitude of the maximum displacement response continuously decreased. Figure 20(b) shows that as the gust frequency increases, the acceleration response gradually increases, and the time to reach the maximum response amplitude decreases.
4.4.2. The Time Domain Flutter Characteristic Analysis
Add the dynamic structural loads affected by gusts in typical states, and another important factor in analyzing gust response phenomena is the study of the self-excited vibration characteristics of UAVs using the excitation effect of gusts to induce time domain flutter. The optimal direction of the UAV structural design can be determined by investigating the mechanism of time domain flutter characteristics [30, 31].
The gust response was calculated by selecting H = 0 km, Vgust = 20 m/s, and a frequency of 4 Hz, with speeds ranging from 320 to 350 m/s. By selecting the node of the wingtip as an observation point, the time domain flutter characteristics were studied. The influence of different flight speeds on the gust response is as follows.
From the displacement response of the observation points at the wingtip, the maximum vertical displacement increases with flight speed, whereas the time of maximum displacement decreases with an increase in flight speed. The time required for the aircraft to reach convergence also increases with increasing flight speed. However, because of the small variation in the scale factor of the wind speed, there was not much difference in the graph. However, when the flight speed reaches 340.43 m/s, both wingtips experience equal amplitude oscillations, which means that they have reached the critical state of flutter. Figure 21(a) shows that the flutter frequency is approximately 9.7 Hz, which is equivalent to the value obtained via the K method.
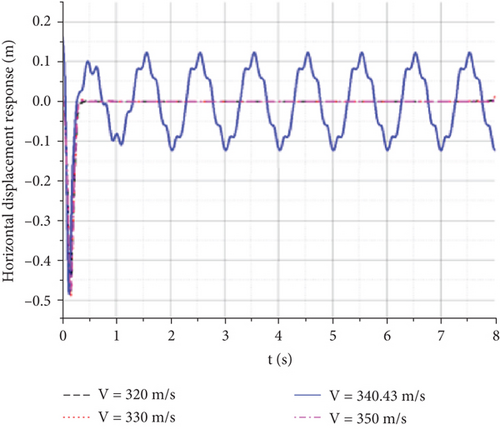
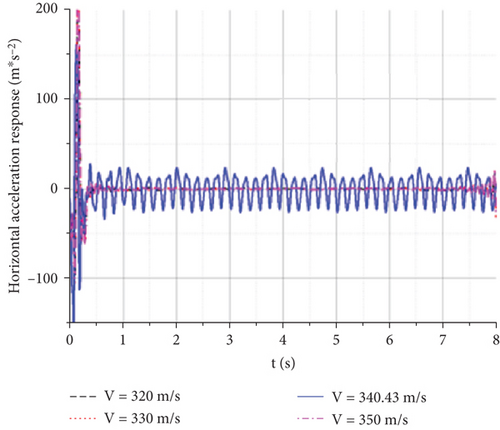
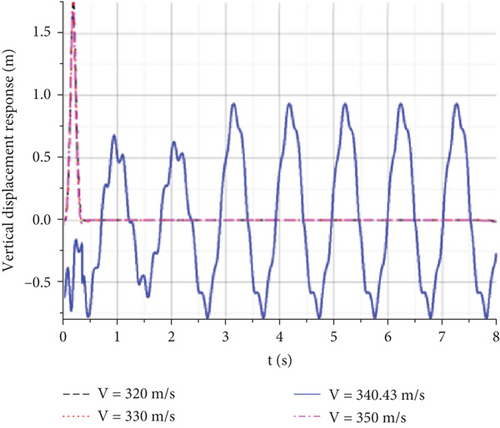
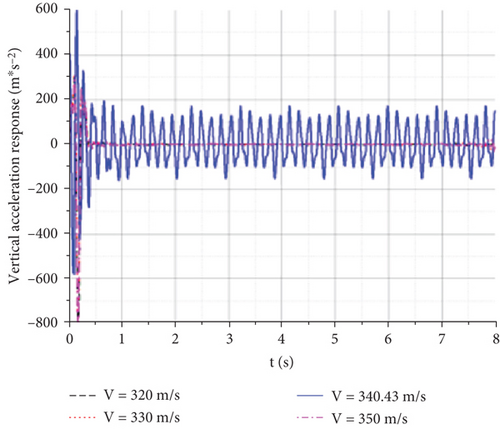
The gust response characteristics near V = 340.43 m/s were calculated to obtain Figure 22. When the flight speed was 340 m/s, the wingtip displacement of the aircraft rapidly converged after a short period of oscillation, and the UAV did not reach the flutter speed. When the flight speed reaches approximately 340.43 m/s, constant-amplitude oscillation occurs. When the speed increased slightly, vibration divergence occurred. The continuous oscillation of an aircraft can generate a significant overload. Even if structural damage does not occur quickly, it can cause significant fatigue and impact damage to the structure, leading to structural failure.
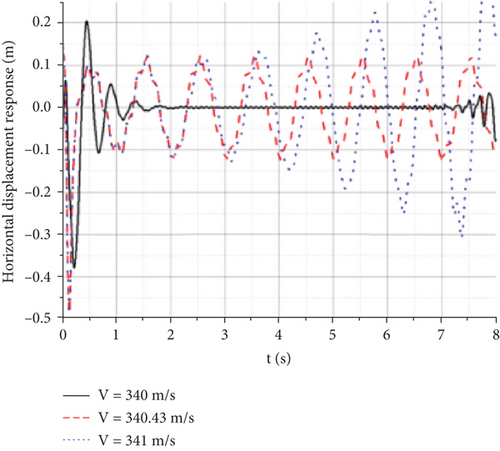
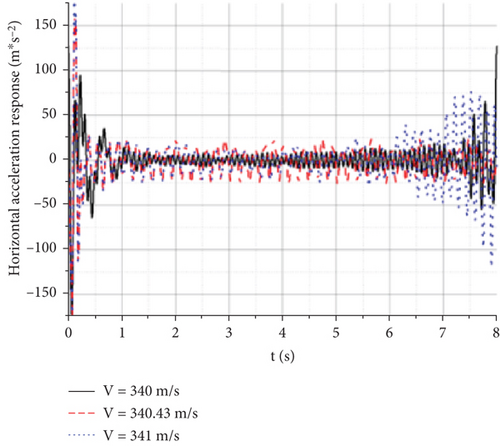
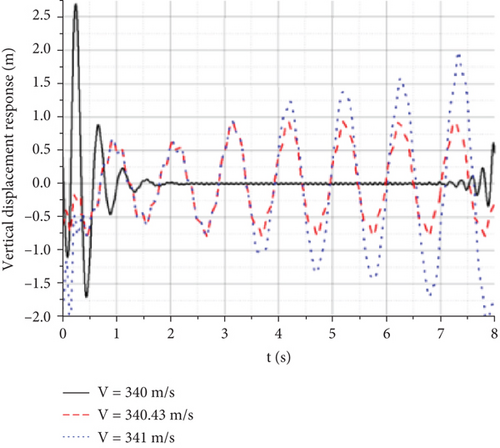
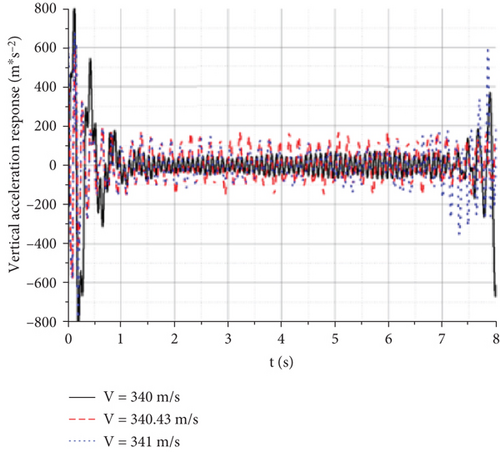
Under the action of a gust, each observation point had a certain displacement and acceleration response in the horizontal direction. To study the causes of the wing divergence mechanism, the lift-wing displacement response diagram at different times under a constant amplitude oscillation state is shown in Figure 23.
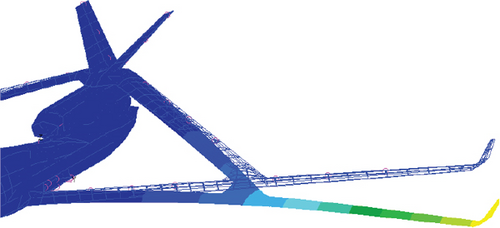
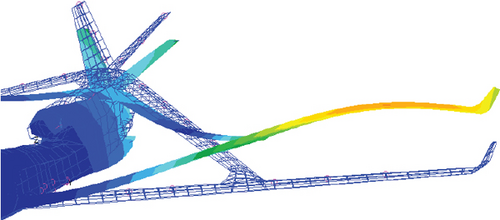
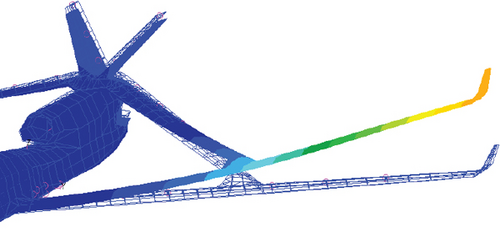
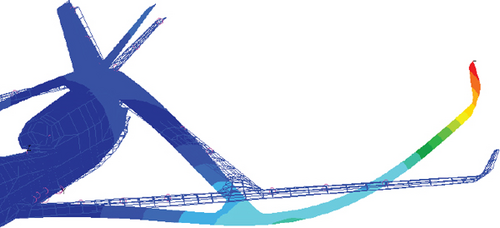
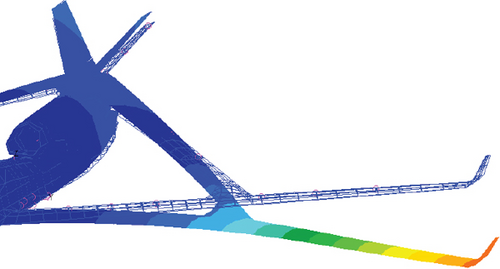
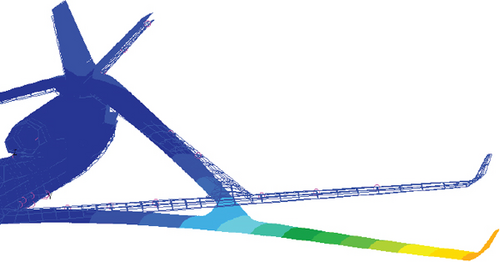
From the displacement response of the left wing at different times under a constant-amplitude oscillation state, the wing exhibited forward and backward flapping modes during oscillation. The wings bend upward at the same time when they swing backward. However, due to the large difference in structural stiffness between the inner wing section and the outer wing section of the joined-wing configuration, the outer wing section of the joined-wing configuration first bends downward under the combined action of aerodynamic and elastic forces, which makes the constant amplitude oscillation process of the whole wing present second-order bending characteristics. The combination of these two motions results in an increase in positive torsion of the Frt wing, a decrease in negative torsion of the rear wing, and the overall additional aerodynamic force is significantly increased.
Subsequently, the bending of the outer wing section with low stiffness began to recover, and under the action of the elastic force generated by its horizontal flapping and vertical bending, it tended to restore the original equilibrium state. When it exceeded the equilibrium position, it was flapped forward while bending down in the vertical direction. In the process of down-bending, the second-order mode characteristics, very similar to those of the up-bending process, also appeared, but its amplitude was slightly smaller than that of the up-bending process. Eventually, it goes around and around, oscillating.
For such a high-aspect-ratio aircraft, flutter is caused not only by the commonly known bending and twisting but also by the combined action of wing bending, twisting, and horizontal flapping. The response history of the observation point on the right wingtip in the XZ plane is as follows.
Figures 24(a), 24(b), and 24(c) show that under the action of a gust, the aircraft has a large displacement in both the horizontal and displacement directions in each state. However, the gust is brief, and after it disappears, the displacement response of each state is different. In the convergent state, both the horizontal and vertical displacements slowly decreased. In the y-axis direction, it appeared as a shrinking ring that ultimately converged and fluctuated within a small range. In the state of constant amplitude oscillation, both the horizontal and vertical displacements oscillate at a certain amplitude. In the direction of the y-axis, the wing moves in a large ring and continues to move. In a divergent state, the wing quickly recovers its initial displacement after being disturbed by a gust. Following the self-excited oscillations, both the horizontal and vertical displacements increased, resembling a gradually expanding and elongated ring in the y-axis direction.
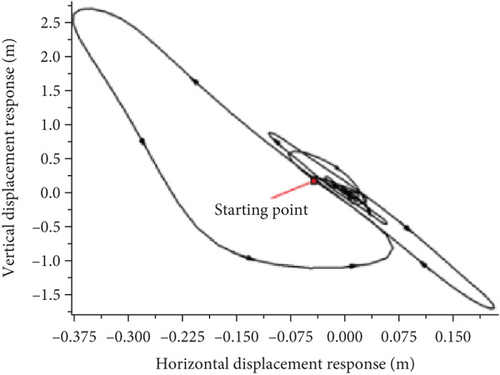
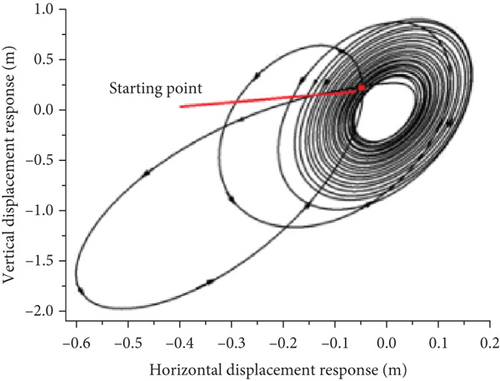
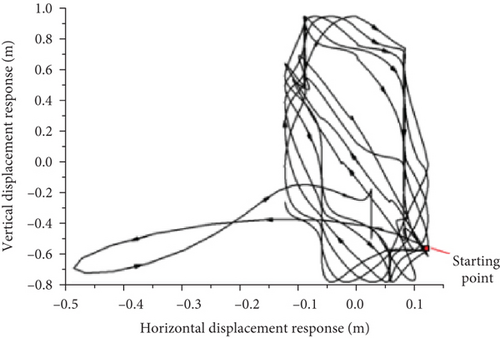
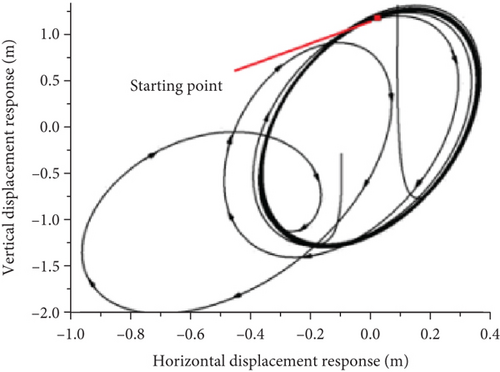
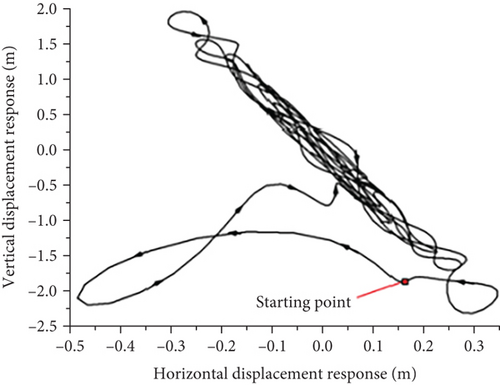
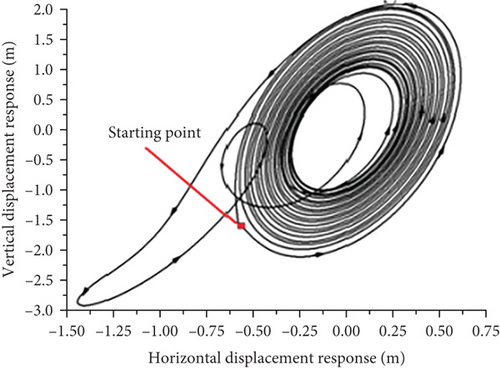
A comparison of the wingtip displacement oscillation curves of the joined-wing and conventional configurations shows that significant differences exist. First, owing to the influence of structural stiffness, the vibration convergence speed of the joined-wing configuration was significantly faster than that of the conventional configuration. Second, we compared the flutter oscillation paths that were close to the circular shape of the conventional configuration caused by the typical first-order bending mode and first-order torsional mode coupling. The flutter oscillation path and vibration waveform involving the second bending mode of the joined-wing configuration are relatively complex, which increases the difficulty of structural design optimization.
5. Conclusion
- 1.
This is because, while providing the same lift, its wingspan can be reduced compared with that of a conventional configuration aircraft, and the support effect of the rear wing on the Frt wing can effectively improve the structural stiffness of high-aspect-ratio HALE UAVs. The analysis of the structural static characteristics shows that its stress, strain, and torsional deformation characteristics are significantly better than those of the conventional configuration. Simultaneously, the mutual support between the two wings can optimize the force transmission structure and significantly reduce the axial force on the beam of the inner wing section.
- 2.
The mode shapes of HALE UAVs are mainly affected by the configuration of the high aspect ratio, but the supporting effect of the Frt wing and rear wings still eliminates some modes that can easily cause flutter to an extent. Simultaneously, the smaller span and larger structural stiffness generated by the Frt wing and rear wing support structures also increased the frequency of the main structural vibration modes.
- 3.
Owing to the elastic deformation of the aircraft, for the joined-wing configuration UAV, the CLα increases, the CMα decreases, and the elastic longitudinal static stability derivative is equivalent to approximately 102% of the rigid derivative. In contrast, the elastic longitudinal static stability derivative of the conventional configuration was equivalent to approximately 74.3% of that of the rigid configuration. The structural aerostatic deformation of this configuration contributes to an improvement in the longitudinal static stability. The rudder effect of the Frt wing is obviously greater than that of the rear wing. This is mainly due to the negative torsional characteristics of the Frt wing, while the rudder effect of the rear wing is positive torsional, and its rudder effect decreases significantly, even compared with the conventional configuration.
- 4.
Within the entire flight envelope, the flutter speed is significantly higher than that of the conventional configuration, and the joined-wing configuration is clearly more suitable for high-speed flights. The main reason for this is that under the same overall parameters, the span length is obviously smaller, and the supporting effect of the rear wing on the Frt wing structure also makes it less prone to flutter. However, because of the larger wing area and smaller wing load, it is more prone to coupling with the rigid-body short-period mode to generate body freedom flutter.
- 5.
Although the displacement and acceleration caused by the gust of the joined-wing configuration UAV with a lower wing load are clearly smaller, this configuration cannot be considered to be smaller than the conventional configuration. The main deformation occurred in the outer wing section, which ensured that the joined-wing configuration controlled the deformation along the spanwise direction and reduced the influence of gusts on the aerodynamic characteristics.
- 6.
By comparing the wingtip displacement oscillation curves of the joined-wing configuration and the conventional configuration, it can be seen that there are significant differences between them. Firstly, due to the influence of structural stiffness, the vibration convergence speed of the joined-wing configuration is significantly faster than that of the conventional configuration. Secondly, compare the flutter oscillation paths that are close to a circular shape of the conventional configuration caused by the typical first-order bending mode and first-order torsional mode coupling. The flutter oscillation path and vibration waveform involving the second-order bending mode of the joined-wing configuration are relatively complex, which increases the difficulty of structural optimization design.
At present, the structural characteristic analysis of the joined-wing configuration is usually limited to the wing, and the simulation results are usually only used for theoretical research. The research obtains the advantages and disadvantages of applying the joined-wing configuration in HALE aircraft and defines the design direction, which lays a solid foundation for the engineering application in the next stage. The results show that the structural preliminary design results meet the requirements of the UAV.
Compared with the conventional configuration UAV, the joined-wing configuration UAV has obvious structural advantages in many aspects, and it is especially suitable for HALE with higher flight height and flight speed requirements. The research of this paper is mainly based on simulation analysis, but due to the limitations of conditions, it lacks experimental verification support. It is expected that researchers in related directions can conduct experimental studies on the structural characteristics of the joined-wing configuration, which have verified the author’s conclusions. In this paper, the design of a UAV structure with the joined-wing configuration needs to support engineering applications, and the author has not carried out limit weight reduction work. When the structural stiffness of UAV further decreases, whether the conclusion drawn by the author is suitable also has great research value. These studies can promote the further expansion of the application range of the joined-wing configuration, such as the application of solar UAVs. It is expected that other researchers will carry out more research on the joined-wing configuration UAV.
Conflicts of Interest
The authors declare no conflicts of interest.
Funding
This study is supported by the Equipment Pre-Research Project (No. 41411020401).
Acknowledgments
This study is supported by the Equipment Pre-Research Project (No. 41411020401).
Open Research
Data Availability Statement
Data is available on request due to privacy/ethical restrictions.


