Influence of Geometric Parameters on Intake Performance of 3D Ramp-Type Scramjet Inlet
Abstract
The methods based on the assumption of inviscid flow are typically used for the initial design of the scramjet inlet geometry, but the presence of a viscous boundary layer can degrade the validity of the results and lead to nonoptimal operation. This study explored the design space of three-dimensional ramp-type scramjet inlet geometry and investigated the intake performance including the viscous effect based on computational fluid dynamics. The baseline scramjet inlet was defined, and Reynolds averaged Navier–Stokes (RANS) analysis was performed to identify the basic flow structure and the intake performance. The major geometric parameters of the inlet were defined, and the one-factor-at-a-time (OFAT) method was applied to the baseline geometry to investigate the changes in intake performance according to changes in each geometric parameter. The variations of the intake performance as a function of multiple geometric parameters are also examined through the surrogate model generated for the response surface of the intake performance parameters. The combinations of geometric parameters were sampled by using Latin hypercube sampling, RANS analysis was performed for sampled points, and the surrogate model was generated using ordinary kriging. The overall tendency of intake performance from the response surfaces was compared to observation from OFAT analysis. The optimal inlet geometries were explored by selecting appropriate objective functions and applying the genetic algorithm-based multiobjective optimization. Several optimal solutions were selected from the resulting Pareto front, and their intake performance was evaluated.
1. Introduction
Recently, the research interest and technical development of hypersonic flight vehicles have been growing rapidly. A scramjet engine is desirable for a hypersonic vehicle propulsion system. Unlike rocket propulsion, the scramjet engine is an air-breathing engine that does not need to carry additional oxidizer. The resulting overall weight reduction provides several advantages in terms of operating cost, mission performance and maneuverability, and increased payload. The scramjet engine uses shock waves to compress the air, eliminating the need for a moving component, while the gas turbine engine family uses compressors. The inlet geometry determines the overall flow field and shock structure around the inlet and isolator, and the air is compressed through the multiple shock waves before entering the combustion chamber [1]. The inlet geometry directly and indirectly affects the air intake performance, aerodynamic performance, and engine performance. Thus, the importance of a proper inlet design has been emphasized in the development of scramjet vehicles. Typical scramjet inlets include the Prandtl–Meyer, Oswatitsh, Busemann, and multiramp inlet [2, 3]. The initial design of these inlets is usually based on the shock wave relation or the Taylor–Maccoll equation, which assumes an inviscid flow [4–9]. However, this method cannot reflect physical phenomena such as the boundary layer, shock wave–boundary–layer interaction (SWBLI), vortices, and vortex shock interactions (VSIs) in the resulting design. In real operating conditions [10], the presence of a viscous boundary layer degrades the validity of the results obtained under the assumption of inviscid flow. In addition, the thickness of the boundary layer increases as the density decreases at high altitudes, which can be considered as the operating condition of hypersonic vehicles. The boundary layer affects the shock wave structure and the flow field around the inlet, causing changes in intake performance that may result in failure to achieve the design performance. Moreover, SWBLI or flow separation due to viscosity can cause the unstart and thermal choking of the scramjet engine under off-design conditions [9].
There have been several studies that consider the presence of the boundary layer in the design of the inlet geometry. Ding et al. [11] obtained boundary layer parameters (i.e., momentum thickness and shape factor) and applied them to calculate displacement thickness on an intake geometry designed based on an inviscid flow. They proposed a geometry correction method that considered the displacement thickness and compared the intake performances with and without geometry correction. Flock and Gülhan [12] estimated the location of boundary layer transition based on the experimental data presented by Berkowitz, Kyriss, and Martellucci [13]. The transition onset criterion used the Mach number and momentum thickness of the laminar boundary layer, and the correction results were compared according to the boundary layer state. The previous studies of boundary layer correction approaches based on similarity and empirical solutions have proven to be reasonable and acceptable for axisymmetric and smooth-shaped intakes, such as scoop and the Busemann inlets. However, for nonaxisymmetric ramp-type intakes with shock and expansion waves and local separation at the ramp corners, the application of the correction method is rather limited due to the inaccuracy of the boundary layer parameter prediction. Drayna, Nompelis, and Candler [14] and Brahmachary, Fujio, and Ogawa [15] conducted an axisymmetric inlet design using a genetic algorithm with a Reynolds averaged Navier–Stokes (RANS) analysis data. Damm et al. [16] modified the two-dimensional (2D) ramp-type inlet geometry, which is designed based on the inviscid flow assumption, and improved the intake performance using a discrete adjoint optimization with RANS analysis. Kang, J. Park, and D. Park [17] performed an optimization of the geometry of a 2D ramp-type scramjet inlet based on RANS analysis. They considered the transition of the hypersonic boundary layer on the ramp surface in the analysis and compared two optimal geometries, one considering fully turbulent flow and the other considering the transition. They observed and discussed discernible differences in the optimal geometry depending on the boundary layer state.
The RANS-based design and optimization of scramjet inlet geometries requires large computational costs, which has resulted in most studies focusing on 2D or axisymmetric inlets. Therefore, researches on three-dimensional (3D) hypersonic inlet geometry including design variables, parametric study, design space exploration, and optimization have been rather rare. In this regard, the present study is aimed at exploring the design space and investigating the characteristics of the intake performance of a 3D ramp-type scramjet inlet through a parameter study of the geometric variables. This study contributes to the understanding of the influence of individual or simultaneous changes in geometric parameters on inlet performance. Furthermore, the validity of the 3D ramp-type scramjet inlet optimization framework based on the surrogate model is demonstrated. By analyzing the results, possible improvements in intake performance are sought by exploring the design space and investigating candidate designs according to different objectives. Thus, the present study intends to offer fundamental insights and physical foundations that can be taken into account for either the design or optimization of the scramjet inlet geometry.
The baseline geometry and geometric parameters of the 3D ramp-type scramjet inlet were defined. The intake performance according to the change in geometric parameters was investigated using a RANS analysis data. The modeling process for the various inlet geometries studied was automated using open-source computer-aided design (CAD) software. The analyses for various inlet geometries were performed using RANS analysis with an unstructured grid, and the intake performance was obtained. One-factor-at-a-time (OFAT) method was first used to analyze and identify the intake performance in response to changes in each geometric parameter. Furthermore, to investigate the intake performance under variations in multiple geometric parameters, geometries for analysis were chosen using Latin hypercube sampling (LHS), and the corresponding intake performances were obtained. By constructing surrogate models from the resulting data, the response surfaces of the intake performances were obtained and analyzed. The intake performance according to the geometric parameters was examined and compared based on the OFAT and response surface analysis. Finally, by defining a multiobjective optimization problem, the optimization based on a genetic algorithm was applied to explore the Pareto front for the optimal geometry.
2. Method of Analysis
2.1. Baseline Geometry
The baseline inlet geometry was defined by modifying the SCP-01 scramjet inlet designed for research purposes by the Agency for Defense Development [18]. The SCP-01 configuration, which is similar to the widely known X-51A scramjet vehicle, includes ramp-type external compression surfaces (first and second ramps). It was designed under the assumption of inviscid flow and satisfied the shock-on-lip and shock-on-shoulder conditions at a Mach number of 6. To reduce computational time and cost, only the forebody portion of the SCP-01 configuration is considered for the analysis domain. The length and angle of the first and second ramps have been modified from the original SCP-01 to account for the effect of viscosity. By constructing a surrogate model from RANS analysis data for various sampled geometries and finding an optimal solution based on the concept of desirability function, the cross-sectional geometry of the symmetry plane was optimized to maximize the mass flow rate and compression ratio and minimize the inlet drag in terms of a 2D flow. The details of the optimization process and the results can be referred from our former study [17]. The modified SCP-01 geometry with optimized symmetry plane cross-section is presented in Table 1, and the cross-section and forebody geometries are depicted in Figure 1.
| 1 | 2 | 3 | 4 | |
|---|---|---|---|---|
| x (mm) | 616.25 | 1389.19 | 150.0 | 2114.63 |
| z (mm) | 31.55 | 40.0 | 20.0 | — |
| L (mm) | 836.58 | 950 | — | — |
| θ (°) | 12.75 | 2.5 | — | — |
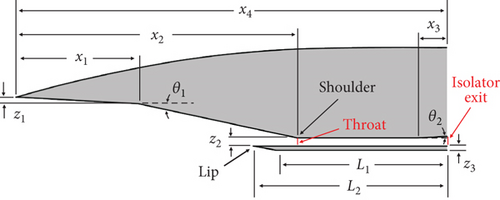
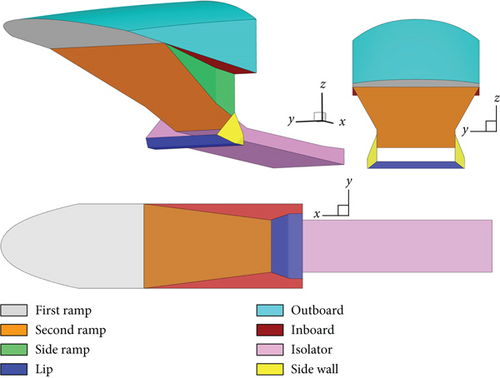
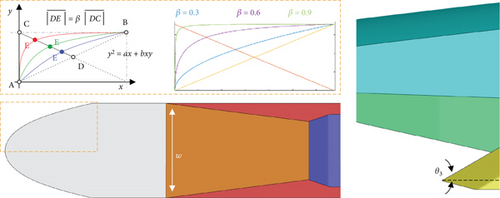
The outboard width was 364 mm, and the inner width of the isolator was 225 mm. The side wall was 27.5 mm thick with a 25° chamfer, and the lip was 20 mm thick with a 15° chamfer. The corners of the side ramp were aligned with the lip at the same x coordinate, and the distance between the left and right corners was 225 mm, matching the width of the isolator.
2.2. Geometric Parameters

2.3. Intake Performance Parameters
2.4. Flow Conditions and Numerical Methods
The cruise conditions are assumed to be altitude of 25 km and a Mach number of 6. The flow conditions were calculated based on the NASA standard atmospheric model [20]: The freestream temperature, the static pressure, and the unit Reynolds number are 216.69 K, 2522.27 Pa, and 5.05 × 10⁶L/m, respectively. The RANS analysis was conducted using a density-based solver of ANSYS Fluent 2021 R2 [21] with the ideal gas assumption. The specific heat at constant pressure (cp) was set to a piecewise polynomial, and the dynamic viscosity and thermal conductivity were calculated using Sutherland’s law and the fourth-order polynomial, respectively. The Roe-flux differencing scheme (FDS) with total variation diminishing (TVD) limiter was selected to calculate the convective flux terms, and the least squares cell-based method was used to calculate the gradient. The second-order upwind scheme is chosen for the spatial discretization of both flow and turbulence variables, and an implicit scheme is applied for the temporal discretization with the Courant–Friedrichs–Lewy (CFL) number increased from 0.8 to 10.0. In our previous publication [22], the validation on the method of numerical simulation for the analysis of scramjet inlet flows was carried out for the cases of double ramp [23] and shock wave laboratory (SWL) scramjet inlet [24]. The comparison of the results with experimental data confirmed that the numerical method used in this study can be considered reliable and accurate.
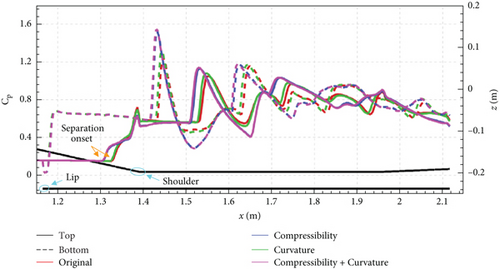
The intake performances, obtained with and without applying the corrections for the baseline geometry, are summarized in Table 2. The absolute percentage error with respect to the results from the model without any corrections is given in parentheses. The results indicate that, except for the Fz, the overall difference was less than 1.8%. The difference in Fz was of the order of 10% and 3.35% for the cases with and without the compressibility correction, respectively. The compressibility correction yields the most significant effect. The distributions of the pressure coefficient along the line of symmetry on the both top and bottom surfaces of the isolator and second ramp are compared in Figure 3. It can be observed that the size and onset location of the local separation region in the upstream of the shoulder formed by SWBLI was dependent on the correction. Furthermore, the different flow structures in the upstream region (end of the second ramp and entrance of the isolator) led to a change in the flow structure of the isolator in the downstream region.
| Correction | TPR | Fx | Fz | |||
|---|---|---|---|---|---|---|
| Original | 3.4172 | 0.3859 | 2.7069 | 740.75 | 919.99 | 430.53 |
| Compressibility | 3.4207 (0.10%) | 0.3915 (1.46%) | 2.7156 (0.32%) | 738.02 (0.37%) | 912.29 (0.84%) | 390.49 (9.30%) |
| Curvature | 3.4171 (0.00%) | 0.3869 (0.27%) | 2.7034 (0.13%) | 742.11 (0.18%) | 919.91 (0.01%) | 416.11 (3.35%) |
| Compressibility + curvature | 3.4207 (0.10%) | 0.3927 (1.78%) | 2.7137 (0.25%) | 739.01 (0.23%) | 912.37 (0.83%) | 382.94 (11.05%) |
2.5. Grid Generation
To allow flexible grid generation according to the variation of the geometry, an unstructured grid using Fluent Meshing [21] was employed. The computational domain and boundary conditions are shown in Figure 4. The thermal boundary conditions of the solid surfaces were set to an adiabatic wall. The geometry of the computational domain was designed so that any shock waves generated by any surfaces of the forebody model did not intersect with the far field boundary.

The grid test was performed to determine the proper grid resolution that would allow for a time-efficient analysis with sufficient accuracy of the results, including the regions where complex flows such as shock waves and vortices are expected. Among the grid parameters, the edge length of the surface mesh on the second ramp and isolator was varied from 0.003 to 0.007 m, and that of the remaining surfaces was varied from 0.006 to 0.009 m. The minimum lengths of the first, second, side, and isolator surfaces were set to 0.002~0.004 m as grid test parameters. The minimum and maximum edge lengths of the other faces were set to 0.006 and 0.02 m, respectively. The minimum and maximum edge lengths for the far field boundary were set to 0.06 and 0.12 m, respectively. To resolve the shear layers including the boundary layer, a total of 27 layers of prism layers are stacked on the solid wall surfaces with a growth ratio of 1.2. The first cell height of the prism layer was set to 0.000026 m, which corresponds to a target y+ of 0.7. For the volume cells, the grid was concentrated in Zones 1, 2, and 3, representing the region where the shock wave and complex flow structure were expected to form, as shown in Figure 5(a). For the grid test parameter, the maximum length of the volume cell was explored from 0.01 to 0.02 m for Zones 2 and 3, and from 0.003 to 0.01 m for Zone 1.
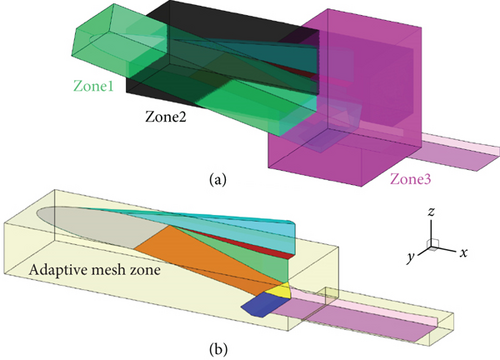
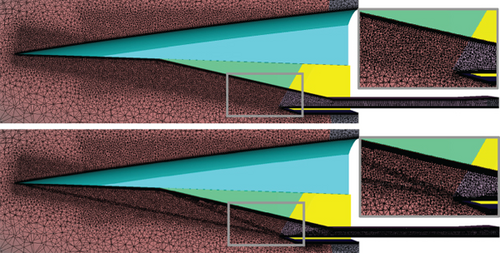
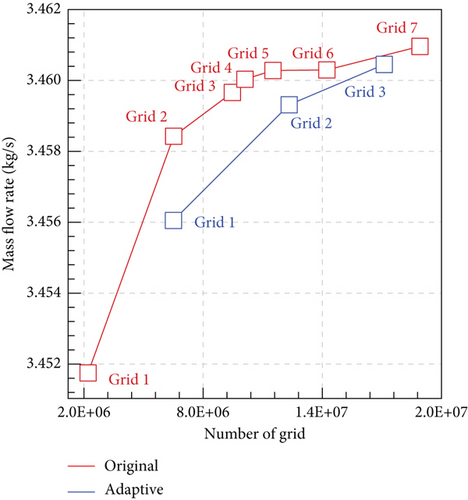
Because unstructured grids with insufficient grid resolution can yield the deterioration of the accuracy of the results especially for flow structures with the shock waves, an adaptive mesh was applied to achieve be accuracy in capturing the shock waves. The region where the adaptive mesh was applied is shown in Figure 5(b). The density gradient normalized to the overall averaged value was used as the criterion for mesh adaptation, and the threshold value was set to 0.45 based on preliminary tests. The primary calculation was performed on the original grid until a converged solution was reached. The mesh adaptation was then applied once and further calculation was performed on the refined mesh. The geometry for the grid test was considered as 0.4, 364 mm, and 60° for β, w, and θ3, respectively. The mass flow rate through the isolator exit was chosen as the convergence criterion. Grids with a total of seven levels of resolution were generated as the original grid. As an example, the original grid of Level 2 and the refined grid after applying the mesh adaptation are shown in Figure 6(a). The results of the grid test are depicted in Figure 6(b). The mesh adaptation was applied up to the grid Level 3. The results exhibit that when applying the mesh adaptation for the original grid of Level 3, the total number of volume cells became approximately 17 × 106 and yielded results similar to those for the original grid with the highest resolution, that is, Level 7. In this study, the final grid was selected as original grid of Level 3, considering the computational cost and accuracy. Therefore, the grids for all geometries to be explored were generated using the same procedure and parameters used to generate the Level 3 grid, and an adaptive mesh was applied during the calculation.
3. Results and Discussions
3.1. Basic Flow Structure of Baseline Geometry
As an example, the flow structure in the cross-section of the symmetry plane (x-z plane) is shown in Figure 7 for the case of baseline geometry. The oblique shock waves are generated from the external compression surfaces, and impinge near the leading edge of the lip, satisfying the “shock on the lip” condition. The oblique shock waves are reflected from the lip impinge around the shoulder, representing the “shock on the shoulder” condition. In addition, it can be observed that the region of local separation with reverse flow occurs around the shoulder due to the SWBLI, and the shock waves reflected from the lip and shoulder lead to the formation of a shock train structure in the isolator.
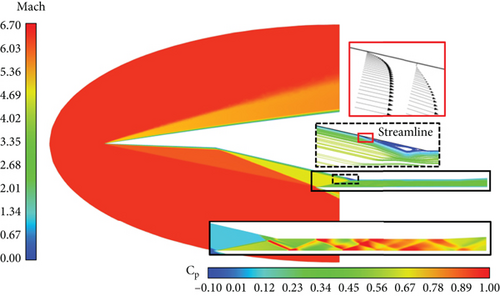
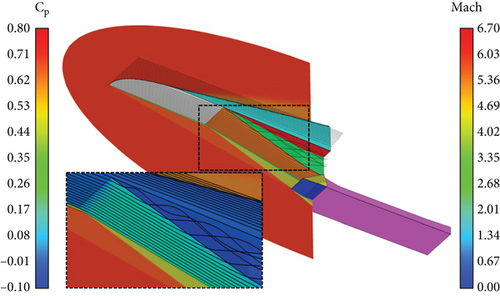
In the cross-section perpendicular to the streamwise direction (y-z plane), the shock wave generated from the outer surfaces of the forebody (i.e., first ramp, second ramp, side ramp, and outboard) gradually changed from an elliptical shape to a circular shape corresponding to the cross-sectional shape, as shown in Figure 8. At x = 1.2 m, the vortices can be identified on both sides of the outboard and side ramp. The flow passing through the shock generated by the first ramp passes over the second or side ramp. The flow over the second ramp is compressed further by an oblique shock wave. Simultaneously, the flow passing over the side ramp experiences expansion, resulting in a relatively lower pressure compared to the region over the second ramp. Therefore, the flow over the second ramp near the side ends tends toward the side ramp, causing streamwise vortices and mass spillage, as shown in Figure 9.
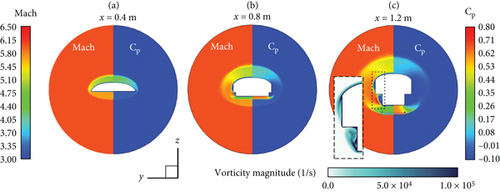
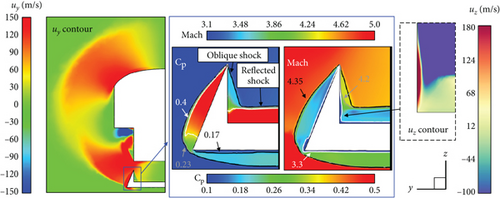
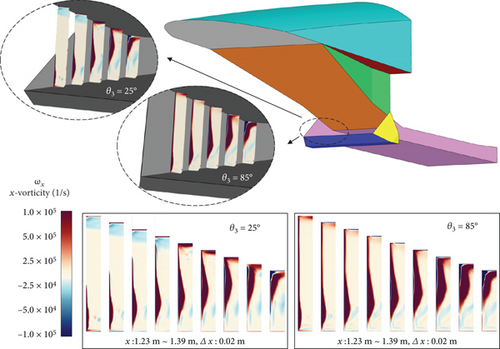
The flow field in the cross-section at x = 1.2 m, as shown in Figure 8(c), shows that the pressure in the region between the lip and the second ramp is relatively high. In contrast, near the side ramp and outboard, the pressure is relatively low. Consequently, the flow experiences an expansion and an yielding spanwise velocity component (uy) toward the outside. As can be seen from Figure 10, the oblique shock wave is generated from the side wall due to the uy. Near the corners formed by the bottom and side surfaces of the isolator, the flow passes through both the reflected shock wave from the bottom surface and the oblique shock wave from the side wall (i.e., the side surface of the isolator). As shown in Figure 10, the highest pressure is formed in the region after the reflected shock wave, and relatively lower pressure is formed in the region after the oblique shock wave along the side wall. The pressure gradient induces a z-velocity (uz) within the boundary layer over the side wall and leads to x-vorticity (ωx = ∂uz/∂y − ∂uy/∂z).
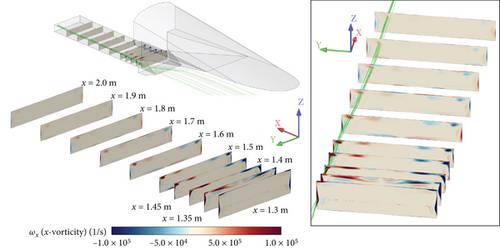
In Figure 11, the streamwise vortex shifts toward the top surface of the isolator in the downstream direction. The strong streamwise vortex locally concentrated in the region of large ωx on the side surface evolves into the weak vortex after encountering the top surface of the isolator, and the vortex core moves away from the side surface. Thereafter, the ωx decreases downstream of the isolator.
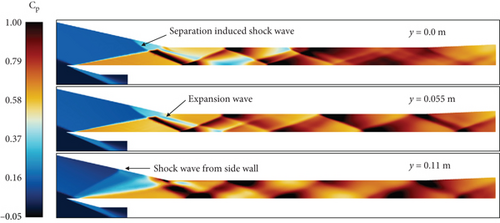
The separation bubble and separation-induced shock generated by the SWBLI at the end of the second ramp can be observed in Figures 7 and 12. Furthermore, an expansion wave is observed ahead of reattachment. Along the isolator, the separation-induced shock wave impinges on the bottom surface and reflects to the top surface (see Figure 12). The pressure increases abruptly as the flow passes through the shock wave, then decreases as it expands, and increases again as it passes through another shock wave, creating a shock train structure in the downstream region. The separation-induced shock wave, the separation bubble, the expansion wave, and the oblique shock wave from the side wall vary with the spanwise location (i.e., y coordinate), resulting in a different flow structure within the isolator.
3.2. Effect of Individual Parameter
The OFAT method was applied to the baseline geometry to identify the effects and tendencies on the intake performance due to the changes in each geometric parameter. The analysis cases were set at intervals of 0.15 to 34.75 mm, and 15° for β, w, and θ3, respectively, within the range described in the previous section. A total of 15 forebody geometries, including the baseline case, were generated, and a RANS analysis was conducted. To investigate the results and identify the trend, the geometric parameters (i.e., independent variable) were normalized to the maximum and minimum values of each parameter. The results are summarized in Table 3, and the overall intake performance is shown in Figure 13.
| Normalized | 0.0 | 0.08 | 0.25 | 0.33 | 0.5 | 0.75 | 1.0 |
|---|---|---|---|---|---|---|---|
| β | 0.2 | — | 0.35 | 0.4 | 0.5 | 0.65 | 0.8 |
| w (mm) | 225 | — | 259.75 | — | 294.5 | 329.25 | 364.0 |
| θ3 (°) | 25 | 30 | 40 | — | 55 | 70 | 85 |
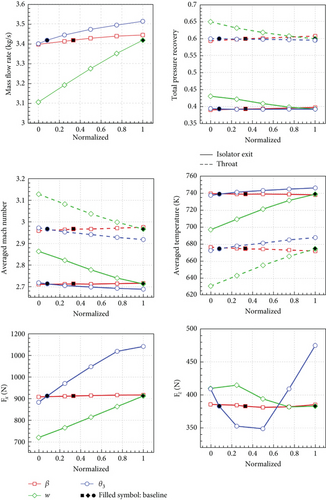
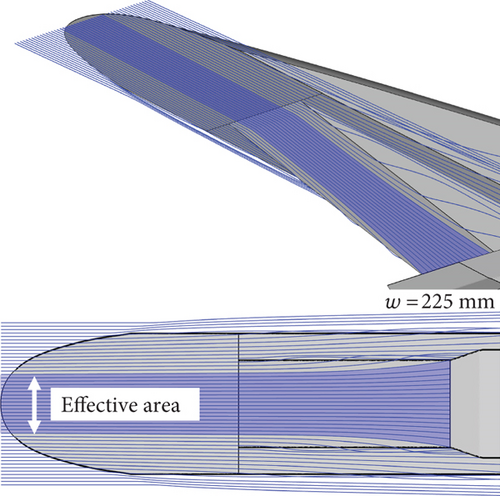
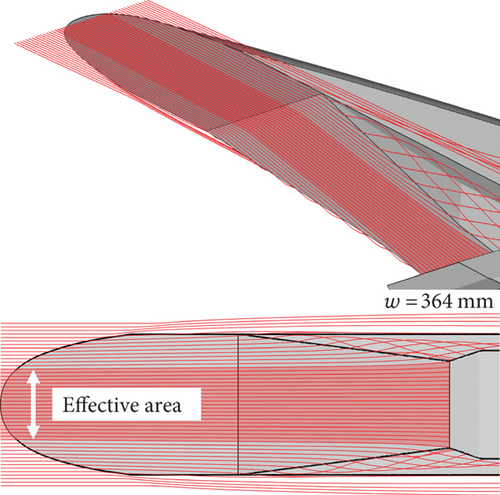
Figure 13 shows that the mass flow () rate and axial force (Fx) increased with all the geometric parameters considered. This indicates that a large mass flow rate can be achieved by making the geometric parameters considered in this study as large as possible; however, the axial force (drag) also becomes large. The TPR decreased significantly with w, while slightly increased with β, and the changes due to θ3 are negligible. The average temperature() increased with w and θ3, whereas slightly decreased with β. On the contrary, the average Mach number () decreased with w and θ3, while it slightly increased with β. The dependence of the and on the geometric parameters is found to be opposite each other. It can be observed that the intake performances TPR, , and at the isolator exit and at the throat have identical trends with only shifts in the values. Fz increases and decreases with increasing w, while it has similar value for normalized w of 0.75 (w = 329.25 mm) and 1.0 (w = 364 mm). Also, Fz decreases with increasing θ3 and begins to increase beyond normalized θ3 = 0.5 (θ3 = 55°). The influence of the variation of β appears to be relatively insignificant for most intake performances. As discussed in the previous subsection, some portion of flow over the second ramp tends to the side ramp, leading to mass spillage for all geometries. However, it is obvious that a large w increases the effective area, resulting in a high , as shown in Figure 14. To identify the major contributors to the Fz changes with w, the Fz exerted on the first ramp, inboard, second ramp, side ramp, side wall, isolator, and lip surfaces for all values of normalized w are presented in Table 4. It can be found that the Fz of the first ramp, side ramp, and lip remain almost the same with respect to w. As w increased, the Fz of the inboard, isolator, and side wall decreased, while increasing for the second ramp. The decrease in Fz for the inboard was the consequence of the decrease in both surface pressure and surface area with the increase in w, whereas the increase in Fz for the second ramp was the result of the direct increase in the surface area with the increase in w.
| Normalized w | First ramp | Inboard | Second ramp | Side ramp | Side wall | Isolator | Lip |
|---|---|---|---|---|---|---|---|
| 0.0 | 207.34 | 79.7410 | 1544.62 | −1.8633 | −106.68 | −1579.88 | 265.51 |
| 0.25 | 207.54 | 46.7520 | 1727.71 | −1.7821 | −113.46 | −1718.98 | 265.74 |
| 0.5 | 207.75 | 17.8704 | 1906.14 | −1.5913 | −121.48 | −1881.55 | 265.75 |
| 0.75 | 207.95 | −7.7267 | 2073.26 | −1.3389 | −130.54 | −2027.11 | 266.05 |
| 1.0 | 208.09 | −30.7835 | 2228.84 | −0.9919 | −140.86 | −2148.60 | 265.74 |
- Note: Unit: N.
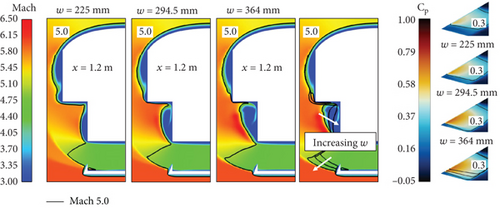
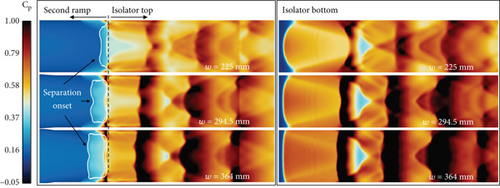
The change in Fz of the sidewall is attributed to the difference in w, which leads to a change in the shock wave structure around the inlet, as illustrated in Figure 15, which changes the Cp distribution over the sidewall. In the case of w = 225 mm (i.e., a normalized w of 0), the oblique shock angle from the second ramp decreases as away from the center, resulting in an elliptical pattern of shock impingement on the bottom surface of the isolator, as shown in Figure 16. In the case of a normalized w of 1 (w =364 mm), the shock impingement pattern becomes nearly flat around the centerline and has a slight curvature near the sides. The reflected shock wave from the bottom surface of the isolator is directed toward the end of the second ramp, where a separation bubble is formed by the SWBLI. Consequently, the onset location and structure of the separation bubble depend largely on w. Although there is no change in the area of the isolator as w changes, the difference in the flow structure formed around the entrance leads to a different shock wave structure in the isolator, causing differences in Fz, as shown in Figure 16. As w increases, the onset of separation and the separation-induced shock waves occur relatively upstream. Thus, the change in flow structure around the inlet and inside the isolator causes a difference not only in the Fz but also in other intake performances, such as , , and TPR.
The results indicate that Fx and increase with increasing the side wall angle (θ3). The increase in Fx was mainly attributed to the increase in the exposed surface area and the skin friction drag exerted on it. The increase in is due to the presence of a side wall that covers above the side ramp as θ3 increases, reducing the low-pressure area formed over the side ramp and thus suppressing the mass spillage. Therefore, the reduction of the mass spillage led to an increase in , as shown in Figure 17.
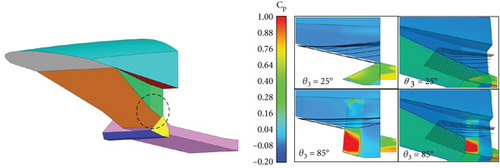
For the maximum θ3 (θ3 = 85°), the junction of the second ramp and the side wall is in a forward position compared to the baseline geometry, and a weak oblique shock wave is generated. In contrast, for the minimum θ3 (θ3 = 25°), the junction is located more downstream compared to the baseline geometry, generating a similarly weak oblique shock wave. This results in a difference in the flow and shock wave structure throughout the internal flow path as shown in Figure 18.
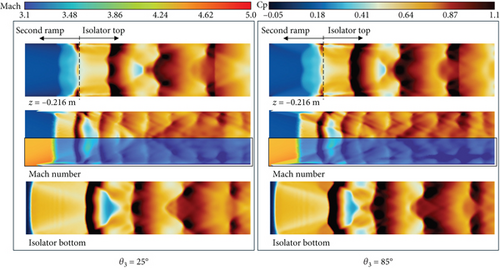
In Section 3.1, it was observed that there is the pressure gradient on the side surface of the isolator caused by the shock waves, which generate a velocity in the z-direction. Further downstream, the size of the region with strong ωx increases, and its location shifts from the bottom to the top of the side surface, as can be seen in Figure 19. The region of the streamwise vortex behaves like a hump, generating a weak oblique shock. Consequently, an expansion wave and a compression wave are generated behind it. This flow structure varies with the θ3, resulting in a difference of the flow structure in the separation bubble region at the end of the second ramp. The different flow structure at the entrance of the internal flow path is not found to cause significant differences in intake performance such as TPR, , and (maximum 0.3%, 1.1%, and 1.2% at the isolator exit, respectively).
3.3. Response Surface Analysis
To investigate the changes in the intake performance as a function of simultaneous variations in multiple geometric parameters, 30 inlet geometries (i.e., combinations of geometric parameters) were sampled using LHS within the defined range of exploration. RANS analyses were then performed for all 30 inlets and intake performance parameters were obtained. A dataset of a total of 45 data points was constructed using the results for analysis points from LHS and those obtained in the OFAT analysis. Based on the dataset, a surrogate model for the response surface of each intake performance was generated using the ordinary kriging (Gaussian process) provided in the surrogate modeling toolbox (SMT) [28]. The several example response surfaces predicted from the surrogate model are depicted in Figure 20.
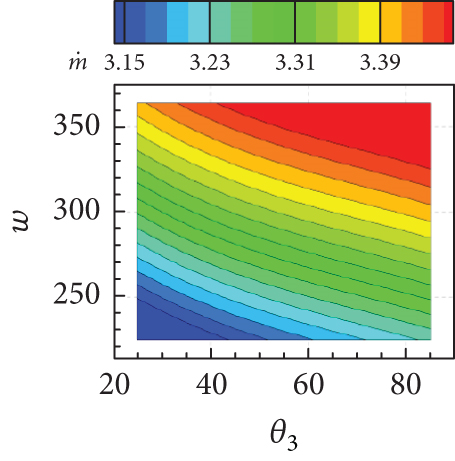
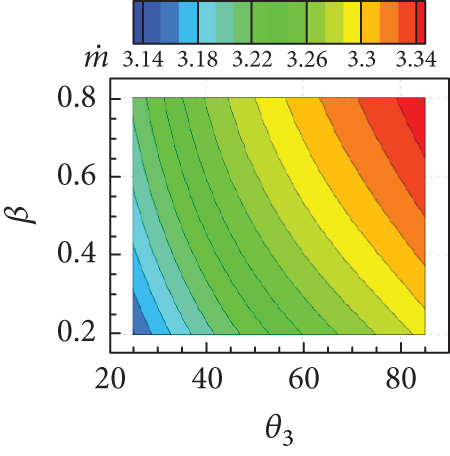
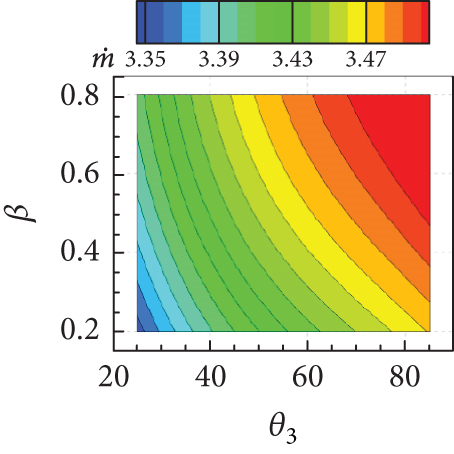
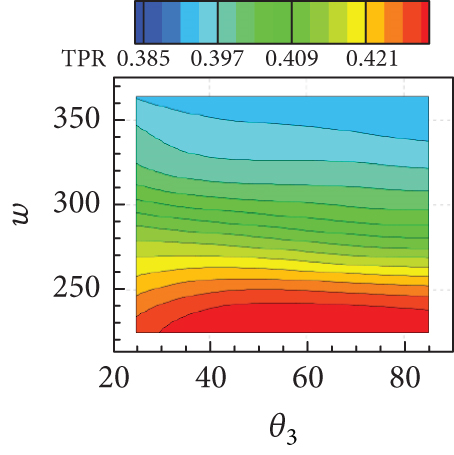
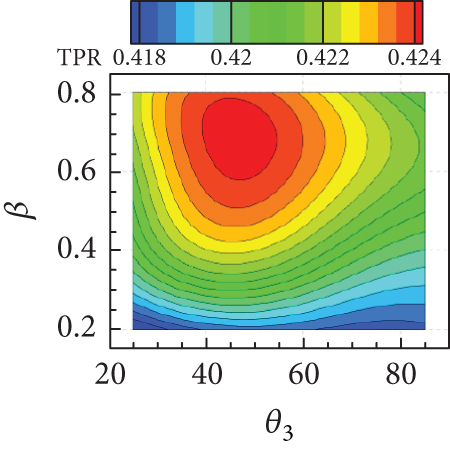
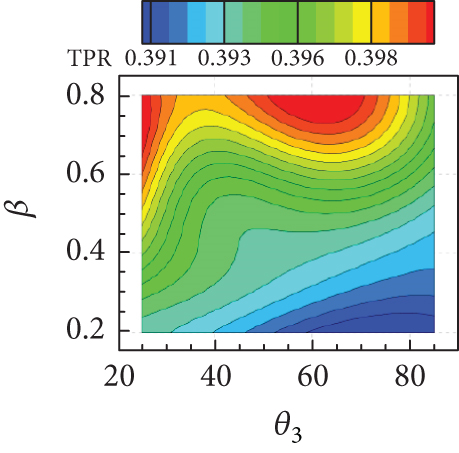
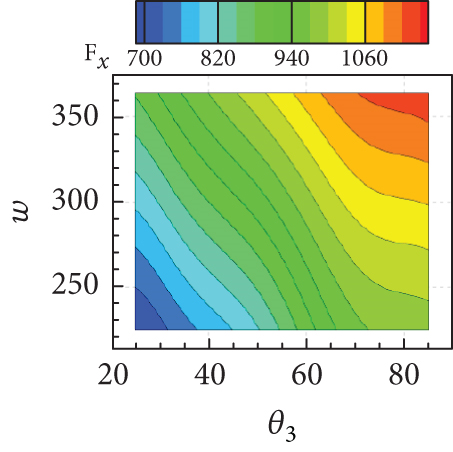
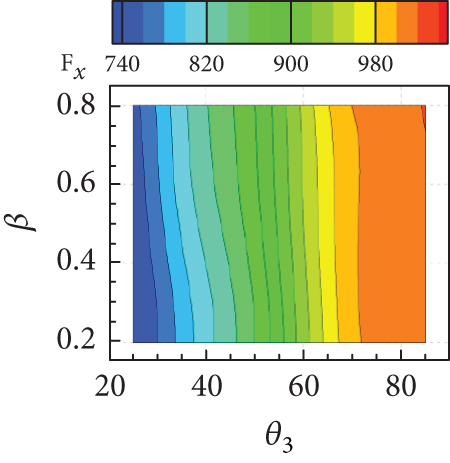
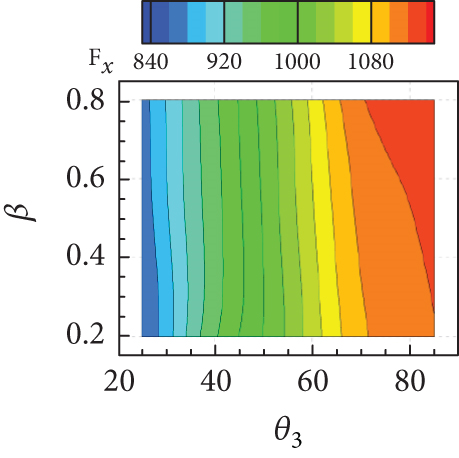
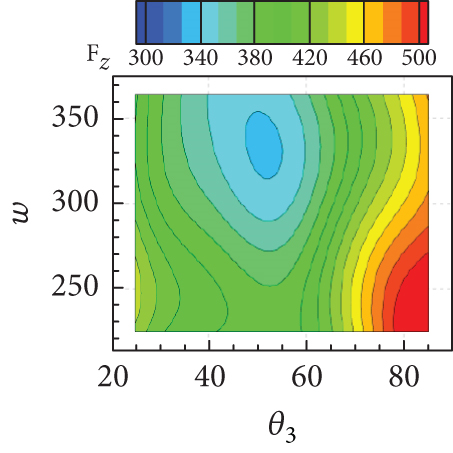
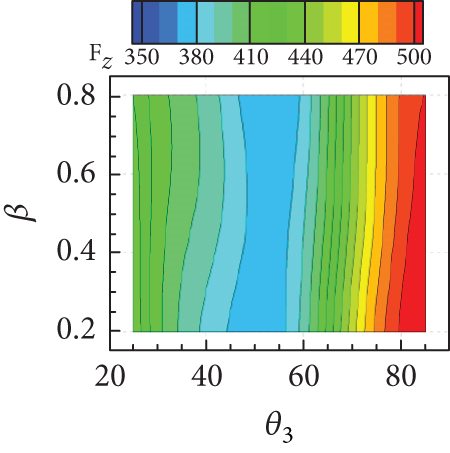
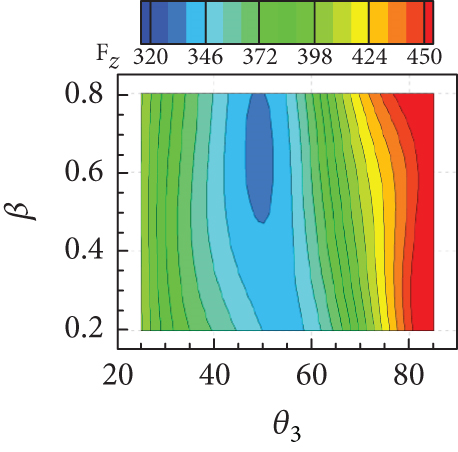
The isolines of the surrogate model for the response surface of shown in Figures 20(a), 20(b), and 20(c) appeared as a diagonal pattern, indicating that increases monotonically with all geometric parameters. Figure 20(d) shows that the isolines of the response surface for the TPR have an almost horizontal pattern for lower values of w and β, implying that the influence of θ3 on TPR is negligible but that of w is significant. In Figures 20(e) and 20(f), TPR appeared to vary slightly within a narrow range with variations in β. From Figure 20(g), it can be concluded that Fx increases with both w and θ3. In contrast, the influence of β on Fx is found to be insignificant, as can be seen in Figures 20(h) and 20(i). The Fz is found to change considerably with θ3, as observed in Figures 20(j), 20(k), and 20(l). The overall tendency of intake performance from the response surfaces was similar to that observed from OFAT analysis, without any significant differences or noticeable issue. This implies that a nonlinear interaction of the geometric parameters does not have a significant influence on the intake performances, and their mutual interaction would have only a minor influence.
3.4. Exploration of Optimal Geometry
An optimization problem was defined to explore the optimal geometry. The inlet geometric parameters that have been considered are defined as design variables. From a design perspective, a larger of the inlet is highly desirable to obtain higher thrust. A higher TPR implies that more useful mechanical energy or work can be done by the captured inlet flow. In addition, a lower drag is advantageous for the range and the maximum speed. With this in mind, the objective functions were set to minimize , maximize TPR, and minimize Fx. Since the maximum and minimum values of the intake performance parameters (i.e., , TPR, and Fx) mostly occur at the lower or upper limits of the exploration range for the geometric parameters (see Sections 3.2 and 3.3), an additional 27 data points are selected as combinations of the design variable at the mid and limit values of the range to complement the response surface obtained in Section 3.3. A multiobjective optimization was conducted based on the genetic algorithm using the nondominated sorting genetic algorithm 3 (NSGA-3) [29] provided by Pymoo [30]. Based on the surrogate models generated using the ordinary kriging provided in the SMT, NSGA-3 explores and evaluates a number of candidates in the 3D design space to find the set of optimal solutions that construct the Pareto front. The initial population was set to 180, and the number of generations was set to 40. The Pareto front resulting from the optimization is shown in Figure 21. From the Pareto solution, it is observed that for a fixed value of , TPR and Fx are inversely proportional. Similarly, and Fx also exhibit an inverse relationship for a fixed TPR. These observations imply that the objective functions must be compromised to determine the final optimal geometry.
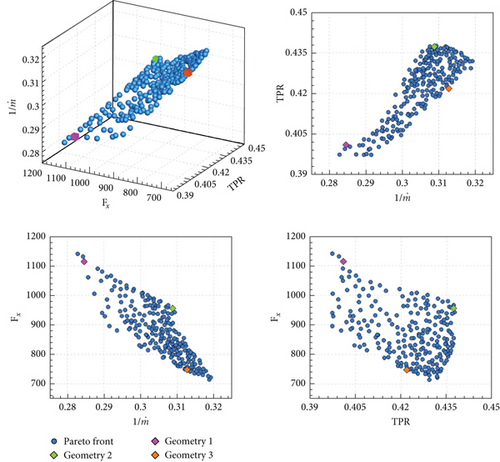
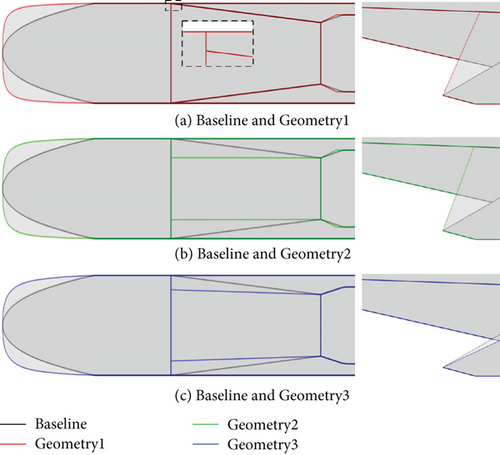
The optimal solution from the Pareto front can be selected by assigning weights to the objective functions based on their importance. Three optimal geometries, determined by assigning the weight of one objective function to 0.9 and the others to 0.05, are considered as examples. The geometries with the weight of , TPR, and Fx set to 0.9 are designated as Geometries 1, 2, and 3, respectively. Geometry 1 corresponds to 0.73, 362.40 mm, and 66.13° for β, w, and θ3, respectively. Similarly, Geometry 2 has 0.70, 226.24 mm, and 69.66°, and Geometry 3 has 0.63, 259.58 mm, and 25.33°. The comparison of the geometries between the baseline and optimal geometry are, respectively, depicted in Figure 22. The inlet performance obtained from RANS analysis and prediction from the surrogate model for the optimal geometries is listed in Table 5.
| (kg/s) | TPR | (K) | Fx (N) | Fz (N) | ||
|---|---|---|---|---|---|---|
| Baseline | ||||||
| Predicted | — | — | — | — | — | — |
| RANS | 3.4207 | 0.3927 | 739.01 | 2.7137 | 912.37 | 382.96 |
| Geometry 1 | ||||||
| Predicted | 3.5148 | 0.4010 | 741.25 | 2.7064 | 1114.44 | 404.98 |
| RANS | 3.5144 | 0.3955 | 743.87 | 2.6973 | 1106.34 | 386.35 |
| Error (%) | 0.01 | 1.37 | 0.35 | 0.34 | 0.73 | 4.60 |
| Geometry 2 | ||||||
| Predicted | 3.2387 | 0.4372 | 703.19 | 2.8449 | 956.10 | 451.02 |
| RANS | 3.2403 | 0.4361 | 704.00 | 2.8417 | 961.89 | 449.75 |
| Error (%) | 0.05 | 0.26 | 0.11 | 0.11 | 0.61 | 0.28 |
| Geometry 3 | ||||||
| Predicted | 3.1981 | 0.4218 | 709.41 | 2.8232 | 748.03 | 433.65 |
| RANS | 3.1981 | 0.4222 | 709.33 | 2.8234 | 749.47 | 435.12 |
| Error (%) | 0.00 | 0.09 | 0.01 | 0.01 | 0.19 | 0.34 |
The differences between the prediction and analysis results were less than 4.6%, indicating that the accuracy of the surrogate model for the response surface was acceptable. All optimal geometries exhibit higher β and lower w than the baseline. Compared to the baseline, Geometry 1, which has a slightly smaller value of w, showed an increase of 2.74%, 0.70%, and 21.26% in , TPR, and Fx, respectively. For Geometry 2, was decreased by 5.27%, and TPR and Fx were increased by 11.04% and 5.43%. For Geometry 3, and Fx were decreased by 6.5% and 17.85%, and TPR was increased by 7.50%. From the OFAT and response surface analysis, a larger value of w was found to be quite beneficial in increasing , while TPR decreases and Fx increases; therefore, the inlet of Geometry 1 maximizes with compromising for some loss of TPR and Fx. The optimal solution was obtained by maximizing w while considering TPR and Fx and increasing θ3 to achieve higher . It can be interpreted that Geometry 2 maximizes TPR while considering Fx, resulting in the lowest w and increasing θ3 to achieve a higher . Geometry 3 minimizes Fx with the lowest θ3, and the optimal solution is achieved by increasing w while considering TPR and .
4. Conclusion
RANS analysis is conducted on the baseline geometry to investigate the characteristics of the flow structure and to compare the intake performance. The baseline geometry satisfies the “shock on lip” and “shock on shoulder” conditions, and it can be confirmed that local separation occurs due to SWBLI at the shoulder. The shock train structure can be confirmed within the isolator. The shock wave structure perpendicular to the streamwise direction is formed differently according to the cross-sectional shape. The flow over the second ramp is compressed, while the flow over the side ramp is expanded, resulting in a relatively low pressure at the side ramp. This leads to the occurrence of vortices and mass spillage as the flow over the second ramp is directed toward the side ramp.
To identify changes in intake performance according to changes in each geometric parameter, the OFAT method is applied to the baseline geometry. The effect of the leading edge shape of the first ramp was the smallest, and the effects of the second ramp onset width and the side wall angle were found to be relatively larger. To investigate the changes in the intake performance as a function of simultaneous variations in multiple geometric parameters, the combinations of geometric parameters were sampled using LHS within the defined range of exploration. The surrogate model for the response surface of each intake performance was generated and analyzed. The overall tendency from the response surfaces was found to be similar to that observed from OFAT analysis, with no notable issues.
To explore and evaluate optimal geometries, the objective functions are defined, and the NSGA-3 algorithm is applied. Depending on the desired intake performance to be maximized/minimized, different optimal geometries are obtained by assigning the importance (weight). It is expected that, depending on the mission and the desired goals of performance improvement, other intake performance parameters can be selected, or other objective functions can be used to obtain the optimal geometry.
The present study indicates that the intake performance of the scramjet inlet does exhibit almost linear behavior with respect to the geometric parameters considered. From a design and optimization perspective for the 3D ramp-type scramjet inlet, it is expected that the construction of accurate response surfaces for intake performance is possible with relatively small costs. Moreover, due to the linear characteristics of the intake performance, the response surface-based optimizations are regarded as an appropriate methodology for exploring the optimal inlet geometry for specific objectives.
Conflicts of Interest
The authors declare no conflicts of interest.
Funding
This work was supported by the Agency For Defense Development Grant Funded by the Korean Government (UD210021JD). This work was supported by the Korea Research Institute for Defense Technology Planning and Advancement (KRIT) grant funded by the Korean Government (DAPA (Defense Acquisition Program Administration)) (No. KRIT-CT-22-030, Reusable Unmanned Space Vehicle Research Center, 2024).
Open Research
Data Availability Statement
The data that support the findings of this study are available from the corresponding author upon reasonable request.


