A Cosimulation Framework for Carrier-Based Aircraft Arrested Landing Process
Abstract
A multiphysics cosimulation methodology for time-domain load analysis of carrier-based aircraft arrested landing is proposed in this paper. The framework integrates six-degree-of-freedom (6-DoF) flight dynamics with nonlinear rigid–flexible coupling mechanisms, incorporating factors including aerodynamic load, arresting cable dynamics, nonlinear landing gear damping characteristics, and airflow interference. A direct lift control strategy is employed to enhance trajectory stability. The computational process employs fourth-order Runge–Kutta integration for the descent phase and transitions to the Newmark method when the hook-to-ramp distance reaches the engagement threshold. The framework is validated through flight dynamics trim analysis, static load benchmarking against the LS-DYNA model, and arresting load compliance with MIL-STD-2066. Simulation results provide insights into glide path, aircraft attitude variations, and transient loads on the landing gear and arresting hook. The analysis quantifies multidisciplinary load interactions, revealing key dynamic characteristics of the arrested landing maneuver. The proposed framework provides a computationally efficient and high-fidelity methodology for evaluating the landing performance of carrier-based aircraft, serving as a valuable reference for system optimization.
1. Introduction
The arrested landing of carrier-based aircraft is highly complex due to the limited deck space, carrier motion, and stringent landing precision requirements. Unlike conventional runway landings, carrier-based aircraft must precisely track a virtual glide slope relative to the moving carrier while compensating for deck motion and aerodynamic interference [1, 2]. After the aircraft touchdown, the arresting hook engages with the arresting cable, rapidly decelerating the aircraft through the arresting gear system [3, 4]. Traditional carrier landing control relies on indirect flight path adjustments, where the throttle regulates the descent rate, the elevator modifies the attack angle, and the rudder maintains lateral alignment [5]. Pilots must manually coordinate these controls to sustain the correct altitude, attitude, and lateral deviation, often executing hundreds of actions within seconds [6]. Direct lift control (DLC) technology has been implemented to reduce pilot workload and improve landing accuracy by decoupling attitude adjustments from flight path control. In 2011, the US Navy implemented the “Magic Carpet” system, which leverages DLC to improve landing accuracy [7].
Research on landing guidance has traditionally modeled aircraft as rigid bodies with 6-DoF, focusing primarily on the touchdown point [8, 9]. While this approach provides a fundamental understanding, it overlooks the dynamics involved in the arrested landing process [10]. Additionally, some researchers have employed the finite element method (FEM) to analyze the structural response of the arresting gear system [11, 12]. However, the arrested landing process involves complex multiphysics interactions, including aerodynamics, structural mechanics, and hydraulic units [13]. Several FEM-based researches have been conducted to predict and analyze the arresting system. Mikhaluk et al. [14] established a full-scale model of the MK7 arresting gear system using commercial software LS-DYNA. Hertz contact theory was employed to simulate the interactions between the cable, pulley, and arresting hook, while the hydraulic damping forces were modeled using spring-damper elements. Shen et al. [15] propose a full-scale multibody dynamics model of the arresting gear system using a variable time-step integration scheme, highlighting that the reflection and superposition of stress waves at the deck sheave are the primary contributors to the peak stress value. Zhang et al. [16] proposed a multibody dynamic model of arresting gear systems applied to the arbitrary Lagrangian Eulerian techniques. The landing gear system is typically represented as a mass-spring-damping model, often ignoring the role of tires and treating energy dissipation using simplified conservation laws [17, 18]. However, a realistic landing simulation must incorporate landing gear buffer performance and flexible tire deformation, as these factors significantly influence aircraft dynamics upon impact [19, 20]. Recent researches emphasize nonlinear damping models to enhance landing gear realism [21–23], integrating tire and landing gear dynamics to improve predictive accuracy [24, 25]. Although previous research accurately models individual subsystems, most researches focus on either landing gear dynamics or arresting system mechanics, rather than a comprehensive simulation of the entire arrested landing process. McDonald et al. [26] presented a model of the F-18 aircraft and landing gear and demonstrated the carrier landing simulation capability. Zhang et al. [27] analyzed arresting hook engagement dynamics and established longitudinal safety boundaries. However, these approaches rely on simplified landing gear and arresting hook models, limiting their ability to capture the full complexity of the arrested landing process.
Furthermore, for a complex system, full-scale FEM simulations are computationally intensive [28], making them impractical for real-time engineering applications [29–31]. To enhance computational efficiency while maintaining dynamic accuracy, a parallel layered scheme has been introduced to separately handle rigid and flexible interactions, ensuring accurate representation of complex systems [32]. Additionally, model order reduction techniques enable real-time simulation and control integration [33]. Therefore, a highly accurate and efficient analysis of the arrested landing process is necessary for the reliable and cost-effective design of carrier-based aircraft. Compared to prior research focusing on isolated or simplified subsystems (Mikhaluk’s FEM-based arresting gear system [14], McDonald’s simplified landing gear [26]), a multidisciplinary cosimulation framework integrating 6-DoF flight dynamics with nonlinear rigid–flexible coupling mechanisms is established, addressing system-level interactions. Building upon our previous research [28], a phased computational architecture integrating the fourth-order Runge–Kutta method and the Newmark method was developed, which enables significantly faster computation than conventional LS-DYNA models. By integrating DLC-based control [7] with the FEM model and carrier motion, the framework effectively captures transient dynamics including peak deceleration and asymmetric MLG load distribution. These innovations enable quantification of time-domain interactions among aerodynamics, hook kinematics, and landing gear phenomena obscured in single-domain analyses.
2. Modeling of the Landing Process for Carrier-Based Aircraft
2.1. System Composition and Reference Frames
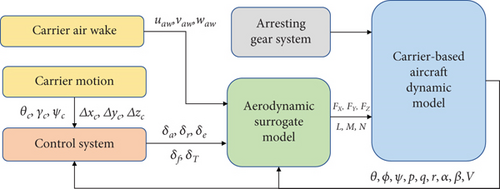
The primary components of the arrested landing process model (as shown in Figure 1) include the aerodynamic surrogate model, carrier-based aircraft dynamic model, control system, arresting gear system, carrier motion, and carrier air wake. The aerodynamic surrogate model is a computational framework designed to calculate the aerodynamic forces through interpolation based on the existing aerodynamic data, flight conditions, control inputs, and interference flows. The aerodynamic data were obtained from both static and dynamic tests conducted at the China Aerodynamics Research and Development Center. The specific data of aerodynamic coefficients are not elaborated in this paper. For detailed aerodynamic coefficients, please refer to Reference [34].
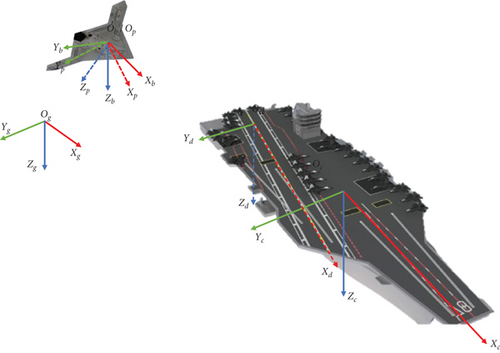
The reference frames in this paper are defined as follows: the earth-fixed inertial reference frame Fg(Og − XgYgZg), the body-fixed reference frame Fb(Ob − XbYbZb), and the wind reference frame Fp(Op − XpYpZp), which is fixed to the aircraft. Additionally, the carrier’s body-fixed reference frame Fc(Oc − XcYcZc) is introduced. Notably, Ob and Op coincide, representing the aircraft’s center of mass, while Oc represents the carrier’s center of mass. These frames are illustrated in Figure 2.
2.2. Dynamics Model of Carrier-Based Aircraft
2.2.1. Aircraft Configuration
2.2.2. Landing Gear
The dynamic modeling framework incorporates a multilayered constitutive approach to simulate tire–ground interactions within the rigid–flexible coupled landing gear system. The tire model combines three components: an Ogden hyperelastic formulation for tread rubber deformation, an orthotropic fabric model for the carcass ply’s anisotropic properties, and a pneumatic formulation describing internal pressure dynamics in the wheel–carcass enclosure [28]. Nodal coordinates at the carcass–wheel interface align with the cord–rubber composite structure, while the coupled analysis accounts for structural nonlinearities, fluid–structure interactions at sealing boundaries and viscoelastic energy dissipation. This integrated methodology simulates transient contact forces during aircraft landing events through systematic resolution of multiphysics coupling mechanisms.
2.2.3. Aircraft Arresting Hook Model
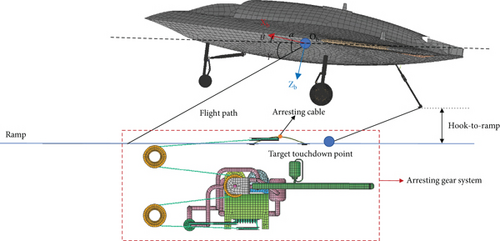
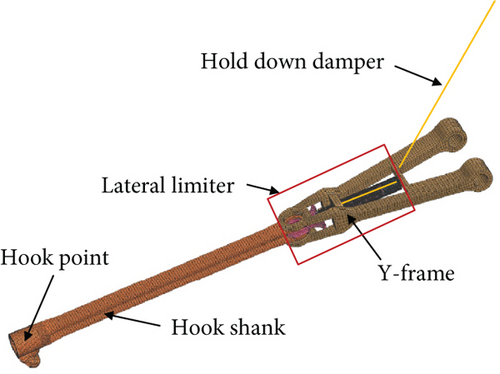
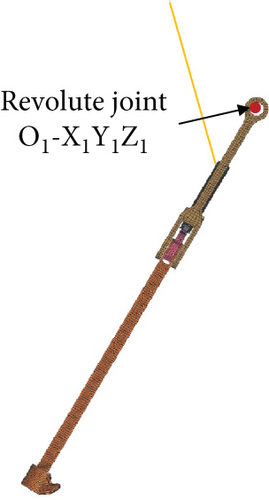
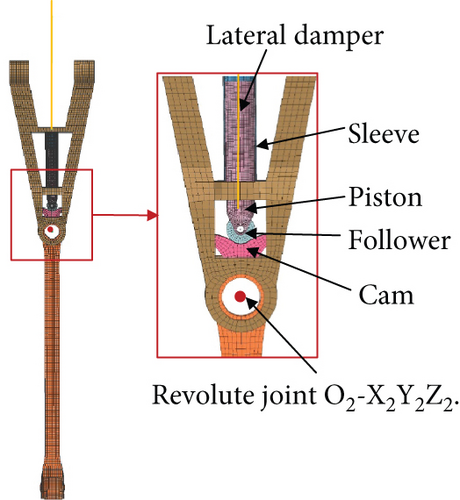
The arresting hook model includes the hook, hook shank, lateral limiter, and hold down damper as shown in Figure 4a. As shown in Figure 4b, arresting loads rotate the Y-frame about revolute joint O1 − X1Y1Z1, compressing the hold down damper. As shown in Figure 4c, the lateral rotation is defined by the revolute joints O2 − X2Y2Z2. The lateral movement of the hook shank rotates the cam and then compresses the damper through the piston. Through the damper, the resistance of longitudinal and lateral movement can be indicated as spring force related to angle and damping force related to angular rate.
2.2.4. Control System Design
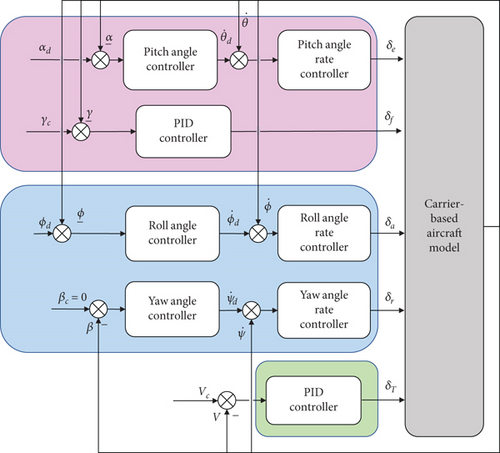
The initial gains are estimated using the Ziegler–Nichols method. Iterative simulations are then conducted to fine-tune the inner-loop parameters, minimizing oscillations while maintaining rapid response. Once the angular rate stabilizes, the outer-loop gains are optimized to enhance attitude tracking, ensuring an optimal balance between response speed, overshoot, and steady-state accuracy. The PID parameters are provided in Table 1.
| Parameter | Description | Value |
|---|---|---|
| [KP11, KI11, KD11] | Outer-loop PID gains for attack angle | [3, 1, 0] |
| [KP12, KI12, KD12] | Outer-loop PID gains for roll angle | [2, 0.5, 0] |
| [KP13, KI13, KD13] | Outer-loop PID gains for sideslip angle | [3, 1, 0] |
| [KP21, KI21, KD21] | Inner-loop PID gains for pitch angle rate | [0.6, 1, 0] |
| [KP22, KI22, KD22] | Inner-loop PID gains for roll angle rate | [0.6, 0.4, 0.01] |
| [KP23, KI23, KD23] | Inner-loop PID gains for yaw angle rate | [6, 3, 0] |
2.3. Dynamic Model of Arresting Gear System
2.3.1. Mechanism of the Arresting Gear System
The arresting gear system represents an integrated electromechanical–hydraulic architecture composed of three core subsystems: cable assemblies (deck pendant and dual purchase cables); a 48-sheave compound pulley mechanism; and five hydraulic dampers comprising two sheave-integrated units, two anchor dampers, and a central control cylinder. The pulley system integrates both fixed and mobile configurations, with components exhibiting negligible elastic deformation in critical load paths modeled as rigid bodies. Hydraulic dynamics are characterized by nonlinear spring-damper elements whose force–displacement–velocity relationships follow experimentally calibrated nonlinear functions. Detailed system specifications and validation procedures are documented in the author’s previous work [28].
2.3.2. Arresting Cable
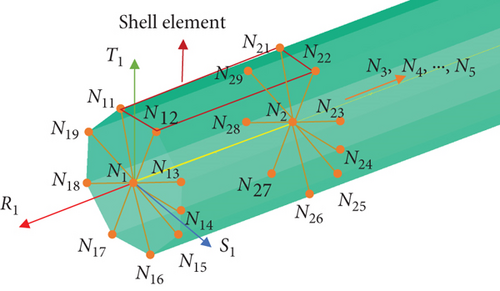
The arresting cable system comprises a pendant above the deck and two purchase cables, interconnected through two connecting muffles. The purchase cables are simulated using multisegment tensile bar elements, while the pendant is represented as a 6-DoF spring beam incorporating rigid shell elements (Figure 6). Each central node Ni (i = 1, 2, ⋯, n) forms a rigid body configuration with nine circumferentially arranged nodes (Ni1, Ni2, Ni3, ⋯, Ni9). Shell elements are established between the circumferential nodes (e.g., N11N12N22N21). The spring beam segment between NiNi+1 exhibits force–moment responses governed by displacement and rotation functions.
2.4. Dynamic Models of Environmental Factors
2.4.1. Carrier Air Wake
2.4.2. Deck Motion
3. Cosimulation and Result Analysis
3.1. Cosimulation
In this paper, a coupling solution method of rigid–flexible model and 6-DoF equation is proposed based on Simulink and FEM solver. The cosimulation framework is shown in Figure 7. In the FEM model, the aerodynamic force and engine thrust are defined as extra load. During the aircraft carrier landing guidance stage, the simulation employs the Runge–Kutta method to solve the 6-DoF equations of the carrier-based aircraft’s rigid body, iterating the time in Simulink. Once the hook-to-ramp distance reaches 0.5 m, the current position, velocity, angular velocity, and aerodynamic loads of the aircraft are retrieved from Simulink to initialize the rigid–flexible model. This model incorporates the 6-DoF function of the aircraft, considering its interaction with the fuselage rigid body, along with aerodynamic loads and node position information. The Newmark method is applied to solve the rigid–flexible model.
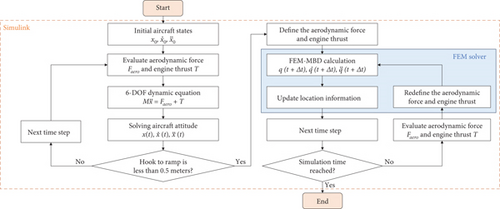
The cosimulation procedure entails the following: (1) given the initial position, attitude angle, and control input of the aircraft, derive the position and attitude angle of the aircraft at the next moment, through solving the rigid body dynamics equations and motion equations of the aircraft until the hook-to-ramp distance reaches 0.5 m; (2) extract current aircraft state, the aerodynamic force, and engine thrust and define the initial state of the rigid–flexible coupling dynamics model; (3) solve the rigid–flexible coupling dynamics model and calculate the state of the aircraft according to the node information of the rigid–flexible coupling dynamics model; (4) obtain the aerodynamic force and engine thrust by solving in Simulink and update the load to the next time step, up to the simulation stop time; (5) obtain the dynamic characteristics of the arrested landing process.
The simulation time is 27 s, and the desired sliding angle of the aircraft is 2.5°. The main model parameters are shown in Table 2. The control inputs and rate limits are shown in Table 3. The material parameter of the arresting hook is shown in Table 4.
| Parameter | Description | Value | Unit |
|---|---|---|---|
| m | Aircraft mass | 14,000 | kg |
| Ix | Roll inertia | 30,898 | kg·m2 |
| Iy | Pitch inertia | 239,720 | kg·m2 |
| Iz | Yaw inertia | 259,970 | kg·m2 |
| S | Wing area | 37 | m2 |
| c | Mean chord | 3.6 | m |
| l | Span | 8.07 | m |
| ρ | Air density | 1.32 | kg/m3 |
| Parameter | Description | Saturation limit | Rate limit |
|---|---|---|---|
| δa | Aileron | (−35°, 35°) | ±100 deg/s |
| δe | Equivalent elevator | (−25°, 10°) | ±40 deg/s |
| δr | Equivalent rudder | (−30°, 30°) | ±82 deg/s |
| δT | Engine throttle | [0, 1.2] |
| Part | Mass density (kg/m3) | Shear modulus (GPa) | Bulk modulus (GPa) |
|---|---|---|---|
| Hook | 8000 | 79 | 167 |
| Hook shank | 7850 | 75 | 160 |
| Y-frame | 7850 | 75 | 160 |
3.2. Aircraft State Analysis of Arrested Landing Process
3.2.1. Implementation Validation
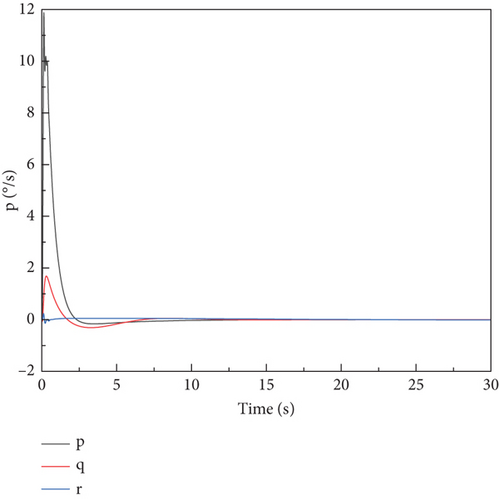
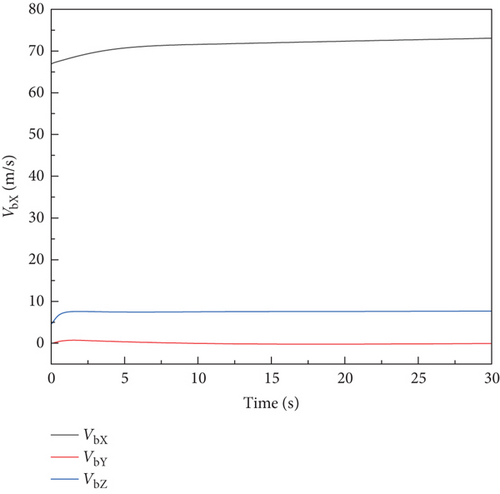
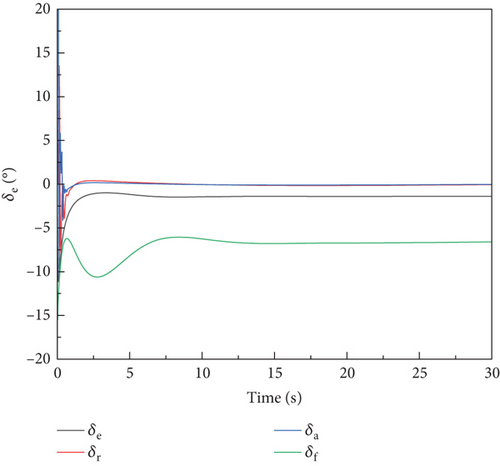
The trim of carrier-based aircraft motion was achieved by running the cosimulation procedure. The trim was achieved through a PID control, which modified the equivalent elevator, equivalent rudder, and aileron to set the aircraft level flight. A longitudinal speed of 67 m/s, pitch angle of 5.5°, and roll angle of 7° were defined as the initial conditions. A PID control strategy was implemented to regulate the engine thrust applied at the aircraft’s center of gravity. Figure 8 shows the results of the trim analysis. The aircraft converges from the unsteady state to the steady and level flying state under the action of the control law.
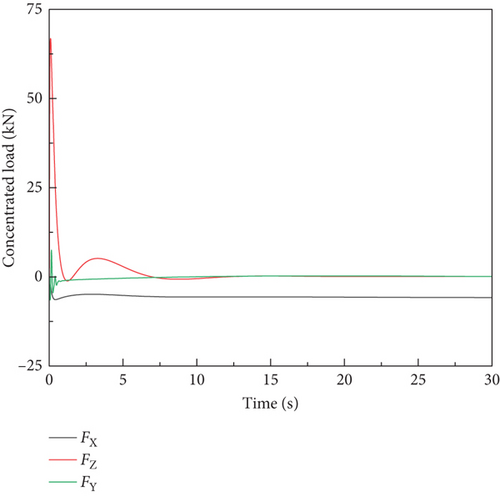
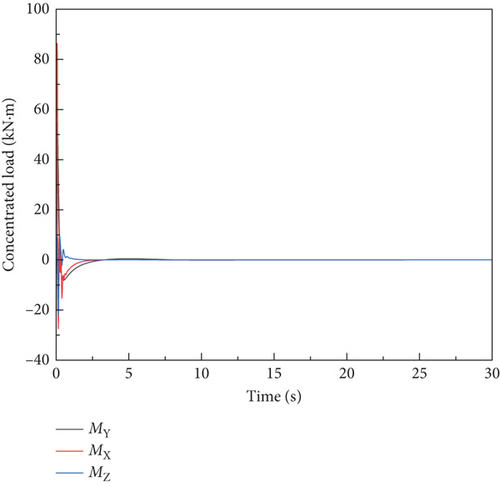
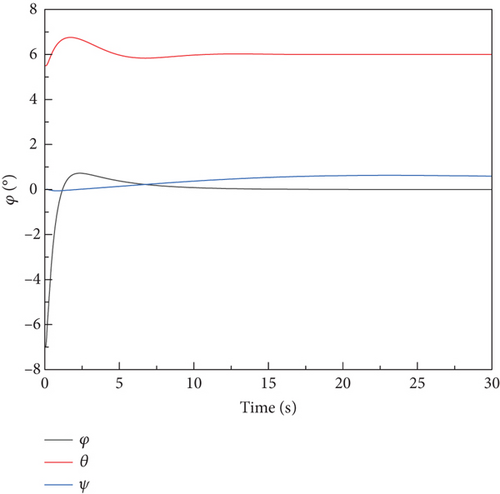
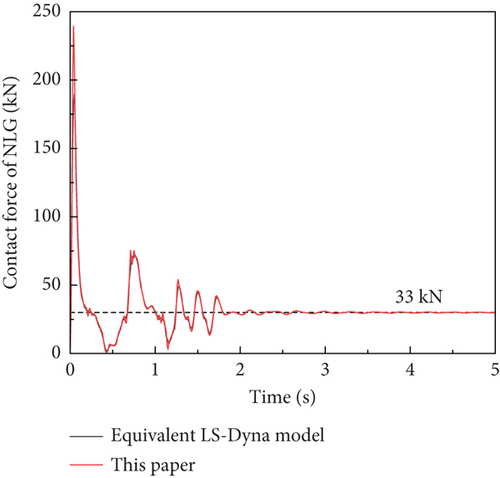
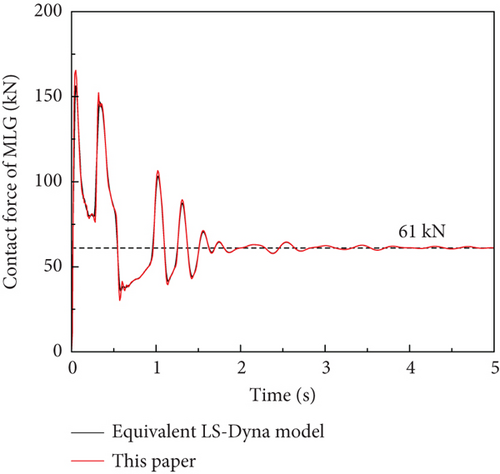
A comparison is conducted with an equivalent model developed in LS-DYNA for the aircraft’s stationary state. Simulation results of the two models are shown in Figure 9. The results demonstrate a strong correlation with the FEM method adopted in this paper.
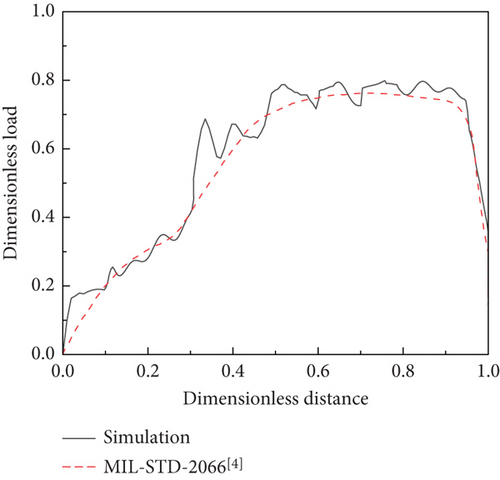
To validate the arresting load, a simulation was conducted under a centered arrestment condition, focusing on arresting load variations. The results were benchmarked against MIL-STD-2066, confirming the accuracy of the model. For a carrier-based aircraft landing at 63.7 m/s, Table 5 presents a comparison between the simulation results and the MIL-STD-2066.
| Simulation result | MIL-STD-2066 [4] | |
|---|---|---|
| Peak arresting load (kN) | 569 | 563 |
| Stopping distance (m) | 64 | 69 |
As shown in Figure 10, at DN = 0.75, the MIL-STD-2066 test data indicate a peak arresting load of 0.76, while the simulation result of arresting load reaches a peak value of 0.79. The load of the simulation results fluctuates obviously, but the overall trend is consistent with the MIL-STD-2066 experimental results, demonstrating strong agreement with experiment. This validation confirms the accuracy of the developed arresting system model.
3.2.2. Aircraft State Analysis of Arrested Landing Process
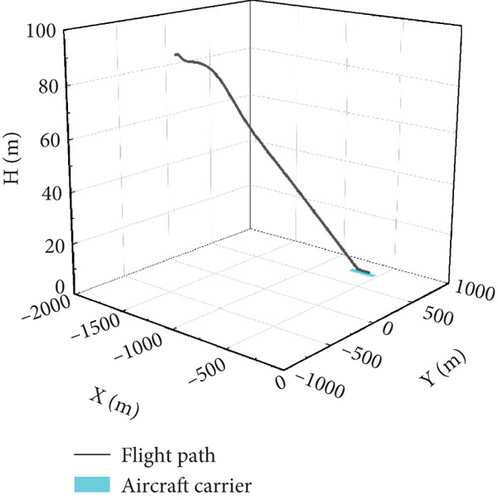
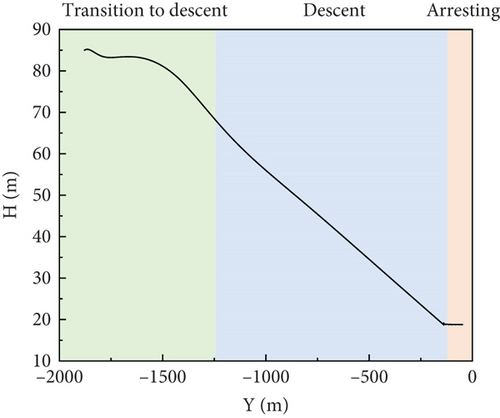
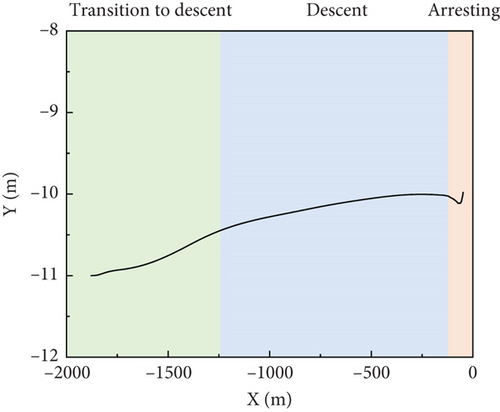
The aircraft landing trajectory is presented in Figure 11a. The simulation process is divided into three phases: level flight to descent, descent, and arresting. During the descent phase, as seen in Figure 11b, under the influence of the carrier wake, the control law can guide the aircraft to descend at a fixed glide angle. Figure 11c provides complementary lateral trajectory throughout the process.
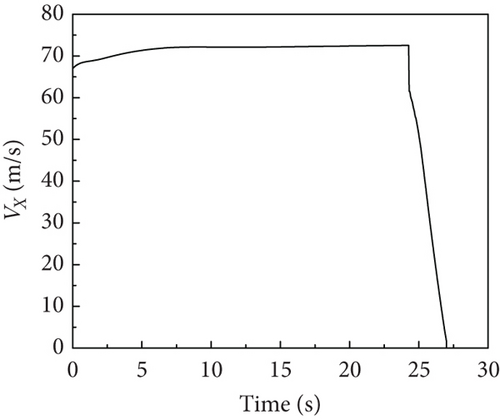
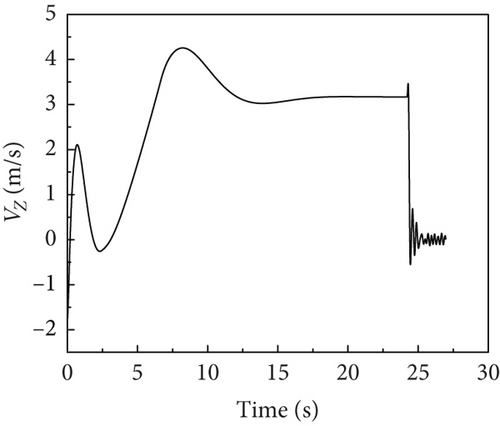
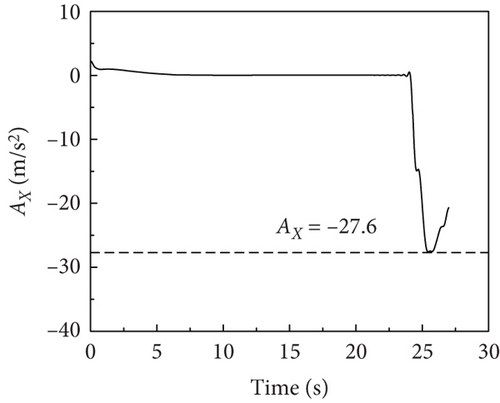
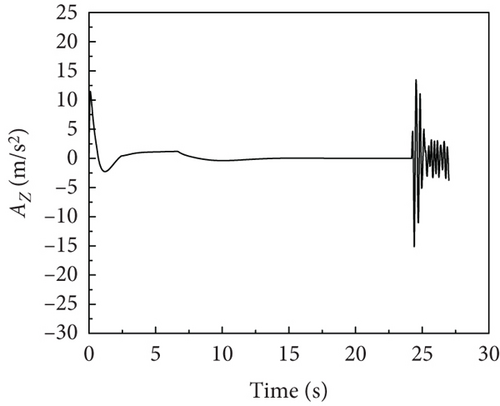
The time history of velocity and acceleration of the aircraft is shown in Figure 12. During the descent phase, the carrier-based aircraft maintains a stable speed of 70 m/s and descends at a constant speed with a vertical speed of 3.1 m/s. The aircraft experiences a rapid speed reduction during the arresting phase, with an acceleration of up to −27.6 m/s2. After touchdown, under the influence of landing gear and arresting loads, the vertical speed and acceleration fluctuate around 0, with an instantaneous vertical acceleration reaching ±14 m/s2.
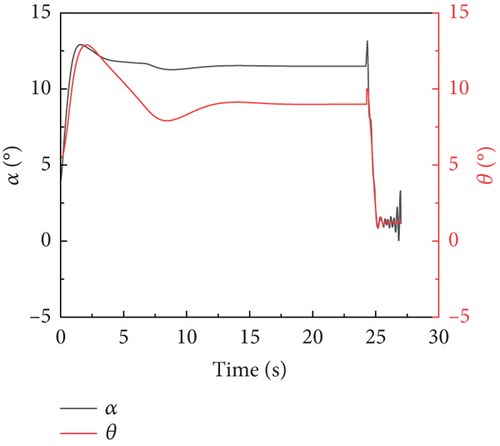
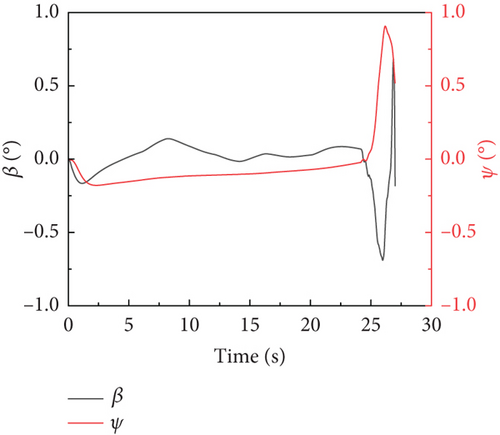
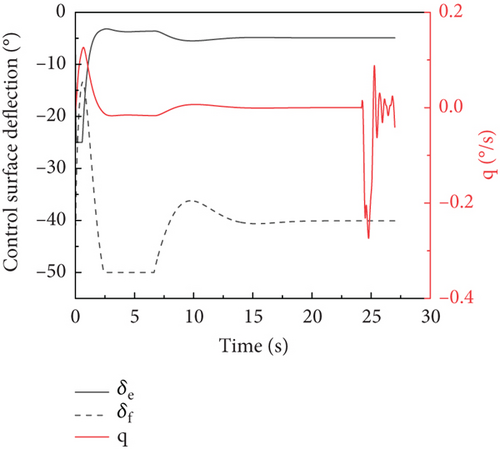
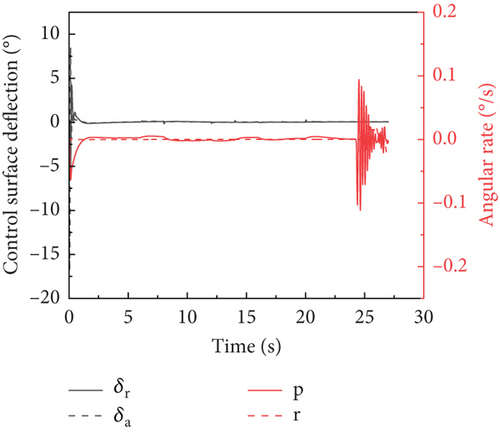
The time history of the aircraft attitude angle is shown in Figure 13a,b, respectively. With the application of the control laws, during the descent phase, the carrier-based aircraft can maintain a stable attack angle of 11.5° and a pitch angle of 9°, while gradually correcting the sideslip angle. During the arrest phase, the pitch angle undergoes rapid fluctuations and then quickly converges towards 0. After the hook engages the cable, asymmetric attitudes can lead to rapid changes in the yaw angle and sideslip angle, which gradually converge towards 0 at the end of the process. The time history of the aircraft attitude rate and control surface deflection is shown in Figure 13c,d, respectively. In the descent stage, the aircraft has a zero angle rate and maintains a stable attitude. However, after the arresting hook engages with the cable, the angle rate of the carrier-based aircraft changes more significantly.
3.2.3. Arrested Landing Maneuver
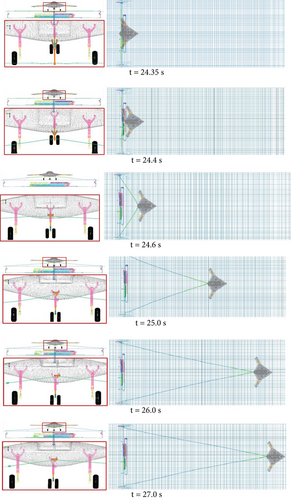
The arrested landing maneuver is shown in Figure 14. Based on the simulation results, the carrier-based aircraft engaged the arresting hook at 24.35 s. At the moment of hook engagement, the aircraft had a pitch angle of 9°, a roll angle of 0.3°, and a yaw angle of −0.02°. Immediately after hook engagement, the arresting hook quickly swung upwards, reaching its maximum upward position in 0.25 s. As the arresting load increased, the arresting hook swayed left and right. The carrier-based aircraft was finally stopped at 27 s, with the entire process from hook engagement to aircraft stopping taking 2.7 s. This indicates the effectiveness of the control and arresting gear system in ensuring a safe and controlled deceleration on the carrier deck.
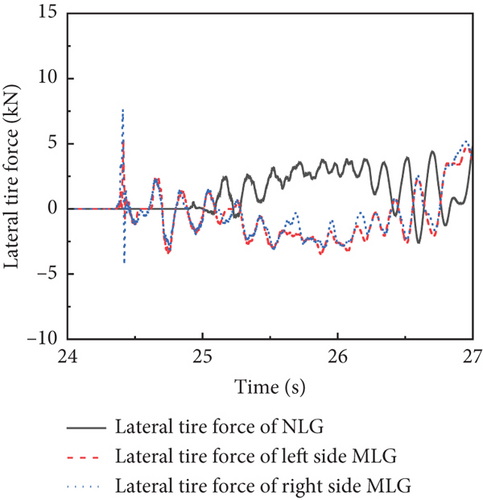
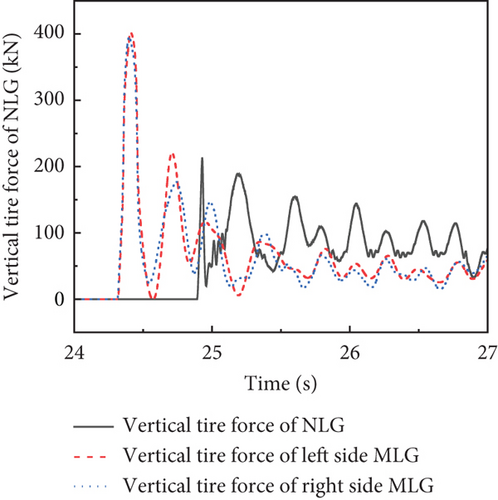
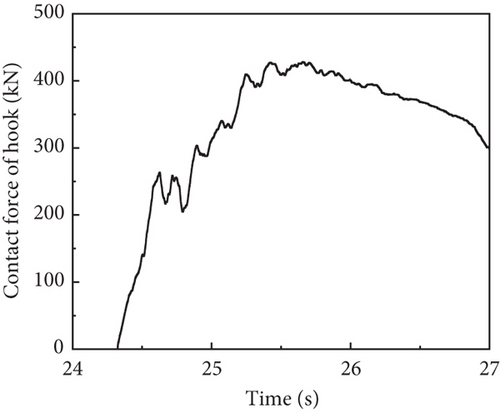
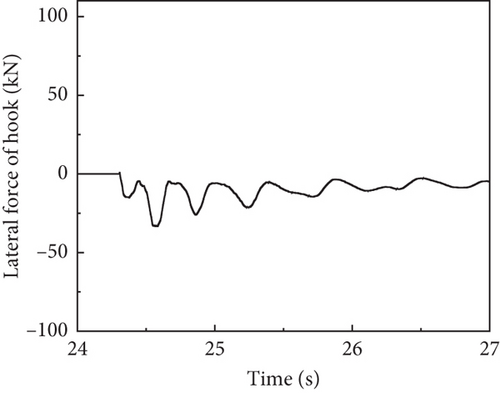
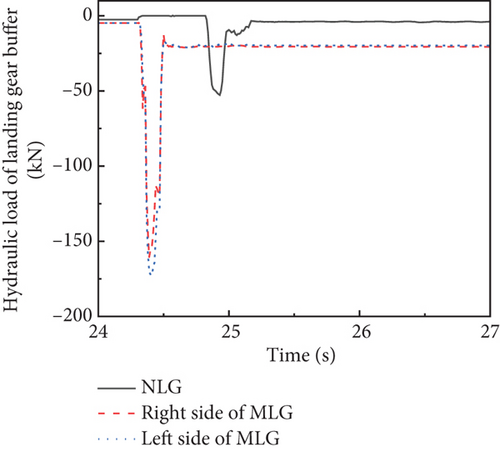
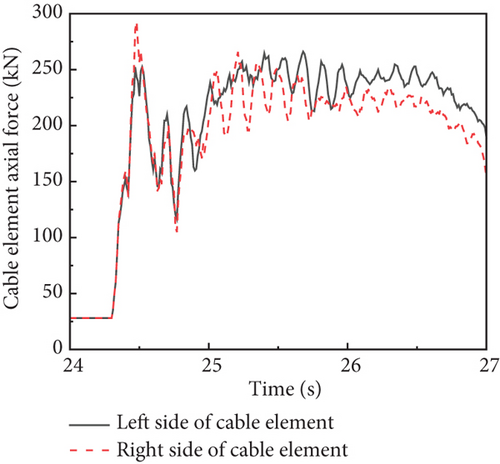
The time history of lateral and vertical tire force is presented in Figure 15a,b, respectively. Due to the 0.3° roll angle of the carrier-based aircraft at the moment of hook engagement, the lateral loads on the MLG were not completely symmetrical, and the vertical load on the left landing gear was also greater. The MLG touched down at 24.3 s, while the NLG touched down at 24.8 s. The peak load on the MLG could reach 400 kN, and the peak load on the NLG could reach 200 kN. The time history of the hook arresting load and lateral load is shown in Figure 15c,d. The engagement between the arresting hook and the arresting cable occurred around 24.35 s, and the arresting load reached the peak value around 25.5 s, gradually decreasing afterward. The arresting hook produces lateral force after the hook engages. The lateral force increases with the increase of the arresting load. The hydraulic load of the landing gear buffer is shown in Figure 15e. The variation trend of the hydraulic load in the landing gear shock absorber closely aligns with the variation trend of the vertical tire force. Take the arresting cable elements 3.5 m from the left and right sides of the hook engagement point of the arresting cable, and the axial force of the cable element is shown in Figure 15f. The changes in the axial forces of the arresting cable on both sides also support the above conclusion.
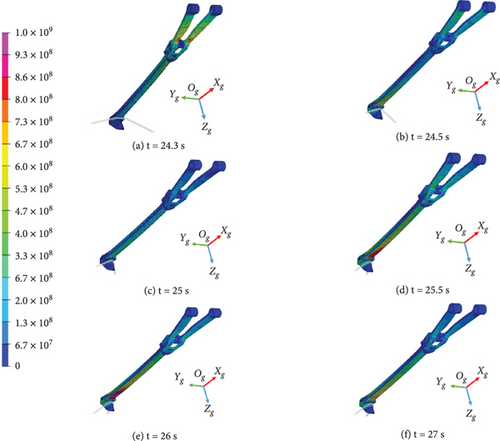
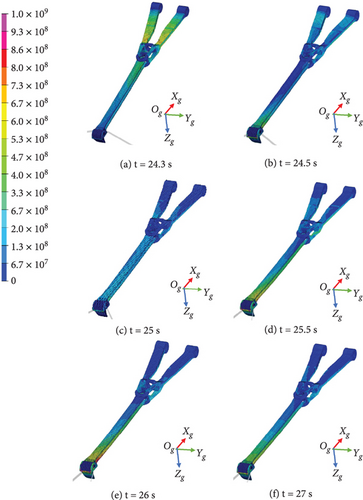
The front and rear face stress distribution of the arresting hook is shown in Figures 16 and 17, respectively. During the upward swing phase of the arresting hook, the high-stress area occurs in the Y-frame. The maximum stress area appears at the engagement point between the hook and the cable, and a large area of the high-stress region also emerges at the intersection of the hook shank and the hook.
4. Conclusions
This paper introduces a cosimulation framework that integrates multidisciplinary load sources, successfully demonstrated in simulating an arrested landing maneuver with DLC. The proposed framework is validated through trim calculations, a comparison of the aircraft’s stationary state model response with an equivalent LS-DYNA model, and verification of arresting load compliance with MIL-STD-2066. And the implementation of an unsteady time-domain formulation for aerodynamics allows the use of FEM simulation to accurately predict the aircraft glide and arresting with the remarkable advantage of allowing the simulations of other maneuvers, such as landings and key structure analysis. Simulation results reveal the key mechanical characteristics and parameter changes of the carrier-based aircraft, which verifies the stability and controllability of the aircraft during the arrested landing process. The method proposed in this paper enables quantitative calculations and analyses of various loads during the arrested landing process of carrier-based aircraft, providing a clear understanding of the magnitude, direction, and variation patterns of the forces acting on the aircraft during landing.
Future research can enhance aerodynamic and structural coupling models through dynamic grid adaptation and CFD-FEM cosimulation, integrating fully flexible airframe dynamics with high-fidelity deck wind fields to improve arrested landing response prediction. While computational intensiveness remains challenging, implementing neural network–enhanced reduced-order models could improve simulation efficiency, enabling real-time performance evaluation. This optimized framework would provide critical insights for carrier-based aircraft design through industry-validated hardware-in-loop testing.
Nomenclature
-
- ρ, ρh
-
- air density, oil density (kg/m3)
-
- c
-
- aerodynamic chord length (m)
-
- Fx, Fy, Fz
-
- three components of aerodynamic forces in the body-fixed reference frame (N)
-
- L, M, N
-
- aerodynamic moment in the body-fixed reference frame (Nm)
-
- p, q, r
-
- the body fixed rotational angle rates (rad/s)
-
- α
-
- attack angle (rad)
-
- V, Vc
-
- the air speed of aircraft and carrier deck (m/s)
-
- m
-
- mass of aircraft (kg)
-
- δe
-
- equivalent elevator deflection (rad)
-
- δr
-
- equivalent rudder deflection (rad)
-
- δT
-
- throttle of engine
-
- Fs, Fh, Fa
-
- force of buffer, oil damping force, and air spring force of the left main landing gear, right main landing gear, and nose landing gear (N)
-
- Δxc, Δyc, Δzc
-
- surge, sway, and heave (m)
-
- uaw, vaw, waw
-
- three components of air wake (m/s)
-
- Cxq
-
- aerodynamic drag coefficient derivative due to attack angle
-
-
- aerodynamic drag coefficient derivative due to leading edge flap deflection
-
- Cyp
-
- lateral force coefficient due to roll angle rate
-
-
- lateral force coefficient derivative due to equivalent rudder deflection
-
- Czq
-
- aerodynamic lift coefficient due to pitch angle rate
-
-
- aerodynamic lift coefficient due to leading edge flap deflection
-
- Cl0
-
- rolling moment coefficient base value
-
-
- rolling moment coefficient derivative due to equivalent rudder deflection
-
- Clp
-
- rolling moment coefficient derivative due to roll angle rate
-
-
- pitching moment coefficient derivative due to equivalent elevator deflection
-
- Cn0
-
- yawing moment coefficient base value
-
-
- yawing moment coefficient derivative due to equivalent rudder deflection
-
- Cnr
-
- yawing moment coefficient derivative due to the yaw angle rate
-
- Fb(Ob − XbYbZb)
-
- body-fixed reference frame Fb with origin Ob and axes Xb, Yb, Zb
-
- Fp(Op − XpYpZp)
-
- Wind reference frame Fp with origin Op and axes Xp, Yp, Zp
-
- Sref
-
- the reference wing area (m2)
-
- b
-
- reference wing span (m)
-
- Tx, Ty, Tz
-
- three components of engine thrust in the body-fixed reference frame (N)
-
- ϕ, θ, ψ
-
- attitude angle of aircraft (rad)
-
- u, v, w
-
- the body fixed velocity (rad/s)
-
- β
-
- the sideslip angle (rad)
-
- Q
-
- dynamic pressure (N/m2)
-
- g
-
- gravitational constant (m/s2)
-
- δa
-
- aileron deflection (rad)
-
- δf
-
- flap deflection (rad)
-
- FNLG, FMLG
-
- contact force of nose landing gear and main landing gear (N)
-
- Ix, Iy, Iz, Ixz
-
- moment of inertia (kg m2)
-
- γc, θc, ψc
-
- attitude angle of the carrier (rad)
-
- Cx0
-
- aerodynamic drag coefficient base value
-
-
- aerodynamic drag coefficient derivative due to equivalent elevator deflection
-
- Cy0
-
- lateral force coefficient base value
-
-
- lateral force coefficient due to aileron deflection
-
- Cz0
-
- aerodynamic lift coefficient base value
-
-
- aerodynamic lift coefficient due to equivalent elevator deflection
-
- Cyr
-
- lateral force coefficient due to the yaw angle rate
-
-
- rolling moment coefficient derivative due to aileron deflection
-
- Clr
-
- rolling moment coefficient derivative due to the yaw angle rate
-
- Cm0
-
- pitching moment coefficient base value
-
- Cmq
-
- pitching moment coefficient derivative due to pitch rate
-
-
- yawing moment coefficient derivative due to equivalent elevator deflection
-
- Cnp
-
- yawing moment coefficient derivative due to roll angle rate
-
- Fg(Og − XgYgZg)
-
- earth-fixed inertial reference frame Fg with origin Og and axes Xg, Yg, Zg
-
- Fc(Oc − XcYcZc)
-
- carrier body-fixed reference frame Fc with origin Oc and axes Xc, Yc, Zc
Subscripts
-
- MLG
-
- main landing gear
-
- NLG
-
- nose landing gear
Conflicts of Interest
The authors declare no conflicts of interest.
Author Contributions
Shao Haoyuan: conceptualization, methodology, writing—original draft, supervision. Li Daochun: data curation, formal analysis, validation. Kan Zi: investigation, resources, writing—review and editing. Ding Menglong: visualization, software, writing—review and editing. Xiang Jinwu: funding acquisition, validation, project administration.
Funding
This work was supported by the Key Research and Development Program of Zhejiang Province (2024SSYS0087) and the Fundamental Research Funds for the Central Universities.
Open Research
Data Availability Statement
Data is available on request from the authors.


