Experimental Study on the Spray Characteristics of Streamlined Direct-Injection Atomizer
Abstract
This article investigates the atomization characteristics of a streamlined direct-injection atomizer, which finishes the atomization process by coupling the air swirl with the conventional direct injector. First, we used experimental methods to focus on controlling its structural parameters and the liquid-to-gas flow ratio. We used a phase Doppler interferometer to measure the Sauter mean diameter (SMD) of the droplets and used a high-speed camera to capture the atomization field images. The experimental results showed that, under all test conditions, the overall range of the SMD was from 84 to 100 μm. It was found that a higher liquid-to-gas flow ratio resulted in a smaller SMD, a larger distance between the liquid and air outlets led to a larger SMD, and an increase in the axial angle of the liquid jet led to a smaller SMD. We found the influence parameters of the atomization characteristics of the streamlined direct-injection atomizer based on the dimensional analysis, namely, π theorem. In addition, a calculation formula for the SMD was proposed, with multiple linear regression conducted on the sample data from experiment. Based on the findings of this study, the streamlined direct-injection atomizer can be used to dynamically control its spray characteristics according to the requirements of aviation engine combustion chambers.
1. Introduction
The growing demands for energy and stricter [1] emission regulations have sparked research that seeks significant improvements across all kinds of industries. Optimizing the combustion chamber of an aeroengine is a fundamental approach to reducing its fuel consumption and emissions [2]. The nozzle is a critical element of the combustion chamber that influences both the stability and the efficiency of combustion [3, 4]. Enhancing the capability of atomization of the nozzle can improve the ignition performance of the engine [5] and reduce carbon accumulation [6]. Cranfield extensively researched the geometric shapes of nozzles to determine the optimal size of their holes for a given momentum–flux ratio [7]. The National Aeronautics and Space Administration (NASA) of the United States has also conducted extensive studies on jets in crossflow to determine the optimal geometric features of the system, including the spacing between holes, the shape of the nozzle, and the area of flow [8]. Muhammad et al. [9] conducted experiments on the influence of different structures of pressure swirl nozzles on atomization quality and found that the optimal length-to-diameter ratio for the swirl chamber is 3.75, where atomization quality is best. Wang et al. [10] used a PDPA measurement system to determine the distribution of liquid droplets as a function of distance. Halder et al. [11] determined the influences of nozzle flow and nozzle geometry on the shape and size of a fully developed air core in a hollow cone swirl nozzle by theoretical and experimental studies. Balasubramanyam and Chen [12] employed numerical simulation methods to determine the effect of the length of the straight pipe section at the nozzle exit on liquid film thickness. Xue et al. [13] used numerical simulations to explore the influence of the nozzle expansion angle on flow coefficient, atomization cone angle, and liquid film thickness. Thus, the optimization of the nozzle is a key technology in the design of the aeroengine.
Nozzles can be categorized into pressure nozzles and pneumatic nozzles according to the principle of atomization [9]. The pressure nozzle relies on the pressure of fuel supply to generate centrifugal force [14] and contains specific one-way and multiway points. The pneumatic atomizer enhances the breakup of the liquid film or column by introducing airflow around the liquid jet [15]. It has a more intricate mechanism and structure than the pressure nozzle and offers a wider range of options. For example, the direct-injection nozzle and the centrifugal nozzle introduce swirls of varying intensities that yield different characteristics of atomization [16]. The streamlined direct-injection nozzle studied in this article belongs to this category and is a combination of multiple direct-injection nozzles and an air swirl. The air swirl helps the fine atomization of the droplets of fuel and causes them to significantly disperse in the flow field. This also enhances fuel–air mixing to achieve spatially uniform droplets of fuel in the spray field at very short distances from the exit of the nozzle. The rotational crossflow from the swirler not only enhances the fragmentation and dispersion of the droplets but also contributes to the stability of the flame [17].
Research on the characteristics of atomization of atomizers has matured in recent years owing to extensive work in the area. Ferrenberg et al. and Lefebvre [18, 19] studied the parameters influencing atomization, including the velocity, density, viscosity, and surface tension of the liquid as well as the geometry of the nozzle. They were able to characterize most sprays by their spray angle and mean droplet size rather than local values. However, this approach makes it difficult to evaluate the effect of each parameter. Consequently, empirical correlations cannot be expected to accurately reproduce the characteristics of the spray over a wide range of conditions. Furthermore, Lefebvre and Wang [20] studied the factors affecting the atomization characteristics of pressure swirl nozzles and summarized an empirical formula for predicting Sauter mean diameter (SMD). The average diameter of atomization droplets is mostly described by the SMD or the mass median diameter (MMD) [21]. There are strict requirements for their sizes based on different combustion chamber operating environments. There is no universal theoretical system for this due to the complexity of atomization process and the diversity of atomizer [20]. Many researchers still focus on studying the basic units of atomization, such as the atomization of the lateral jet and pressure-induced centrifugal atomization. Consider the atomization of a transverse jet as an example. There is no generally accepted empirical formula for even the SMD, let alone the deformed direct injection of a transverse jet. This is at variance with the growing complexity of the structure of the atomizer of the aeroengine.
The characteristics of the spray commonly include its cone angle, the length of breakup of the liquid film, its particle size distribution, distribution of particle velocity, and quality of gas–liquid mixing [22, 23]. This study focuses on identifying the relevant parameters as well as the corresponding rules of their impact on the droplet size and spatial distribution of a streamlined direct-injection atomizer. We use experimental methods to control the droplet size and spatial distribution of the fuel by adjusting these parameters. By analyzing the mechanisms of interfacial instability, breakup, evaporation, and mixing in a two-phase gas–liquid system, we propose a targeted method for controlling the quality of atomization of the atomizer device and develop empirical formulae for it.
2. Experimental Methodology
The streamlined direct-injection atomizer combines direct injection with an air swirl. Multiple jets are expelled from nozzles installed on the inner wall of the annulus. These jets are subjected to primary and secondary breakup processes under the influence of the strong swirling flow generated by the axial air swirler, which ultimately leads to uniform atomization.
This type of atomizer is a fundamental component of the nozzle of the main combustion chamber of a composite aviation engine. We establish the operating conditions according to specifics of the main combustion chamber and use experimental methods to determine the patterns of influence of the droplet size and the spatial distribution of the fuel of the atomizer from the perspectives of the structural parameters and conditions of gas–liquid flow and identify the control parameters.
2.1. Design and Construction of the Experimental System
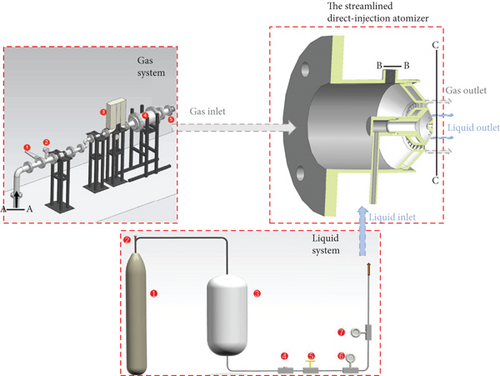
The experimental system is divided into three main parts: the streamlined direct-injection atomizer, the gas system, and the liquid system. Their connection is depicted in Figure 1. Section A is the air compressor interface section, where the high-pressure gas from the air compressor flows into the gas system through this section. Section B connects to the pressure sensor, and Section C is the gas and liquid outlet section. The gas and liquid enter the streamlined direct-injection atomizer from the gas system and liquid system, respectively. The gas is expelled through the air swirler, while the liquid is expelled through the liquid nozzle. Finally, they mix and interact downstream of the outlet (Section C in Figure 1.). This is the measurement area for the PDI equipment and the high-speed camera.
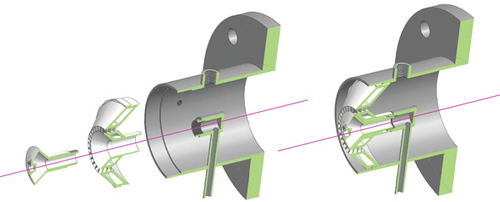
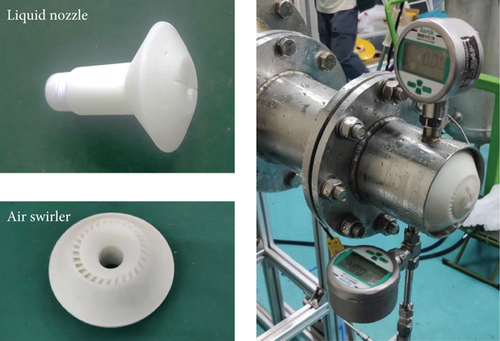
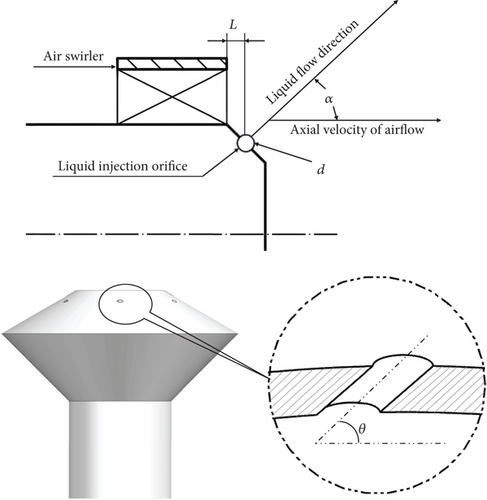
The streamlined direct-injection atomizer consists of an air swirler and a liquid nozzle, as shown in Figure 2. This not only satisfies the requirements of the experiment but also reduces the cost of the material and the time required to conduct the experiment. The same air is used throughout, and only the liquid nozzle needs to be replaced to adjust structural parameters which are the distance between the nozzle and the outlet of the air swirl (L), the axial angle of the liquid jet (α), the angle of the injector (θ), and the diameter of the orifice used for liquid injection (d). This structure requires only one thread for locking and sealing, which makes it convenient for assembly and disassembly to enhance the efficiency of the experiment. The air swirler and liquid nozzle were 3D printed, with an accuracy of approximately 20 μm as shown in Figure 3, thereby reducing experimental errors.
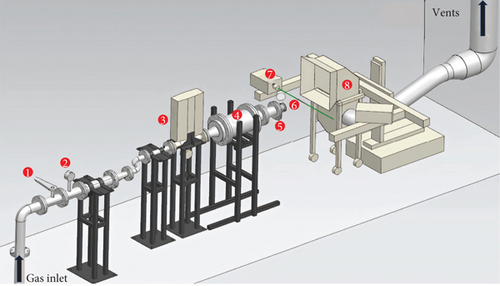
The gas system is shown in Figure 4. The air is pressurized by an air compressor (a single air compressor in this system can deliver up to 300 g/s of airflow and can be freely adjusted within the range of the output to satisfy the requirements of most atomization experiments) and directed into the laboratory through pipes. The airflow is regulated by switches and control valves. The gas mass flowmeter passes through pipes of different diameters, followed by a long straight pipeline to ensure the accurate measurement of flow. Upon entering the stable section with a large diameter, the area of the pipeline gradually decreases as it enters the experimental section to reduce flow separation. The sprayed gas and liquid mist are received by the droplet collection unit. The main function of the droplet collection unit is to prevent it from damaging the equipment at the back. This unit is connected to a suction fan. The liquid mist enters and the gas is sucked in, while the liquid droplets adhere to the wall, collect and flow down, and are collected and recycled by the water tank below. This can solve the problem of the flow of the gas and liquid droplets being obstructed, which causes them to bounce back owing to their high speed. On the one hand, the backflow of the gas changes the shape of the entire atomization field, and, on the other hand, the rebounding liquid droplets contaminate the PDI data. The speed of the suction fan is adjustable, and the corresponding power that eliminates rebounding while minimizing disturbance to the atomization field can be calculated according to the rate of gas flow. However, due to limitations on the power of the equipment, it is not possible to meet the requirements for the entire range of gas flow rates merely to ensure that the experiment can proceed normally.
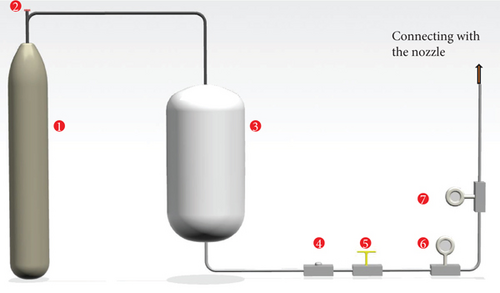
The liquid system is shown in Figure 5. Air is extracted from a high-pressure gas cylinder and then depressurized through a pressure-reducing valve before being channeled into a pressure-resistant pipeline and stored in a liquid storage tank to maintain a relatively stable pressure. The gas cylinder has a maximum pressure of 15 MPa, while the storage tank is capable of withstanding up to 6 MPa of pressure. It can hold a maximum of 60 L of water to ensure long-term water supply within a wide adjustable range. As the liquid level in the storage tank decreases, so does the supply pressure. Therefore, a higher gas supply pressure can be used during experiments performed at a high rate of flow. Control of the liquid circuit is achieved by using on/off valves and regulating valves. Once the rate of flow has been adjusted, an electromagnetic on/off valve can be used for convenience. The normally closed electromagnetic on/off valve ensures that no accident occurs in case of unexpected power failure. The mass flow rate is measured by using a Coriolis force flowmeter, while the pressure gauge serves as a reference while the rate of flow is adjusted. It also ensures that the pressure of the nozzle does not exceed the design range, thereby ensuring the safety of the experiment. The working medium of the liquid used in this experiment was water. It can be replaced with kerosene in future experiments and can be recovered through the droplet collection unit to reduce cost and provide environmental benefits.
2.2. Experimental Project
The geometric parameters of the nozzle determine its characteristics of atomization, and this makes them the focal point in the design and performance optimization of the nozzle [24, 25]. Our experiment explored the influence of four structural parameters on atomization, particularly on the SMD, under different operating conditions. They are the distance between the nozzle and the outlet of the air swirl (L), the axial angle of the liquid jet (α), the angle of the injector (θ), and the diameter of the orifice used for liquid injection (d), as shown in Figure 6.
To identify regularities in the experiment, we designed 12 structures that can be divided into four groups of control experiments. Group 1 contained Cases 1, 2, and 3; Group 2 contained Cases 1, 4, and 5; Group 3 consisted of Cases 1, 6, 7, and 8, while Group 4 included Cases 1, 9, 10, 11, and 12. Case 1 served as a basic group for comparison, as shown in Table 1.
| Number | Structural parameters | |||
|---|---|---|---|---|
| α (°) | L (mm) | d (mm) | θ (°) | |
| Case 1 | 30 | 4 | 0.8 | 45 |
| Case 2 | 10 | 4 | 0.8 | 45 |
| Case 3 | 50 | 4 | 0.8 | 45 |
| Case 4 | 30 | 2 | 0.8 | 45 |
| Case 5 | 30 | 6 | 0.8 | 45 |
| Case 6 | 30 | 4 | 0.6 | 45 |
| Case 7 | 30 | 4 | 1.0 | 45 |
| Case 8 | 30 | 4 | 1.2 | 45 |
| Case 9 | 30 | 4 | 0.8 | 20 |
| Case 10 | 30 | 4 | 0.8 | 25 |
| Case 11 | 30 | 4 | 0.8 | 35 |
| Case 12 | 30 | 4 | 0.8 | 55 |
To examine the influence of various structural parameters on the efficiency of atomization under different operating conditions, we carried out each group of experiments under five operating conditions, named Condition 1 to Condition 5, according to the ratio of liquid-to-gas flow used, as shown in Table 2. It is important to note that the liquid-to-gas mass ratio was set by considering only the mass of air flowing through the swirling device for atomization and is different from the commonly used measure of the fuel-to-air ratio in the combustion chamber. During the experiments, both the mass of air and the flow rate of liquid were adjusted simultaneously to achieve different liquid-to-gas mass flow ratios. In this way, a total of 60 sets of data were obtained for further analysis. The velocity of liquid is shown in Table 3, Table 4 is the Reynolds number, and Table 5 is the Weber number.
| Operating conditions | Liquid flow rate (g/s) | Gas flow rate (g/s) | Velocity of air (m/s) | Liquid-to-gas flow ratio |
|---|---|---|---|---|
| 1 | 2.40 | 64 | 139.3 | 0.037 |
| 2 | 7.60 | 75 | 163.3 | 0.101 |
| 3 | 11.23 | 81 | 176.3 | 0.139 |
| 4 | 12.21 | 81 | 176.3 | 0.151 |
| 5 | 22.21 | 86 | 187.2 | 0.258 |
| Velocity of liquid (m/s) | Condition 1 | Condition 2 | Condition 3 | Condition 4 | Condition 5 |
|---|---|---|---|---|---|
| Case 1 | 0.60 | 1.89 | 2.79 | 3.04 | 5.52 |
| Case 2 | 0.60 | 1.89 | 2.79 | 2.40 | 4.10 |
| Case 3 | 0.60 | 1.89 | 2.79 | 2.40 | 4.10 |
| Case 4 | 0.60 | 1.89 | 2.79 | 2.40 | 4.10 |
| Case 5 | 0.60 | 1.89 | 2.79 | 2.40 | 4.10 |
| Case 6 | 1.06 | 2.87 | 3.92 | 4.27 | 7.29 |
| Case 7 | 0.38 | 1.03 | 1.41 | 1.54 | 2.63 |
| Case 8 | 0.27 | 0.72 | 0.98 | 1.07 | 1.82 |
| Case 9 | 0.60 | 1.89 | 2.21 | 2.40 | 4.10 |
| Case 10 | 0.60 | 1.89 | 2.21 | 2.40 | 4.10 |
| Case 11 | 0.60 | 1.89 | 2.21 | 2.40 | 4.10 |
| Case 12 | 0.60 | 1.89 | 2.21 | 2.40 | 4.10 |
| Rej | Condition 1 | Condition 2 | Condition 3 | Condition 4 | Condition 5 |
|---|---|---|---|---|---|
| Case 1 | 477.46 | 1511.97 | 2234.14 | 2429.10 | 4418.54 |
| Case 2 | 477.46 | 1511.97 | 2234.14 | 2429.10 | 4418.54 |
| Case 3 | 477.46 | 1511.97 | 2234.14 | 2429.10 | 4418.54 |
| Case 4 | 477.46 | 1511.97 | 2234.14 | 2429.10 | 4418.54 |
| Case 5 | 477.46 | 1511.97 | 2234.14 | 2429.10 | 4418.54 |
| Case 6 | 848.83 | 2687.95 | 3971.80 | 4318.40 | 7855.18 |
| Case 7 | 305.58 | 967.66 | 1429.85 | 1554.63 | 2827.87 |
| Case 8 | 212.21 | 671.99 | 992.95 | 1079.60 | 1963.80 |
| Case 9 | 477.46 | 1511.97 | 2234.14 | 2429.10 | 4418.54 |
| Case 10 | 477.46 | 1511.97 | 2234.14 | 2429.10 | 4418.54 |
| Case 11 | 477.46 | 1511.97 | 2234.14 | 2429.10 | 4418.54 |
| Case 12 | 477.46 | 1511.97 | 2234.14 | 2429.10 | 4418.54 |
| Weg | Condition 1 | Condition 2 | Condition 3 | Condition 4 | Condition 5 |
|---|---|---|---|---|---|
| Case 1 | 255.23 | 350.50 | 408.82 | 408.82 | 460.85 |
| Case 2 | 255.23 | 350.50 | 408.82 | 408.82 | 460.85 |
| Case 3 | 255.23 | 350.50 | 408.82 | 408.82 | 460.85 |
| Case 4 | 255.23 | 350.50 | 408.82 | 408.82 | 460.85 |
| Case 5 | 255.23 | 350.50 | 408.82 | 408.82 | 460.85 |
| Case 6 | 191.42 | 262.88 | 306.62 | 306.62 | 345.64 |
| Case 7 | 319.03 | 438.13 | 511.03 | 511.03 | 576.07 |
| Case 8 | 382.84 | 525.75 | 613.24 | 613.24 | 691.28 |
| Case 9 | 255.23 | 350.50 | 408.82 | 408.82 | 460.85 |
| Case 10 | 255.23 | 350.50 | 408.82 | 408.82 | 460.85 |
| Case 11 | 255.23 | 350.50 | 408.82 | 408.82 | 460.85 |
| Case 12 | 255.23 | 350.50 | 408.82 | 408.82 | 460.85 |
2.3. Measurement Techniques
We needed to determine the size and distribution of the droplets according to the experimental requirements. The overall morphology of atomization was first determined by using the high-speed camera and was used as the preliminary basis for judging the mode of atomization. On the one hand, there is a desire for more precise measurements of the spatial distribution of the droplet and the cone angle of atomization. On the other hand, if one wishes to conduct detailed research on the fragmentation and development of the surface of the liquid in the context of the microcharacteristics of the jet, it is necessary to obtain a sufficient number of clear photos within a relatively short exposure time. Moreover, the field of view of the photos should be large enough, which imposes more stringent technical requirements for image acquisition. A high-speed camera can clearly capture the temporal development of the external flow field to satisfy the requirements of this experiment.
The droplet size was measured by using the PDI, which directly provided the SMD of the particles of liquid spray. The SMD is the average diameter obtained by maintaining the volume and surface area of all droplets. This statistical method leads to a change in the total number of droplets after averaging them but accurately retains their relative surface area, which is crucial for analyzing evaporation and combustion. The SMD is the most commonly used indicator of particle size in propulsion and power systems and has a significant impact on the processes of evaporation and combustion after atomization.
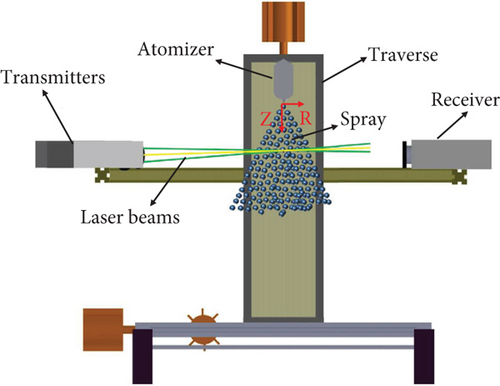
The working principle of the PDI is illustrated in Figure 7 [26]. A laser beam emitted by a laser is divided into two beams of equal intensity, which are then focused by the transmitting lens to intersect. Particles at the intersection of the beams cause them to scatter, and the scattered light is collected by the receiving lens. The receiver has a single aperture that allows only the scattered light from a small area of particle scattering at the intersection of the beams to reach the photodetector. This aperture can be adjusted by the control system, thus allowing for the automatic adjustment of the sample volume to optimize the measurement of droplet density by the instrument and reduce uncertainty in its outcomes. The fringes of the received scattered-light interference move with the droplets, and the spacing between interference fringes is inversely proportional to the droplet diameter. After processing, important data on the diameter, velocity, and number of droplets can be obtained. This is a flexible and convenient method of measurement.
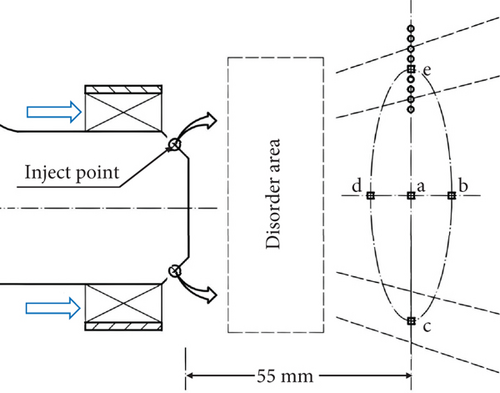
We drew lessons on the measurement of the SMD from past research in the area to inform our own work in this study. We integrated several methods for selecting the measurement points to simplify the experimental procedure. The chosen section for the measurement of the SMD was located 55 mm downstream of the outlet, where the atomization field had already become relatively uniform in the circumferential direction. This position also fell within the range of the ignition distance allowed by the headspace of the main combustion chamber. As shown in Figure 7, having determined the approximate boundaries of the atomization field, we used the five-point method to verify its uniformity. This method involves selecting five points (a, b, c, d, e) at the same distance along the forward and backward directions of the x- and y-axes, with the intersection of the axis of the nozzle and the plane of measurement as the origin. Measurements were conducted at these points. The values of the SMD obtained at the four circumferential points differed by no more than 3%, while nearly no droplets were detected at the origin. This implies that the area of atomization in this section formed a circumferentially uniform annulus, with its center on the axis of the nozzle, and no significant deviation was recorded. Once the circumferential uniformity of each nozzle had been verified, the distribution of the droplets along any radial direction could be taken to represent the entire atomization field.
Points of measurement, at equal length from one another, were densely selected along the radius of the atomization field (the circular points in Figure 8). The measured number of droplets at each point exhibited a peak. Data from five positions, each five units away from the axis of the nozzle, showed that the number of measured droplets exceeded 4000, forming a broad peak. We can conclude that the droplets were concentrated in the region within 20–35 mm from the axis of the nozzle. The SMD of the droplets in this region can accurately represent the quality of atomization of this section. We obtained the SMD for the nozzle under this operating condition through a weighted average of the SMD measured at these five points.
2.4. The Swirling Flow Field
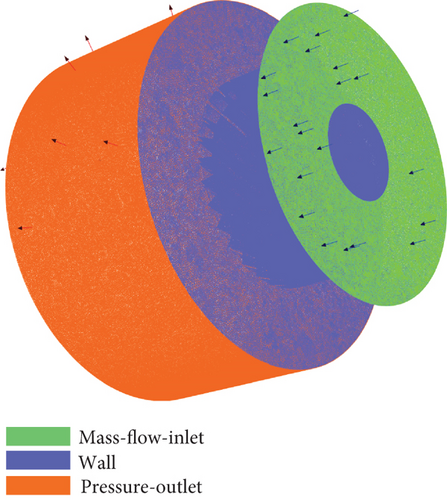
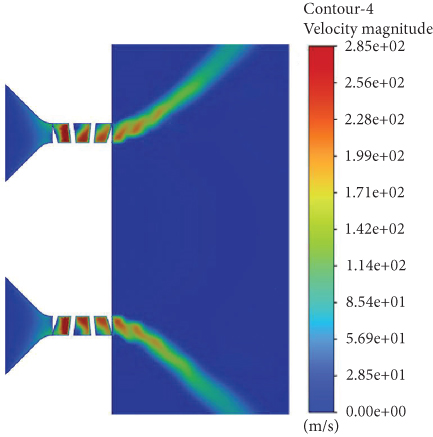
We used Fluent to simulate the flow process of the air stream for analyzing the interaction between swirling air and liquid jet. The dimensions of the computational domain are determined based on the actual size of the air swirler, and a cylindrical body with a bottom diameter of 100 mm and a height of 60 mm is added at the outlet of the air swirler. The total number of grids is approximately 14.65 million. The grid model and computational domain are illustrated in Figure 9. The inlet boundary condition is set as a mass flow rate inlet, with mass flow rates of 64, 75, 81, and 86 g/s. The wall is modeled as a no-slip wall, and the external flow field is set as a pressure outlet at 0 MPa. A pressure-based solver is utilized with the realizable k-ε turbulence model, and the SIMPLEC algorithm is employed for the calculation process.
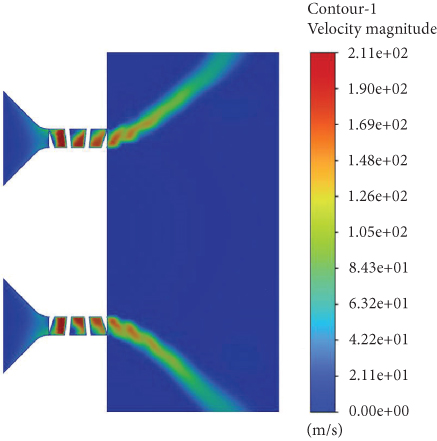
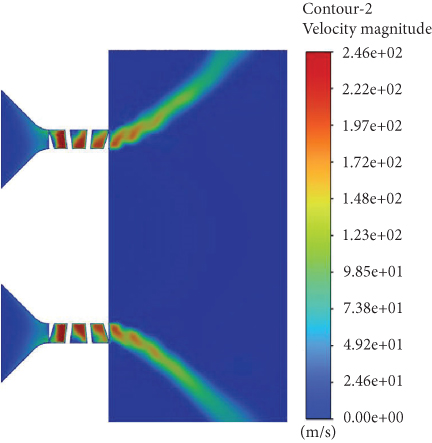
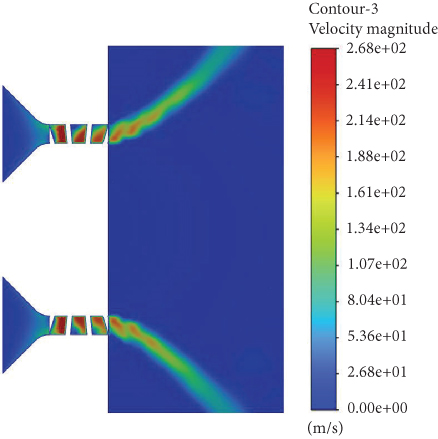
The solution results, depicted in Figure 10, show the swirling flow field at mass flow rates of 64, 75, 81, and 86 g/s. From Figure 10, it can be observed that along the outlet direction of the air swirler, as the gas flow rate increases, the speed at the outlet also increases. The maximum airflow velocity occurs inside the air swirler, and it gradually decreases as the distance from the outlet increases. The high-speed airflow, influenced by the air swirler, is expelled outward at a certain angle at the outlet, forming a trumpet-shaped expansion swirling air.
3. Discussion
3.1. Analysis of Error in the Flow Rate
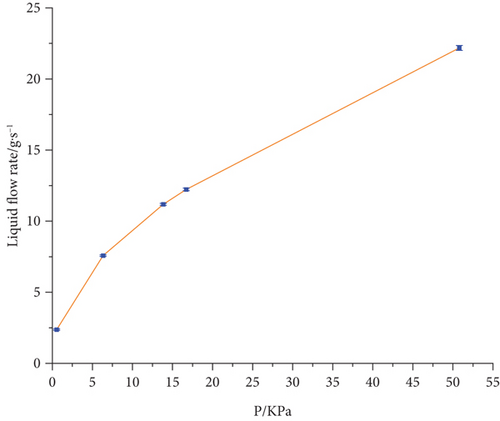
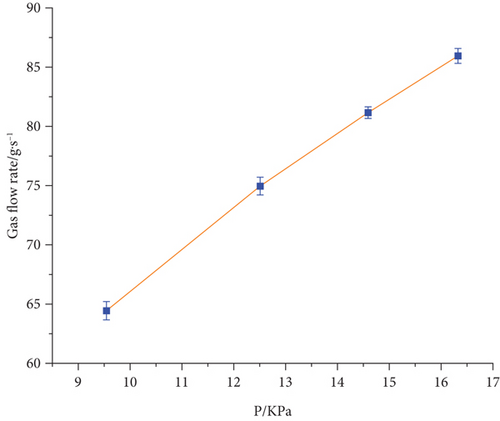
Due to the influence of the gas–liquid ratio on the characteristics of atomization [3], error in the flow rate obtained in the experiment affected the results of measurement of the SMD. We analyzed the error in the flow rate in this experiment. The main sources of error were the measurements of the mass flow rates of gas and liquid. First, instrumental errors arose from the Coriolis flowmeters. Second, fluctuations in the flow rate, attributed to dynamic measurements during the experiment, contributed to the error. We used the standard deviation to measure the magnitude of the errors. Figure 11 shows our analysis of the error in the flow rate of liquid, with a maximum standard deviation of 0.17. Figure 12 illustrates our analysis of the error in the flow rate of gas, with a maximum standard deviation of 0.77. The error bars in the graphs in these figures are relatively short and uniform, indicating the stability of the experimental data such that they had a low dispersion and high reliability.
3.2. Outline of the Atomization Field
First, we used a high-speed camera to capture the atomization field image, as shown in Figure 13(a), and then processed the image using MATLAB to obtain a more intuitive image, as shown in Figure 13(b).
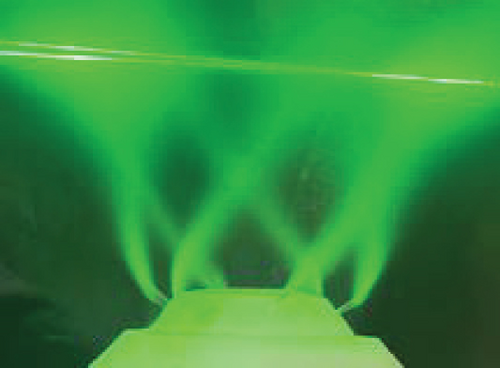
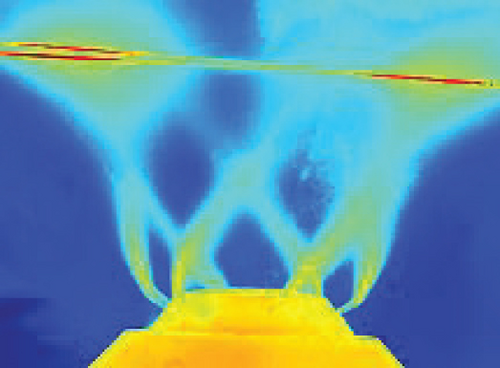
Figure 14 illustrates the different overall morphologies of the atomization in Case 1 under Conditions 1–5. It shows that under Condition 1, the sprayed liquid column was not well formed because the liquid–gas ratio had its minimum value and the flow rate of the liquid jet was low, which led to unclear formation of the liquid into a jet shape after atomization. From Conditions 2–5, as the liquid–gas ratio increases, the pneumatic breakup effect weakens while the liquid flow rate increases, making the liquid jet traces more clear, and the primary breakup distance shortens. From Figure 14, several distinct jet traces appear in a spiral shape under the influence of the swirling air. After secondary breakup, the droplets’ size gradually decreases, and the spatial distribution evolves into a uniform annular shape. With the increase in the liquid–gas ratio, the range of the atomization field also expands. After primary and secondary breakup, the cone angle of the liquid jet gradually increases and the shape of the liquid jets transitioned from cylindrical to conical. The atomization cone angle is an important parameter of the atomizer [27] that characterizes the spatial distribution of the liquid film and the droplets. It thus has a significant impact on the combustion-related performance of the engine [28].
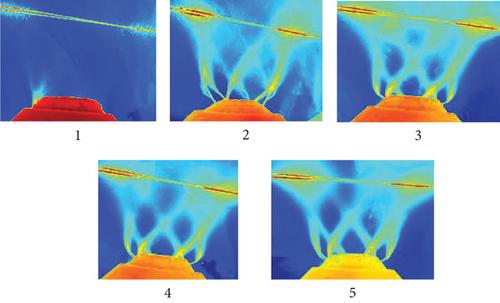
Figure 15 illustrates the different overall morphologies of the atomization in Cases 1, 4, and 5 under Condition 5. It is clear that as the nozzle distance increases, the primary breakup distance also increases, while the range of the atomization field narrows. This leads to a delayed effect of the swirling air on the liquid jets, resulting in an increased secondary breakup distance and a delayed deflection after the outlet of the jet. Consequently, the jets maintain their original spraying state for a longer time.
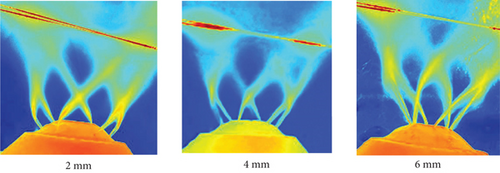
Figure 16 illustrates the different overall morphologies of atomization in Cases 1, 2, and 3 under Condition 5. It can be observed that as the axial angle of the jet increases, the primary breakup distance decreases, and the range of the atomization field expands. This causes the swirling air effect on the jet to occur earlier, leading to an earlier deflection after the jet outlet, a shorter secondary breakup distance, and a shorter time for which the jet maintains its original spraying state.
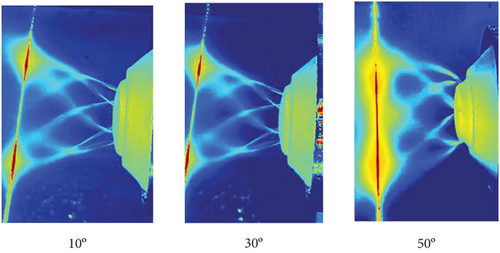
Figure 17 illustrates the different overall morphologies of atomization in Cases 1, 6, 7, and 8 under Condition 5. It is evident that with the liquid–gas ratio held constant, as the diameter of the orifice for liquid injection increases, the cone angle of several jets slightly increases after primary breakage, while the effect of the swirling air on the jet is not significant.

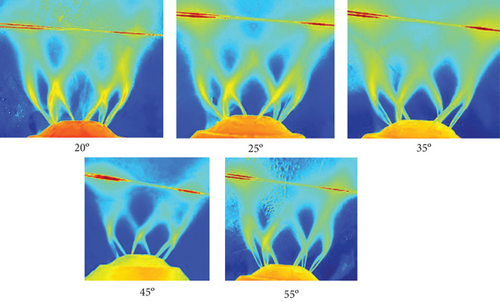
Figure 18 illustrates the different overall morphologies of atomization in Cases 1, 9, 10, 11, and 12 under Condition 5. It can be seen that changes in the injector angle do not have a significant impact on the atomization of the atomizer. The atomization fields and the liquid jet characteristics under each structure are also quite similar.
3.3. Influence of Distance (L) on SMD
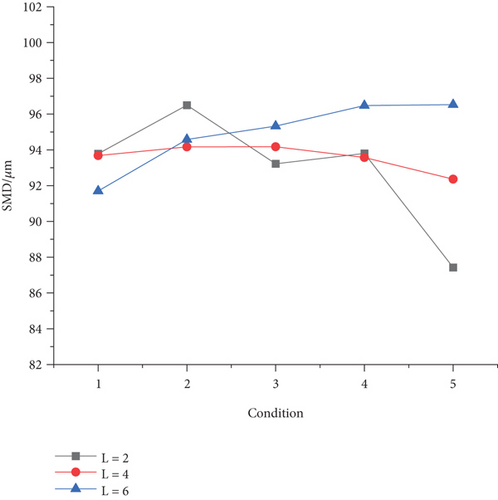
Figure 19 illustrates the results of SMD measurements in Cases 1, 4, and 5 under different operating conditions. The graph in the figure shows that because aerodynamic effects dominated the effects of atomization, the SMD measurements of the three specimens did not differ significantly under the first four operating conditions. However, in the fifth condition, the effect of the variation in distance became apparent as the distance from the nozzle increased. The downstream flow of gas of the axial swirlers lagged behind the jet, resulting in delayed turning of the latter after exiting the nozzle. Subsequent secondary fragmentation occurred under the swirling effect of the gas behind the axial swirler, leading to a gradual decrease in particle size and a transition to a more uniform ring-shaped spatial distribution. In this process, an increase in the distance delayed primary breakup and atomization, thereby affecting the measurement of the SMD and reflecting a trend of increasing SMD with the distance.
3.4. Influence of Axial Angle of Jet (α) on SMD
Figure 20 presents the SMD measurements in Cases 1, 2, and 3 under different operating conditions. The graph in the figure shows that as the axial angle of the jet increased, the downstream gas flow of the axial swirlers had a greater impact on the jet, causing it to turn earlier after exiting the nozzle. This shortened the time for which the jet maintained its original spray state. Subsequent secondary fragmentation occurred under the effect of swirling gas behind the axial swirler, leading to a gradual decrease in particle size and a transition to a more uniform ring-shaped spatial distribution. An increase in the axial angle of the jet intensified the interaction between the gas and liquid phases, causing primary breakup and atomization to occur earlier, thereby affecting the SMD measurements and reflecting a pattern of decreasing SMD increasing axial angle of the jet.

3.5. Influence of Diameter of Orifice for Liquid Injection (d) on SMD
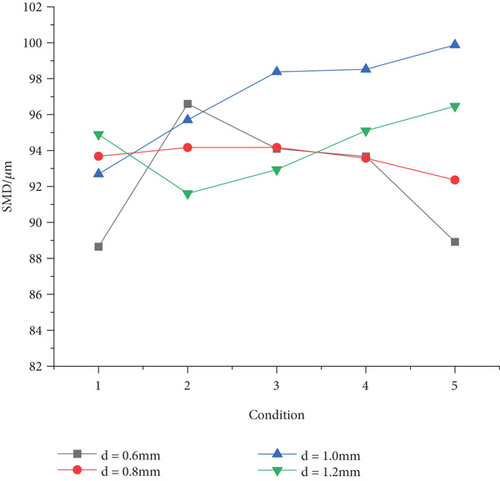
Figure 21 illustrates the SMD measurements in Cases 1, 6, 7, and 8 under different operating conditions. The graph in the figure shows that as the size of the orifice of the jet was increased while maintaining a constant flow rate of the liquid, the downstream gas flow of the axial swirlers had no significant influence on the jet. Subsequent secondary fragmentation occurred under the effect of swirling gas behind the axial swirler, resulting in a gradual decrease in particle size and a transition to a more uniform ring-shaped spatial distribution. Therefore, no significant pattern of variation was evident, and the differences in measurements of the SMD were not significant, with an overall range of 88–100 μm and a maximum difference of 12%.
3.6. Influence of Injector Angle (θ) on SMD
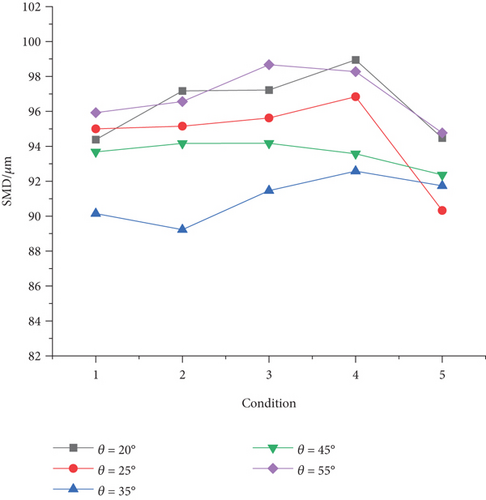
Figure 22 presents the SMD measurements in Cases 1, 9, 10, 11, and 12 under different operating conditions. It is evident from the graph in the figure that the air swirler had no significant influence on the liquid jet with increasing injector angle. Subsequent secondary fragmentation occurred under the effect of the air swirler, leading to a gradual decrease in particle size and a transition to a more uniform ring-shaped spatial distribution. The differences in the SMD measurements were not significant, with an overall range of values of 88–100 μm and a maximum difference of around 10%.
3.7. Summary of Empirical Formulae
The main influential factors in our experiments were as follows: the parameters of liquid, including the velocity of the jet (uj), density of the liquid (ρj), its surface tension (σ), and dynamic viscosity (μj); the parameters of gas, including its density (ρg), velocity (ug), and viscosity (μg); and geometric parameters. Figure 6 shows that the latter included the distance between the nozzle and the outlet of the swirler (L), the axial angle of the jet (α), the angle of the injector (θ), and the diameter of the orifice (d).
The experimental results and those predicted by the formula were compared, as shown in Figure 23. The correlation coefficient was 0.96, indicating that the empirical formulae can be used to predict the atomization SMD.

4. Conclusions
This study investigated the characteristics of atomization of the streamlined direct-injection atomizer through experiments and reported a preliminary analysis of the results.
- i.
The atomization of the streamlined direct-injection atomizer can be divided into three regions according to the outline and spatial distribution of the spray: nonuniform region, region of transition, and uniform region, arranged from upstream to downstream. The uniform region yielded good atomization and allowed for the appropriate selection of the position of ignition. The distribution of liquid droplets in the uniform region exhibited a distinct cone angle, which decreased as the ratio of liquid-to-gas mass flow increased.
- ii.
The measurements of both the morphology of the spray and the distribution of the droplet size demonstrated that the variation in the distance between the orifice of the injector and the exit of the swirl chamber and the axial angle of the jet had a significant impact on atomization performance that exhibited specific patterns of variations. The reasons for this are rooted in the influence of variations in various parameters on primary atomization, which subsequently impacted secondary breakup-induced atomization.
- iii.
Under a constant flow rate, variations in the size of the orifice of the jet and its swirl angle did not yield significant changes in measurements of the morphology of the spray and the distribution of the droplet size. The range of SMD measurements persisted within 88–100 μm, with a difference of 10%–12% between the maximum and minimum values.
- iv.
Water was used as the liquid phase instead of RP3 aviation kerosene in this experiment. Its surface tension is about three times that of aviation kerosene, and its Weber number is about one-third lower under the same flow rate. Therefore, water is more difficult to break up, and the results of SMD were relatively conservative compared with those that would have been obtained with aviation kerosene as the liquid. The SMD measured in experiments that use water is about 30% larger than that in experiments that use aviation kerosene.
Conflicts of Interest
The authors declare no conflicts of interest.
Funding
This work was supported by the 7th Young Elite Scientist Sponsorship Program (YESS), the National Natural Science Foundation of China (doi: 10.13039/501100001809) (Grant Numbers 12072303 and 51906007), and the Key Program of the National Natural Science Foundation of China (Grant Number 62433017).
Acknowledgments
This work was supported by the 7th Young Elite Scientist Sponsorship Program (YESS), the National Natural Science Foundation of China (Grant Numbers 12072303 and 51906007), and the Key Program of the National Natural Science Foundation of China (Grant Number 62433017).
Open Research
Data Availability Statement
The data that support the findings of this study are available on request from the corresponding author. The data are not publicly available due to privacy or ethical restrictions.


