Gradient-Based Optimization of Linear Elasticity Mesh Deformation Quality
Abstract
Mesh deformation based on the linear elasticity method is crucial in aerospace engineering research. However, maintaining mesh quality after significant deformations can be challenging. In this paper, the quality of mesh deformation in the linear elasticity method is improved by constructing a gradient optimization problem to solve for the optimal elastic modulus. The objective function is defined as the logarithmic sum of the quality of all mesh elements, and the gradient of the objective function is mathematically derived. Two case studies are used to analyze the influence of objective function improvement parameters and design space on the optimization results. To achieve higher efficiency in optimizing the mesh deformation quality of large-scale viscous grids, a mesh deformation quality optimization process based on elastic modulus interpolation is established. This process is tested in two case studies, confirming the feasibility of the method.
1. Introduction
The research of aerospace engineering problems based on computational fluid dynamics (CFD) often involves the motion or deformation of the aircraft surfaces, such as aerodynamic shape optimization (ASO) design, multibody system motion, aeroelasticity, and control surface motion [1–3]. Grid deformation is a prerequisite for realizing these processes and conducting analysis, and its capability directly influences the accuracy and stability of numerical simulations for specific problems [4]. For instance, in the process of ASO based on CFD, a significant decrease in mesh quality after deformation can lead to increased discretization errors, affecting the accuracy of evaluating the ASO objective function (or gradient), ultimately converging to false optima. When negative volumes occur in the mesh, the optimization process is prone to divergence.
Commonly used mesh deformation methods include algebraic method [5], spring analogy method [6], radial basis function method [7], explicit interpolation method [8], and linear elasticity method [9]. Algebraic methods are typically simple and fast, suitable for some simple geometric structures, but they are not robust enough and perform poorly for complex three-dimensional geometries, often resulting in distortion. The spring analogy method can sometimes preserve the shape of the mesh, making it relatively robust [10]. However, solving the linear equations of the spring system incurs high computational costs, especially for large-scale mesh deformations. It may not be stable enough for large displacements and deformations. The computational cost of the radial basis function method is relatively low, and it has certain advantages for nonuniform deformations in certain cases. It performs robustly in some cases, but appropriate radial basis functions and control points need to be selected during implementation. Improper selection may lead to distortion. For some complex geometric situations, a more complex distribution of control points may be required. The linear elasticity method is one of the most widely used methods currently and has relatively good robustness [11]. It is generally stable for three-dimensional mesh deformations [12]. For more complex three-dimensional geometries and large-scale mesh deformations, the linear elasticity method is often a reliable choice, although it incurs relatively high computational costs. In practical applications, trade-offs and choices may need to be made based on the nature of the specific problem and the availability of computational resources.
The linear elasticity method is based on the assumption of linear elastic behavior within small deformation ranges, adhering to linear elasticity principles [13]. In this method, the computational mesh is considered an elastic body, with mesh nodes representing material points within the elastic body. Displacements at structural boundaries are applied as deformation loads on the elastic body, where each mesh element is governed by equilibrium equations, geometric equations, and physical equations [14]. Displacement serves as the fundamental variable, and the displacement field is calculated by solving linear systems, typically involving solving large-scale linear equation systems, thereby generating a new computational mesh with unchanged node connectivity [15, 16]. The linear elasticity method is suitable for cases involving relatively small deformations and displacements. Within this range, the linear elasticity method generally exhibits high computational efficiency and numerical stability [17, 18].
Two essential parameters in the linear elasticity method are the elastic modulus and Poisson’s ratio, controlling the stiffness of elements and the compressibility of the mesh, respectively [19]. In common linear elasticity methods, Poisson’s ratio is usually given as a constant, while the elastic modulus varies within the mesh system. Typically, the elastic modulus is inversely proportional to the area (or volume) of mesh elements or the distance to the structural surface, ensuring higher stiffness for smaller scale or near-field grids and relatively lower stiffness for larger scale or far-field grids, thus maintaining the quality of mesh elements after deformation.
However, in cases of large deformations and displacements, it is common to encounter excessively large tilting rates of local mesh elements or even negative volumes, failing to meet the requirements of engineering computation [20]. Furthermore, for complex deformations of intricate geometries, when significant twisting, compression, or stretching occurs locally in the mesh deformation of complex shapes, the mesh quality may severely deteriorate if the elastic modulus is only distributed in a simple manner after deformation [21].
To address these issues, it is possible to consider improving mesh quality by adjusting the distribution of elastic modulus in regions of poor mesh quality detected during the deformation process. Specifically, for elements experiencing negative deformation during deformation (typically occurring in small-scale or near-field grids), larger values of elastic modulus are assigned. One approach is to set the elastic modulus as the reciprocal of the power of the area (or volume) of mesh elements or the distance to the surface, adjusting the power to regulate the distribution of elastic modulus throughout the entire mesh and altering the elastic modulus relationship between adjacent grids. For specific cases, the appropriate power may improve mesh quality, but different deformation problems may require different powers, which could involve some degree of randomness in selection. Another approach to adjusting elastic modulus is to consider that a specific mesh deformation case has an optimal stiffness distribution, under which the mesh quality is highest [22]. Determining the optimal stiffness distribution corresponds to an optimization problem, with design variables clearly related to mesh element stiffness. Since the number of computational grids is often large, solving this optimization problem using nongradient-based algorithms may face significant challenges, and gradient-based algorithms may be more suitable for this problem.
This paper is aimed at enhancing the quality of mesh elements after deformation based on the linear elasticity method by constructing a gradient optimization problem related to mesh element stiffness. In the first section, the objective function is defined, and the gradient of the objective function is derived. Subsequently, modifications to the objective function and the range of design space are discussed concerning the deformation of two-dimensional grids. Considering the potential computational efficiency issues caused by excessive design variables, an approach to reduce the computational burden of optimization problems is proposed and validated.
This paper addresses the improvement of mesh deformation quality based on the linear elasticity method by constructing a gradient optimization problem. In Section 2, the objective function is formulated, and its gradient is derived and validated mathematically. Subsequently, Section 3 discusses the effects of objective function parameters and design space on the optimization of deformed mesh quality through two 2D case studies. Finally, an optimization process is developed to handle relatively large-scale viscous mesh deformation problems, with its effectiveness validated through examples of airfoil rotation and wing sweep deformation.
2. Mesh Deformation Quality Optimization Problem Based on Linear Elasticity Method
2.1. Determination of Objective Function and Design Variables
The objective function for optimizing mesh deformation quality is a function of the quality of the mesh after deformation. In this paper, the quality indicator Q for 2D triangular mesh elements is defined as , where A is the vector area of the mesh element, l is the length of the mesh element, and the subscript rms represents root mean square. This indicator can reflect the directional characteristics of the mesh and is easy to calculate. For 3D tetrahedral mesh problems, a similar indicator can be chosen as , where V denotes the vector volume.
Next, we discuss the selection of design variables. Yang and Mavriplis [21] directly selected the elastic modulus of each mesh element, which is the reciprocal of the volume of the element. However, due to the generally large differences in the volumes of mesh elements, directly selecting this elastic modulus value as the initial value for optimization may lead to very large differences in design variables [23]. Additionally, defining the design space can also be challenging, which is not conducive to solving optimization problems. The calculation of the elastic modulus in this paper adopts the reciprocal of the distance from the element center to the wall surface (referring to the interior boundary of the mesh). The ratio of the elastic modulus of adjacent elements is generally between 0.5 and 2 (the mesh growth rate or decay rate should meet the calculation requirements), and there is a significant difference in the initial values of the elastic modulus of elements at different normal positions from the wall surface. To make the design variables of the optimization problem have the same proportion, the original elastic modulus of each mesh element is multiplied by a coefficient k as the elastic modulus of the spring system (i.e., kiEi). The multiplier ki serves as the design variable for the optimization problem, and the design space can be chosen within a relatively small range. This ensures that the differences in elastic modulus between adjacent elements are not too large, allowing the optimized mesh to maintain a more appropriate aspect ratio.
Additionally, it is observed that during the mesh quality optimization process, negative volume elements may appear in the deformed mesh, resulting in Q/Q0i < 0 for some mesh elements. In such cases, the objective function becomes meaningless, leading to instability and lack of robustness in the optimization process. To address this issue, the study introduces an additional parameter into the logarithmic function of the objective function, ensuring its validity. This aspect is discussed in Section 3.
2.2. Derivation of Objective Function Gradient Solution Formula
The gradient of the objective function is positively correlated with the magnitude of the elastic modulus, indicating that the design variables have a greater impact on the objective function for elements near the wall surface.
2.3. Verification of Gradient Solution Method
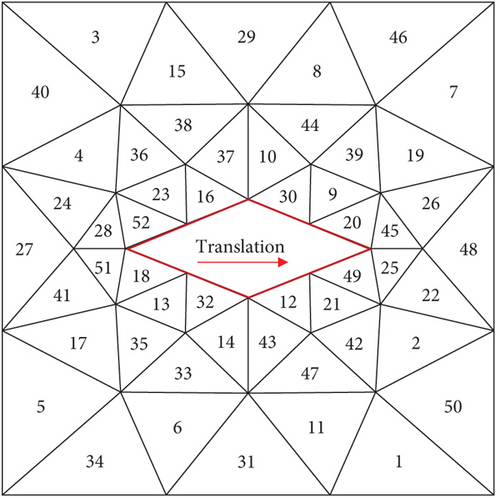
To verify the accuracy of the gradient calculation formula for the mesh quality objective function, this section conducts an investigation by comparing it with the gradient values computed using the finite difference method, based on the mesh in Figure 1. The 2D mesh consists of 36 nodes and 52 triangular elements. The mesh deformation pattern involves fixing 12 nodes on the rectangular outer boundary, while 8 nodes on the inner diamond shape move 0.5 units to the right. The positions of the other nodes after deformation are updated using the linear elasticity finite element equations. The initial elastic modulus of the mesh elements is the reciprocal of the minimum distance from the element center to the diamond boundary.
As mentioned earlier, the design variable for mesh quality optimization in this study is the multiplier (k) of the element’s elastic modulus, rather than the elastic modulus itself (E). In this section, we also compare the differences in the gradient of the objective function between these two ways of defining design variables. Figure 2 shows the gradient results of each mesh element solved using the two methods when the design variables are the elastic modulus itself and its multiplier. It can be observed that there is a good agreement between the gradient calculation using Equation (1) and the results obtained from finite difference method, indicating the accuracy of deriving the gradient of the objective function.
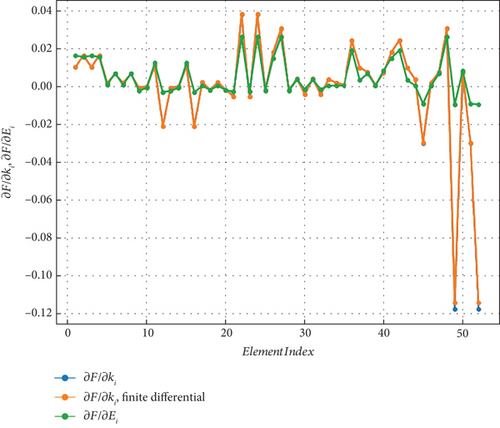
From the gradient calculation results, for the case where the elastic modulus itself is the design variable, the absolute value of the gradient of the mesh quality objective function for elements far from the diamond boundary |∂F/∂Ei| is larger, indicating that the mesh quality objective function is more sensitive to changes in the elastic modulus of these elements. Conversely, the elastic modulus of elements closest to the diamond has the smallest impact on the objective function, which contradicts intuition. However, the results for the design variable being the multiplier of the elastic modulus show some differences. Figure 2 demonstrates a reduction in sensitivity |∂F/∂ki| of the multiplier design variable for some elements far from the diamond boundary, such as Elements 1# and 3#. On the boundary of the diamond, there is a general increase in sensitivity of the design variables for elements, with the largest change observed in Elements 49# and 52#, where sensitivity increases by 550%, representing the maximum impact on the objective function among all design variables corresponding to elements.
3. Analysis of the Impact of Optimization Parameters
This section presents two cases of 2D mesh boundary rotation deformations to evaluate the performance of the proposed method and discuss the impact of specific strategies, providing a reference for other mesh deformation optimizations. The first case involves the rotational deformation of a diamond boundary, where the effect of varying design space sizes on the results is examined. The second case involves the deformation of the NACA0012 airfoil, including a discussion on how different parameters of the objective function influence the optimization results. Since the proposed optimization problem is unconstrained, the BFGS optimization algorithm is used. BFGS method is a quasi-Newton method for unconstrained optimization that updates an approximation of the Hessian matrix of the cost function, which combines the fast convergence of Newton’s method with the simplicity of gradient descent and effectively reduces computation while maintaining convergence, making it a suitable choice for solving unconstrained optimization problems.
3.1. Diamond Boundary Mesh Deformation
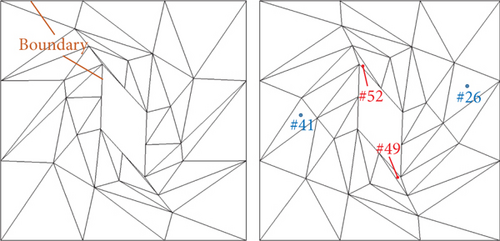
The initial mesh for this mesh deformation quality optimization test follows the mesh system from the previous section, with the same order of elements and nodes. The boundary conditions for mesh deformation are that the exterior rectangle boundary remains fixed while the internal diamond boundary rotates by 70°.The initial elastic modulus of the mesh elements is still the reciprocal of the distance from the mesh center to the diamond surface. The internal mesh point positions are updated through the stiffness equation. It is evident that after deformation, the mesh quality of Elements 49# and 52# is very poor (Q = 0.0225), followed by Elements 26# and 41# with relatively poorer quality (Q = 0.1008).
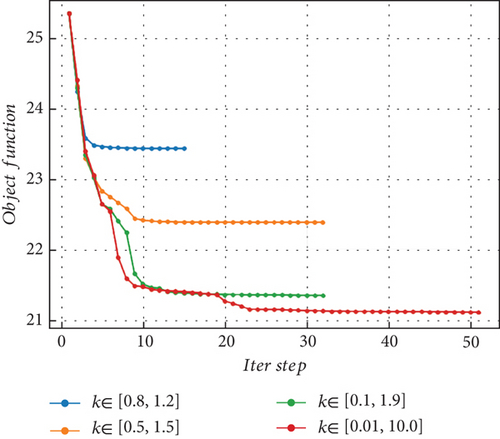
From the perspective of mesh quality optimization, the purpose of optimization is to improve the overall quality of the mesh, especially to reduce the distortion of the worst quality elements. After the mesh deformation, no negative volume elements are produced, so the objective function can use the form given by Equation (1). The range of the design variables has an important influence on the optimization results of mesh quality. Therefore, four design spaces, namely, k ∈ [0.8, 1.2], [0.5, 1.5], [0.1, 1.9], and [0.01, 10.0], are considered, and the results and efficiency of the corresponding optimization process are analyzed. Figure 3 depicts the convergence history of the objective function with different design spaces. The initial value of the objective function is 25.3. It can be observed that the larger the design space, the smaller the converged value of the objective function. Additionally, the optimal values of the objective function for the first three design spaces differ significantly. The improvement in the optimal value of [0.01, 10.0] relative to [0.1, 1.9] is relatively small. It is also noteworthy that the descent rate of the objective function in the early stages of optimization is similar for all four design spaces. However, comparing each case, at the ninth iteration step, the objective function values are 23.4, 22.4, 21.7, and 21.5 for the design spaces arranged from small to large, respectively, indicating that the case with the largest design space also maintains a consistent descent in the early iterations. The comparison of the above convergence processes means that for this deformation problem, from the perspective of optimization results or efficiency, a large design space should be chosen. Figure 4 shows the deformed mesh before and after optimization with k ∈ [0.01, 10.0]. The mesh quality of the two elements with the most severe distortion (49# and 52#) has been improved, with a resulting Q of 0.0846, while the mesh quality of Elements 26# and 41# has increased to 0.239.
3.2. NACA0012 Airfoil Mesh Deformation
Considering that in practical mesh deformation operations based on the linear elasticity method, there may be cases where individual mesh volumes become negative, this section rotates the NACA0012 airfoil mesh to generate negative volume meshes and examines the corrective ability of the mesh quality optimization algorithm for negative volume meshes.
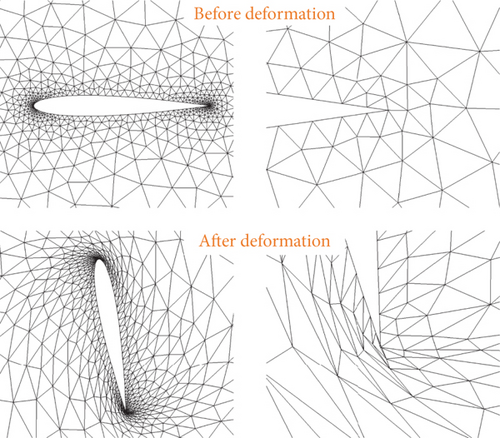
The deformation mode of the NACA0012 airfoil mesh is to rotate the airfoil clockwise around the leading edge point by 85°, as shown in Figure 5. After deformation, the overall mesh quality around the airfoil deteriorates, especially with severe tilting of the mesh elements at the leading edge of the airfoil. The mesh on the lower surface of the airfoil’s trailing edge becomes negative volume. Based on the mesh quality evaluation criteria mentioned earlier, the number of elements with mesh quality is 1, and the number of elements with 0 < Q < 0.05 is 1, indicating that the mesh quality may not meet the requirements of CFD.
The given parameter a in the objective (Equation (6)) will obviously affect the results of mesh quality optimization. Additionally, the changes in the weights of each mesh element in the objective function will also lead to differences in optimization results. Since mesh distortion mainly occurs near the airfoil, while the far-field mesh still maintains a higher mesh quality, it is natural to consider assigning larger weights to mesh elements near the airfoil and smaller weights to far-field mesh elements. The specific assignment of weights can be inversely proportional to the distance from the mesh element to the airfoil. The performance of mesh quality optimization under different weights and parameter a will be discussed next.
3.2.1. Influence of Mesh Element Weight in the Objective Function
Firstly, the parameter a is fixed to ensure that the true value of the logarithmic function for each mesh element is greater than zero, with a set to a relatively large value of 1. Several weight scenarios are considered, represented by the weights of each mesh element being , where d represents the distance from the mesh element to the airfoil, i denotes the ith mesh element, and b is the weight exponent. A larger b indicates that the near-field mesh elements have a greater weight compared to far-field elements in the objective function. The value of b ranges from 0 to 2, where b = 0 signifies equal weights for all mesh elements. The objective function for this optimization problem is , with the design space specified as k in the range of [0.1, 1.9] and the initial values of the design variables ki set to 1.
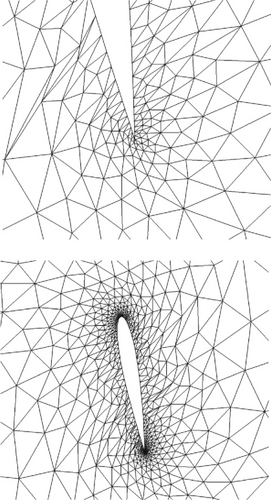
Table 1 presents the mesh quality optimization results for different values of parameter b. It can be observed that negative volume mesh elements still exist in the optimization results when b = 0 or b ≥ 1.2. Notably, even for b = 0, where all weights are equal, the optimization still fails. Figure 6 illustrates the mesh near the airfoil trailing edge and the near-field for b values of 0.2, 1.0, and 2.0. From the few mesh elements near the trailing edge, it is evident that b = 2.0 has a stronger corrective effect on negative meshes, resulting in higher mesh quality at the tip after optimization. Conversely, the mesh quality is relatively poorer for b = 2.0. However, when considering the overall mesh quality, a large number of low-quality mesh elements appear for b = 2.0, while the difference is not significant for b = 2.0 and 1.0. This indicates that assigning weights that are either too large or too small for near-field mesh elements in the objective function is not conducive to obtaining better optimization results.
| a | b | Element quantity of Q < 0 | Element quantity of 0 < Q < 0.05 |
|---|---|---|---|
| 1 | 0 | 32 | 28 |
| 0.2 | 0 | 2 | |
| 0.4 | 0 | 3 | |
| 0.6 | 0 | 3 | |
| 0.8 | 0 | 1 | |
| 1.0 | 0 | 3 | |
| 1.2 | 2 | 6 | |
| 1.4 | 1 | 5 | |
| 1.6 | 8 | 4 | |
| 1.8 | 20 | 17 | |
| 2.0 | 37 | 22 |

3.2.2. Influence of Translation Parameter in the Objective Function
The translation parameter, denoted as a in Equation (2), is a positive value that ensures the logarithmic function for each mesh element’s quality is meaningful. According to the discussion in the previous section, when the weight parameter 0 < b < 1.2, better optimization results can be achieved. To analyze the impact of a, b is arbitrarily fixed to a value of 0.4 within the above range, and the objective function for this optimization problem is . Similarly, the design space is specified as k in the range of [0.1, 1.9], and the initial values of the design variables ki are all set to 1.
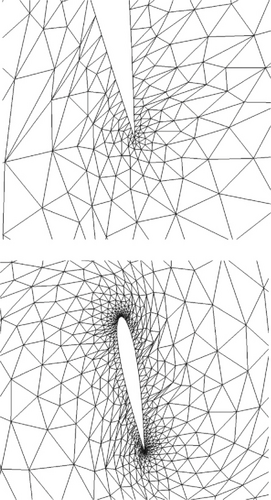
The mesh quality optimization results for different values of parameter a are presented in Table 2. A notable trend is observed: The smaller the value of a, the higher the overall quality of the mesh after optimization. When a = 1.8 and 2.0, negative volume mesh elements still exist after optimization, but their positions differ from before optimization. For instance, when a = 2.0, the negative volume mesh elements after optimization occur at the 90% chord length position, whereas the quality Q of negative volume mesh elements before optimization is now greater than zero. Figure 7 illustrates the mesh quality near the deformed airfoil for values of a ranging from 0.2 to 2.0. It can be observed that for all cases, the mesh quality near the trailing edge of the airfoil improves and negative volumes disappear. However, as a increases, the mesh quality in some areas deteriorates further, and negative volumes even appear.
| b | a | Element quantity of Q < 0 | Element quantity of 0 < Q < 0.05 |
|---|---|---|---|
| 0.4 | 0.2 | 0 | 0 |
| 0.4 | 0 | 0 | |
| 0.6 | 0 | 0 | |
| 0.8 | 0 | 1 | |
| 1.0 | 0 | 3 | |
| 1.2 | 0 | 3 | |
| 1.4 | 0 | 5 | |
| 1.6 | 0 | 4 | |
| 1.8 | 1 | 4 | |
| 2.0 | 1 | 6 |
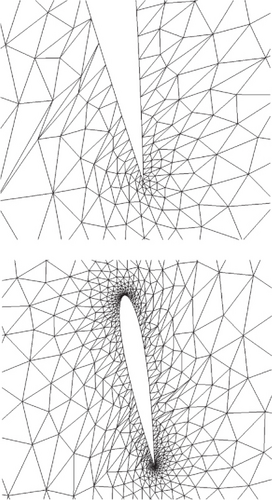
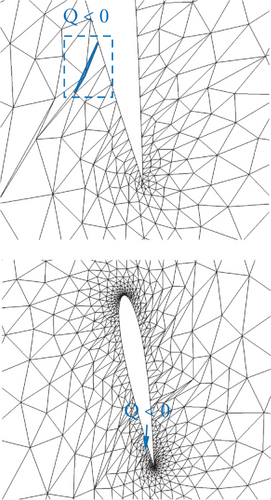
These results indicate that when selecting parameter a, under the condition of ensuring that the true value of the logarithmic function in the objective function is positive, parameter a should be as small as possible. A larger a leads to smaller differences in the values of the logarithmic function between mesh elements, making the objective function less sensitive to changes in low-quality mesh elements.
3.2.3. Influence of Design Space
Generally, in optimization design problems, a larger design space enhances the optimization algorithm’s ability to search for the optimal solution, often resulting in better optimization results. Here, we discuss whether this characteristic also applies to the deformation mesh quality optimization problem. Based on the previous analysis, a set of objective function weight parameters and translation parameters with better performance are selected: b = 0.4 and a = 0.2. Therefore, the objective function is .
The optimization results of four design spaces were compared, namely, [0.8, 1.2], [0.5, 1.5], [0.1, 1.9], and [0.08, 1.9]. The upper and lower limits of the first three design spaces mean that the design variables are allowed to be scaled by 20%, 50%, and 90%, respectively. The last design space has a smaller lower limit compared to the third one, and the boundary of the design space limits the scaling ratio of all mesh stiffness.
Table 3 presents the optimization results for the four design spaces. From the convergence of the optimization algorithm, it is observed that the number of convergence steps follows a general rule: The larger the design space, the more steps are required for convergence. When the design space is [0.08, 1.9], the true values of the logarithmic function for individual mesh elements are less than zero, causing the objective function to fail and the optimization to fail. This is because for a = 0.2, this design space is too large, and during line search, it cannot guarantee that the true values of the logarithmic function are always greater than zero.
| b | a | Design space | Convergence step | Element quantity of 0 < Q < 0.2 |
|---|---|---|---|---|
| Before opt. | 45 | |||
| 0.4 | 0.2 | 0.8~1.2 | 9 | 28 |
| 0.5~1.5 | 19 | 19 | ||
| 0.1~1.9 | 27 | 63 | ||
| 0.08~1.9 | Fail | — | ||
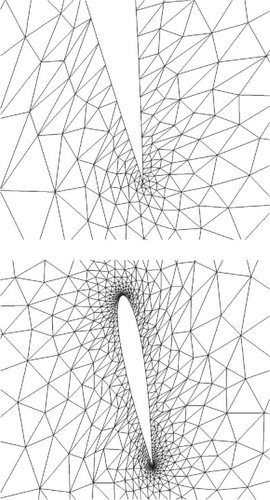
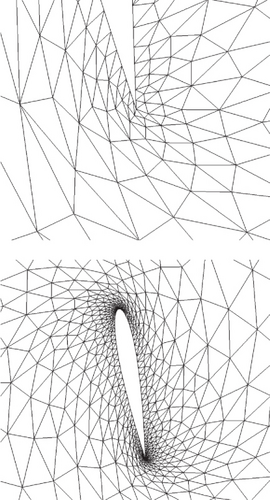
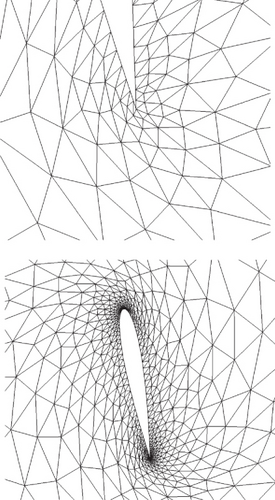
From the number of elements with mesh quality 0 < Q < 0.2 in Table 3, it can be seen that the optimization effect is not positively correlated with the size of the design space. Comparatively, the quantity of low-quality mesh elements for the design space [0.5, 1.5] is smaller than the other design spaces. One possible reason is that [0.8, 1.2] is too small, restricting the optimization algorithm’s search for the optimal solution, while [0.1, 1.9] is too large, leading to a significant discontinuity in stiffness between some mesh elements and their adjacent elements. As a result, the mesh distortion increases relatively after the spring system is balanced, as shown in Figure 8. However, when observing locally near the trailing edge, the mesh quality for the design space [0.1, 1.9] is relatively higher.

4. Optimization of Viscous Mesh Deformation Quality
For specific engineering problems, such as those in aerodynamics, accurate numerical simulations typically require viscous grids, which emphasize mesh quality. Viscous grids have a larger number of elements, making it impractical to apply mesh quality optimization algorithms directly due to the excessive number of design variables and reduced optimization efficiency. To facilitate mesh optimization, this study employs the following strategy: First, optimization is performed on a coarse, nonviscous mesh with fewer elements to determine the optimal stiffness. This stiffness value is then interpolated onto a finer, viscous mesh to enhance the quality of the viscous mesh deformation. The specific methodology is outlined below, and the performance of the approach is validated through two case studies: airfoil rotation deformation and wing sweep deformation.
4.1. Viscous Mesh Stiffness Interpolation
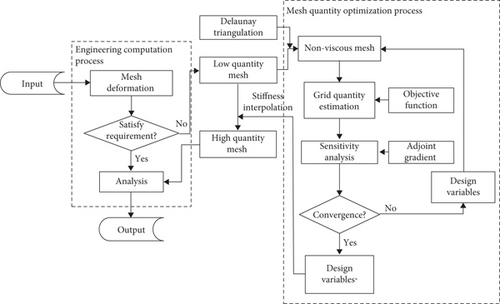
The overall implementation strategy of mesh quality optimization is illustrated in Figure 9. Assuming a mesh with low quality is generated in an aerodynamic optimization design or other analysis processes (assuming the mesh has a viscous boundary layer), quality optimization is performed on this mesh. First, the spatial mesh nodes of the original viscous mesh are discarded, retaining only the mesh nodes on the boundaries (such as surfaces and far fields) [24, 25]. A relatively sparse nonviscous spatial mesh is generated based on the Delaunay method [26], resulting in fewer elements compared to the original viscous mesh, thus improving the efficiency of the optimization algorithm. Next, mesh quality optimization is performed on the nonviscous mesh. When the optimization process converges or meets the mesh quality requirements (in practice, it is generally not necessary to converge to the optimal point; significant improvements in mesh quality are usually observed in the first few optimization iterations), the optimized stiffness of the mesh elements is obtained. Finally, the optimized stiffness is interpolated to the viscous mesh elements. Subsequently, the stiffness equations of the viscous mesh are resolved under the new element stiffness distribution to achieve an improvement in the quality of the computational mesh.
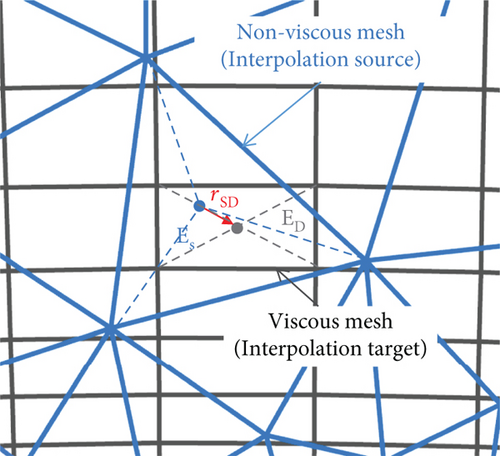
On the interpolated data of the two sets of grids, it is assumed that the stiffness values are at the centroids of the mesh elements, meaning that the interpolation is performed based on the centroids. This interpolation process is similar to data exchange in overset mesh cases, and therefore, a similar interpolation method can be adopted. This study employs centroid-based gradient interpolation [27], where ED = ES + ∇ESrSD, where E represents the stiffness corresponding to the centroid, subscript D indicates the target mesh for interpolation (i.e., the viscous mesh), subscript S denotes the source mesh for interpolation (i.e., the optimized coarser mesh), and r is the vector between the centroids of the two grids. The gradient ∇ES is calculated using the Green-Gauss method, that is, , where . Figure 10 shows a schematic diagram of stiffness interpolation between the interpolation source mesh and the target grid. Since the gradient calculation involves neighboring mesh elements, this interpolation process is a linear interpolation.
4.2. Optimization of Mesh Deformation Quality for NACA0012 Viscous Mesh
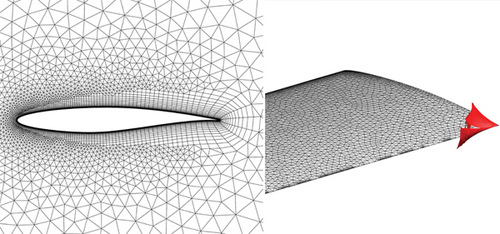
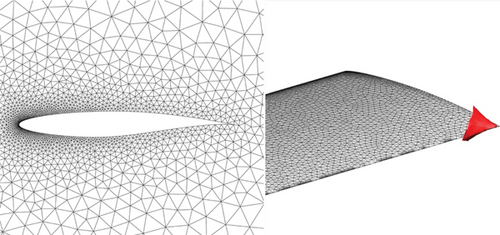
This section presents a quality optimization case for the rotational deformation of a viscous NACA001 mesh, where the deformation involves rotating the airfoil 80° around the leading edge. Figure 11 shows the deformation results with the original stiffness (where the elastic modulus is the reciprocal of the distance from the mesh element centroid to the airfoil).
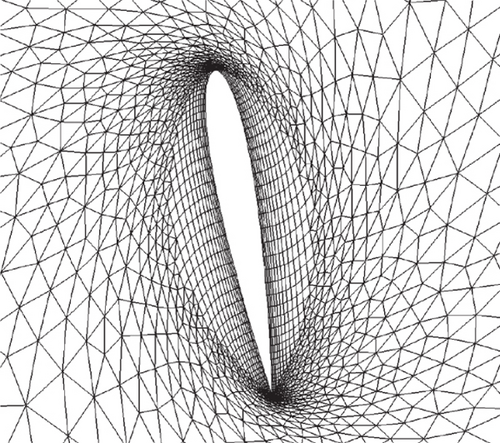
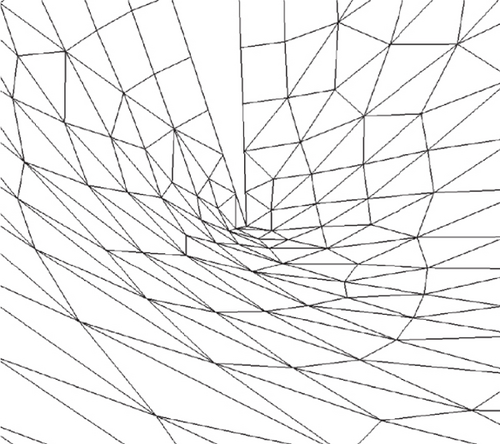
It can be observed that the mesh quality at the leading and trailing edges of the deformed airfoil is obviously reduced, consistent with the results of the nonviscous coarse mesh. However, unlike the latter, there are no negative volumes at the trailing edge point. This is because the viscous mesh elements on the upper and lower surfaces are closer to the surface, have larger stiffness, and can better resist the stretching effect of mesh nodes, thereby maintaining shape more effectively, resulting in higher mesh quality at the leading and trailing edges compared to the nonviscous coarse mesh.
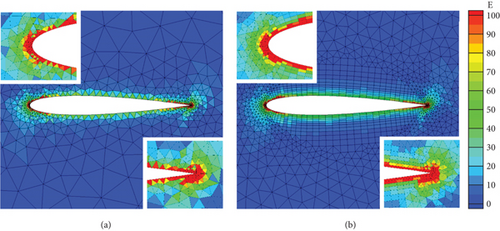
Next, following the optimization process from the previous section, the viscous mesh is retriangulated to obtain a nonviscous mesh, which is then optimized. The optimal stiffness values are interpolated onto the viscous mesh. Figure 12 illustrates the optimal stiffness distribution for the NACA0012 nonviscous mesh and the interpolation results on the viscous mesh. It is necessary to explain that the optimal stiffness of the source mesh elements for interpolation is derived from the optimization problem solution, which defines the objective function with mesh element weights of 0.4 and a translation parameter of 0.2 and sets the design space of [0.5, 1.5] mentioned in Section 3.2. The interpolation process is based on the mesh before deformation, considering that the target mesh before deformation has better quality, with no excessive skewness or negative volumes, resulting in better interpolation effects. It can be observed that the stiffness of the mesh elements at various positions in the two sets of grids basically coincides. Elements with relatively large stiffness are mainly concentrated at the leading and trailing edges, which, as we know from previous analysis, are the positions where mesh quality deteriorates most severely under rotation deformation.
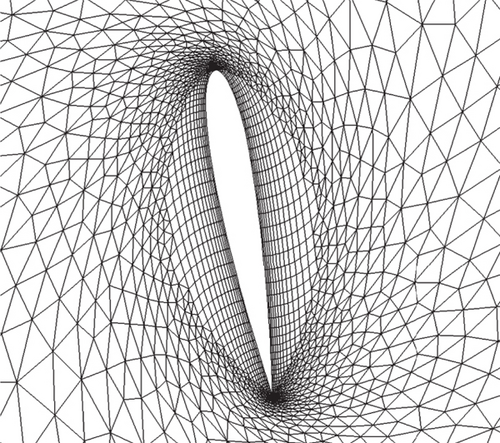
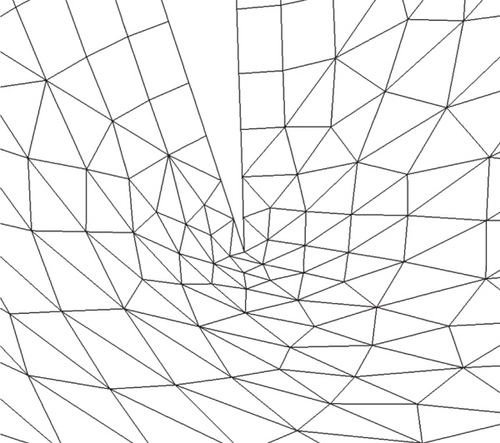
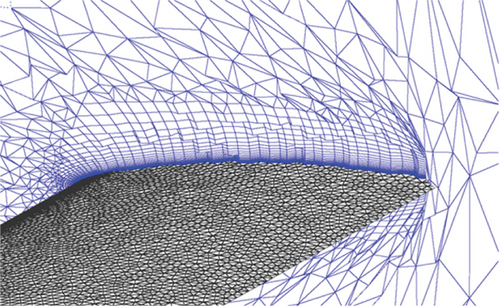
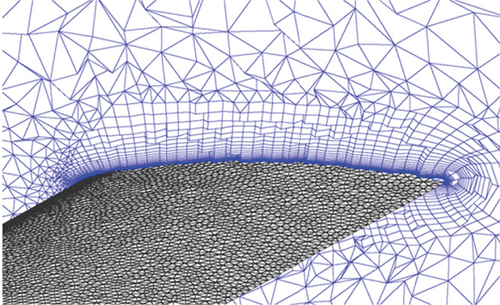
The deformation results of the viscous mesh based on the interpolated stiffness are shown in Figure 13. It can be seen that the tilt of tetrahedral elements on the upper and lower surfaces of the airfoil and adjacent triangular mesh elements has decreased. The mesh quality near the trailing edge point has also improved, and the tilt of the triangular mesh elements in the lower left corner of Figure 13 has significantly decreased. These results indicate that under the mesh element stiffness based on this interpolation strategy, the low-quality elements of the viscous mesh after deformation have been optimized, and the overall mesh quality has significantly improved compared to deformation under original stiffness.
4.3. Optimization of Mesh Deformation Quality for Wing Sweep
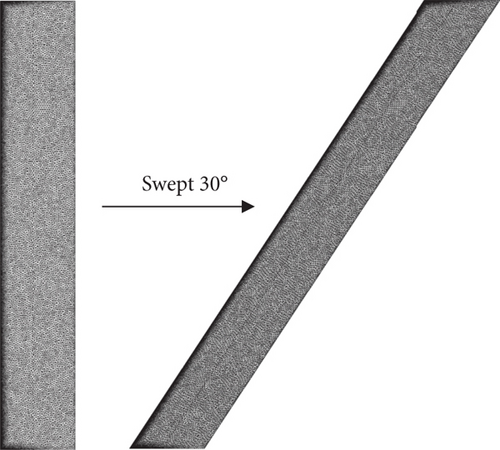
The test case involves wing sweep deformation, a common type of deformation in aerodynamic layout optimization for aircraft. When significant sweep deformation occurs, the displacement at the wingtip is maximal. For a linear elasticity method with a generally defined elastic modulus, the mesh quality near the wingtip may degrade significantly, leading to mesh deformation failure. This section presents a mesh optimization example for a NACA0012 airfoil with a span-to-chord ratio of 6 and a 30° sweep angle. The mesh consists of 2.4 million elements. Figure 14 illustrates the deformation process of the surface mesh, while Figure 15 shows the negative volume meshes generated at the trailing edge of the wingtip after deformation.
Due to the large number of mesh elements, performing gradient-based mesh quality optimization directly is inefficient. Therefore, we use the method from the previous section, where the viscous mesh is regenerated as a nonviscous mesh while maintaining the surface mesh topology. A pure tetrahedral volume mesh is generated using the Delaunay method, resulting in a mesh with 0.62 million elements. The mesh distribution at the wing root section is shown in Figure 16. The negative volume meshes after applying the same deformation strategy are illustrated, showing that their range and location are consistent with those observed in the viscous mesh deformation. This indicates that the linear spring method with the same parameters yields similar results for both types of mesh deformation.
The optimization results are presented below. It is worth noting that after six iterations with the LBFGS algorithm, although the optimization problem has not yet met the convergence condition, the distribution of elastic moduli for the mesh elements achieved allows for the complete elimination of negative volume elements in the deformed mesh. Figure 17 shows the distribution of spatial mesh nodes at the 98% spanwise position section before and after optimization. The mesh quality near the wing’s trailing edge has improved after deformation, resulting in an overall higher quality mesh.
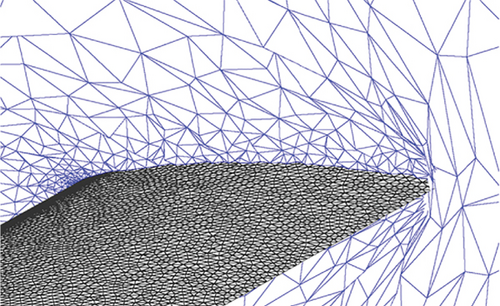
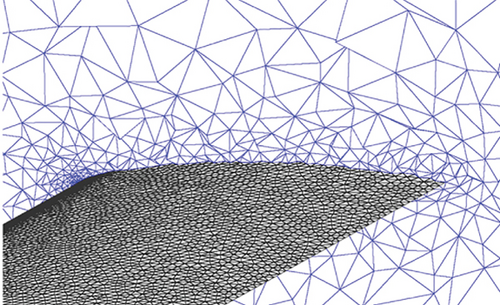
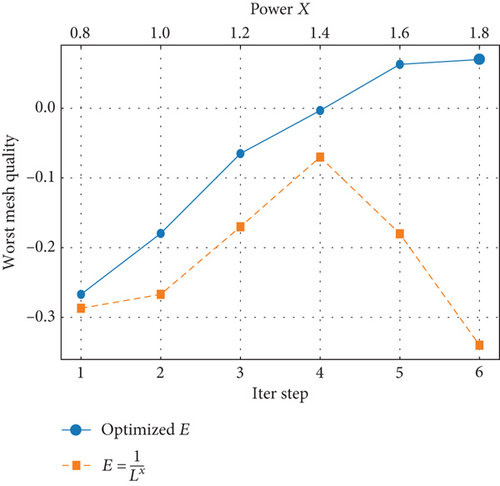
The deformation mesh before optimization in the left figure of Figure 17 is obtained based on the elastic modulus , where L is the wall distance of the grid element and the power x = 1. When the quality of the deformed mesh is low, it is generally possible to improve the mesh quality by adjusting the power, but this does not work for the problem in this section. Figure 18 compares the worst mesh quality of the deformed mesh based on different powers and the method proposed in this paper. As shown in the figure, changing the power cannot eliminate negative volume, while the method proposed in this paper can effectively handle such problems, demonstrating the effectiveness of the method.
For the predeformation mesh system, the optimized elastic moduli of the nonviscous mesh are interpolated onto the viscous mesh to implement a 30° sweep deformation of the viscous wing mesh. As observed, similar to the nonviscous mesh results, the mesh quality near the wing’s trailing edge is effectively improved, as shown in Figure 19. This further demonstrates that the loss of interpolation accuracy due to mesh scale differences near the wing does not affect the quality improvement of the viscous mesh. It also confirms the effectiveness of the proposed method for optimizing the quality of three-dimensional deformed meshes.
5. Conclusion
This paper proposes a mesh deformation quality optimization strategy based on the linear elasticity mesh deformation method. By optimizing the distribution of elastic moduli, this strategy aims to eliminate negative volumes in deformed meshes and improve mesh quality, thereby enhancing the performance of the linear spring method. This goal is achieved by solving a gradient-based optimization problem. For the construction of the optimization problem, this study defines the objective function as the sum of the logarithms of mesh element qualities and uses the product factor of elastic moduli as the design variable. The gradient of this objective function form is derived rigorously.
To address the negative volume issue and further improve the optimization results for mesh quality, two additional parameters are introduced to handle negative volumes and adjust the weighting of mesh elements at different locations within the objective function. These parameters are crucial for achieving optimal results. Recommendations for parameter selection are provided, which can offer better guidance for defining optimization problems for other deformation methods. To apply the method to more realistic and larger-scale mesh deformation scenarios, this study uses an interpolation strategy. Applying the optimization results from nonviscous grids to viscous grids is an effective approach that significantly enhances the quality and accuracy of viscous grids.
The gradient-based mesh quality optimization process requires multiple rounds of mesh deformation but does not necessarily need to determine the optimal elastic moduli for the mesh system. For the cases studied in this paper, noticeable improvements in mesh quality are achieved after only a few iterations of the optimization process.
The proposed gradient-based optimization method for linear elasticity mesh deformation demonstrates superior computational efficiency and robustness compared to existing methods. The spring analogy method solves large linear systems iteratively, incurring high computational costs for large meshes. The algebraic methods are fast but lack robustness for large deformations. The RBF method is low-cost and performs well on small-to-medium meshes but struggles with complex geometries and depends on precise control point selection, reducing efficiency. In contrast, the proposed method dynamically adapts stiffness parameters to eliminate negative volumes and preserve mesh quality under extreme deformations, addressing key limitations of existing methods and the framework balances speed, accuracy, and robustness. It is particularly suited for gradient-based ASO requiring fixed grid topology and can enable adaptive grid refinement indicated by field data information.
Conflicts of Interest
The authors declare no conflicts of interest.
Funding
No funds were received.
Open Research
Data Availability Statement
Data sets generated during the current study are available from the corresponding author upon reasonable request.


