Z-Score-Based Improved TOPSIS Method and Its Implementation for Elderly People Health Examination Results Evaluation: A Statistic Case Study in Harbin, China
Abstract
Considering the remarkable population aging in China, more researchers pay attention to the health condition of elderly people. However, limited to the large amount of miscellaneous health examination data, a systematic method to quantify and evaluate the health condition of elderly people is still lacking. In this study, a Z-score-based improved Technique for Order Preference by Similarity to an Ideal Solution (TOPSIS) method was introduced by considering the omission of the positive or negative ideal solution of the original data. Then, the health conditions of elderly people were quantified and evaluated according to 1672 elderly health examination reports. Meanwhile, the influence factors that impact elderly people’s health conditions were also discussed. The analysis results demonstrated a positive impact of social development on elderly people’s health conditions. Oppositely, the influence of age and sex might be slight. This study could contribute to the characterization of the health condition of elderly people residing in Harbin, as well as its influence factors.
1. Introduction
The individuals with the most severe symptoms and the highest risk of death are the elderly and those with chronic illness. Considering the remarkable population aging in China, more and more attention is drawn to the health condition of elderly people, since the health examination data could indicate the chronic conditions.
The role of the assessment, evaluation, and examination of health conditions is very important, yet it is often an overlooked and undervalued component of geriatric health care [1]. To evaluate the health condition, several attempts have been introduced. In one class, the elderly people’s daily behaviors have been directly monitored, digitized, and analyzed. Several researchers try to obtain older people’s behavior, physical activities, and heart rates with wearable sensors. Then, their health conditions have been examined [2]. The older’s diet, sleep, and other living habits have been also analyzed [3, 4]. In other classes, researchers attempted to quantify the older peoples’ health condition further [5]. For instance, the interviews with experts and questionnaire surveys have been assessed and analyzed [6, 7]. Several researchers also consider the influence of the data’s randomness [8–10]. Machine learning and other assessment tools provide several new types of health evaluation methods [11–13].
However, limited to the large amount of miscellaneous health examination data, a systematic method to evaluate the health condition of elderly people is still lacking. It should be noted that most methods mentioned above would take considerable time. Several types of research would be limited by the sample size. That is to say, in the case that the original data could not be obtained from the community residents, it would be difficult to complete the evaluation analysis. Besides, the influence factors that impact elderly people’s health conditions have remained unclear [14]. Therefore, if we could apply statistical methods to analyze the periodic or nonperiodic health examination reports, the huge amounts of data noted on the reports would provide much more information about elderly people’s health conditions. Also, the health examination reports would improve the evaluation and analysis efficiency considerably. Tzeng et al. originally proposed Technique for Order Preference by Similarity to an Ideal Solution (TOPSIS) to help select the best alternative with a finite number of criteria [15–18]. TOPSIS method provides a means of evaluating the conditions of plural samples by considering their statistical characteristics although the original TOPSIS method is particularly useful for the evaluation analysis of the data with a positive or negative ideal solution.
This study addressed the above problem that the original TOPSIS might not meet the demand for evaluation analysis of the elderly’s health examination report to provide a systematic method to evaluate their health condition. We attempted to improve the original TOPSIS method by considering the omission of the positive or negative ideal solution of original data by applying the Z-score-based manner. Then, the health conditions of elderly people based on their health examination reports were evaluated. By implementing the Z-score-based improved TOPSIS method for evaluation analysis, the influence factors that impact elderly people’s health conditions would be discussed according to 1672 elderly health examination cases. This study could provide a powerful tool that will help to evaluate the health condition concerning a positive or negative ideal solution.
2. Z-Score-Based Improved TOPSIS Method
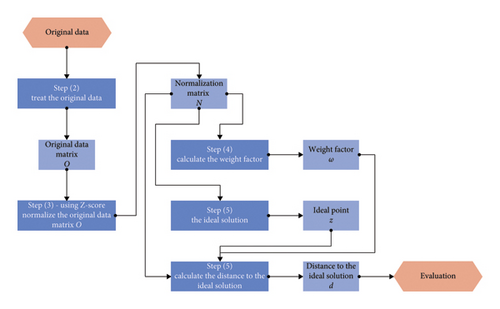
In this study, an improved TOPSIS method would be proposed, which could treat the original data without a positive or negative ideal solution based on the Z-score manner. The main steps were illustrated in Figure 1.
- 1.
As reported in Appendix A (Table A1 and A2), the health examination including blood tests, urine analysis, etc., was selected from the medical examination report database. Then, the indicator mean values of each sample would be applied for the following analysis, which was reported in Appendix A.
- 2.
Generate the original data matrix O by using these mean values. The element Oij in the original data matrix O indicates the ith sample’s mean test value of the jth examination indicator.
- 3.
Normalize the original data matrix O by using the Z-score method [19, 20]. Each element of the normalization matrix N would be obtained by the following equation:
()where Nij indicates the element of matrix N; and indicate the mean value and the standard deviation of all the elements in the jth column in matrix N, respectively. - 4.
Calculate the weight factor of the jth indicator based on its coefficient of variation COVj. After obtained the jth indicator’s coefficient of variation by equation (2), the weight factor of each indicator ωj could be calculated by the following equation:
()where and indicate the mean value and the standard deviation of all the elements in the jth column in matrix N, respectively.() - 5.
Calculate the distance to the ideal solution of each sample. According to the TOPSIS method, the ideal point of each indicator, zj, should be set before the distance calculation. As all health examination results values of a healthy person should keep in a proper range, neither too high nor too low. That is to say, the value of zj of each indicator should be the mean value for the original data matrix O, which would equal zero for the normalization matrix N. The distance to the ideal point, d, could then be obtained based on the Euclidean distance equation considering the weight factor of each indicator, which was represented as the following equation:
() - 6.
Analyze the evaluation results based on the value d obtained. As introduced in [16], a further distance to the ideal solution basically demonstrates this sample has a poor evaluation. In another word, a larger value of d indicates the sample would have a worse health situation.
The pseudocode was shown as Algorithm 1.
-
Algorithm 1: Pseudocode of Z-score-based improved TOPSIS method.
- 1.
Input n examination indicators
- 2.
Input m samples
- 3.
forj = 1, …, ndo
- 4.
fori = 1, …, mdo
- 5.
- 6.
end for
- 7.
- 8.
- 9.
- 10.
end for
- 11.
returnd value
3. Case Study on Elderly People
To identify cases, 1672 elderly cases were included in an outpatient setting (hospital outpatient departments) in Harbin, China. To evaluate the influential factor and discuss the effect, these cases were classified by sex (male and female), age range (55–59 and 60–64), and the periods of examination (2015 and 2021).
In this study, eight basic groups of samples were classified. The sample was named by examination year, patient age range, and sex. For example, the sample named “2015-55–59-male” meant this sample covered all the males with ages of 55 and 59 years who had been examined in 2015. Then, the quantitative index was extracted from the original data of the health examination reports, including of the physical examination, liver function, rental function, blood lipids, etc. The detailed data were represented in Appendix A. These parameters were selected because these are the most common indications for health examination in China [21, 22]. By implementing the analysis method based on the programme language python introduced in Section 2, theses quantitative index would be evaluated. Finally, by appraising the d value obtained, the health situation would be given. Furthermore, the countermeasure to the situation would be discussed.
4. Results and Discussions
4.1. Number of Health Examination
The number of samples and their distribution are illustrated in Figure 2.
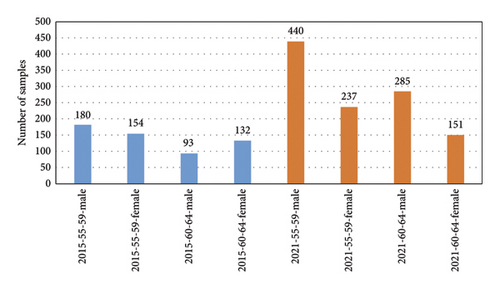
As shown in Figure 2, the number of samples in 2021 was much more than that in 2015. 1113 people took the health examination in common in 2021. Oppositely, there were only 559 health examination reports recorded in 2015, which appeared about half the amount of the amount in 2021. This obvious increasing number of health examination demonstrated that this community’s individual health care has grown remarkably.
Figure 2 also represented a significant influence of the sex on the sample distribution. In 2015, the amounts of male and female elderly cases were 273 and 286, respectively. The male-to-female ratio was 0.95. After 6 years, this ratio rose rapidly, which became 1.86 in 2021. Meanwhile, the rates of male and female elderly cases amount increased were 1.66 and 0.36, respectively. This considerable change denoted that much more male elderly preferred to come for health examination than female elderly. This interesting difference has also been found in a Korean case study [23]. The research reported in Reference [23] indicates that the performances were different in some health behaviors between male and female elderly people. Male elderly showed better performances in a balanced diet, regular exercise, and more than 30 min of exercise, while female elderly showed better performances in restriction of fat and cholesterol, restriction on alcohol, and smoking. Similar research results that female elderly avowed lower life satisfaction has also been reported in Taiwan [24]. This sociological issue might be a general phenomenon in Asia. However, this sociological issue could not be exhausted in this study. Its mechanism should be discussed deeply in future works.
4.2. Effect of Age on Elderly People Health
To discuss the effect of age on elderly people’s health, the analysis results obtained based on the method introduced in Section 2 are represented in Figure 3.
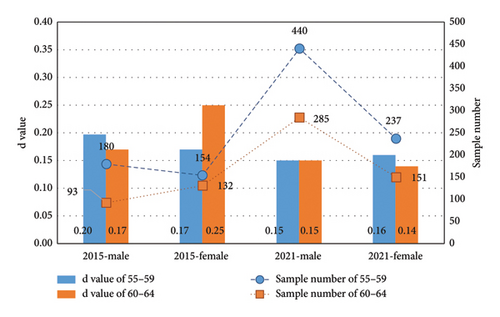
The results illustrated in Figure 3 showed a small difference between 55–59-aged and 60–64-aged elderly people in 2021. This slight difference indicated that all the elderly people who took the health examination this year might be in a good health condition.
On the other hand, a remarkable difference between 55–59-aged and 60–64-aged elderly people could be observed in 2015. The male elderly people in 55–59 ages had better health conditions than those elderly people in 60–64 ages, and this situation was obviously reversed in female samples. Considering the slight difference in health condition evaluations between 55–59-aged and 60–64-aged elderly people in 2021, this irregular fluctuation might demonstrate a slight effect of age on the elderly people’s health.
4.3. Effect of Sex on Elderly People Health
To discuss the effect of sex on elderly people’s health, the evaluation analysis results obtained are represented in Figure 4 by comparing the males and females.
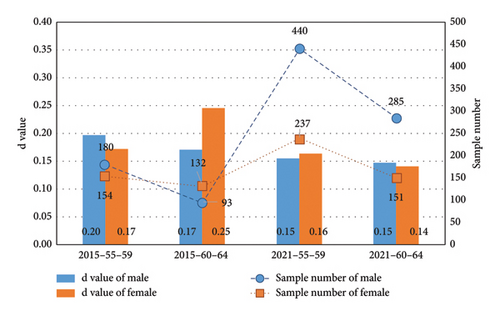
The results illustrated in Figure 4 showed a small difference between 55–59-aged male and female elderly people in 2021. This slight difference indicated that both male and female elderly people of this age might be in a good health condition. Besides, the female elderly people in 60–64 ages had the smallest distance to the ideal solution, which indicated that they might be the most healthy group. Comparing with the discussion about the sample amount distribution reported in Subsection 4.1, a confusing phenomenon could be found: the most healthy group did not prefer to come for a health examination. We still do not fully understand why this phenomenon appeared.
On the other hand, a remarkable difference between male and female elderly people could be observed in 2015. The female elderly people in 55–59 ages had a better health conditions than those male elderly people, and this situation was obviously reversed in 60–64-aged samples. As mentioned in Subsection 4.2, this irregular fluctuation might demonstrate a slight effect of sex on the elderly people’s health.
Besides, it should be noticed that the 60–64-aged females had the worst health condition, which stood in sharp contrast to the most healthy condition of the 60–64-aged female group. This might be caused by the social development, which would be detailed in Subsection 4.4.
4.4. Effect of Social Development on Elderly People Health
The evaluation results were arranged in order of evaluation results and then illustrated in Figure 5.
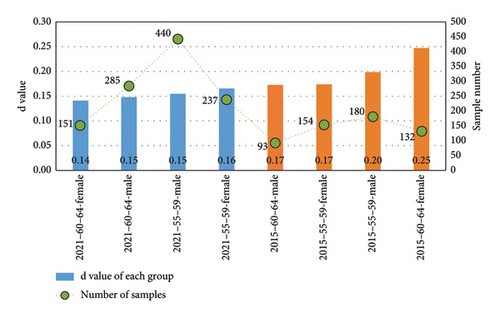
As mentioned in Section 2, a larger value of d indicates that the sample would have a worse health situation, and the following discussions could be listed. All the sample groups in 2021 basically represented a better condition than those in 2015. Therefore, we could speculate that social development might influence elderly people’s health conditions.
To prove this speculation, two special sample groups were compared, that is, the 55–59-aged who took the health examination in 2015 and the 60–64-aged who took the health examination in 2021. The comparison result is shown in Figure 6.
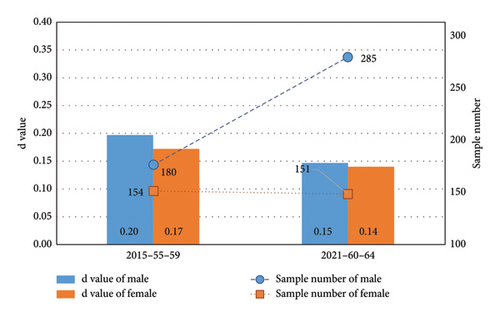
These two sample groups would not be exactly the same although these two groups could be considered the same type of outpatient cases who lived near the hospital. By discussing the difference between these two sample groups, the influence of social development on the residents’ health conditions could be clarified. Obviously, the sample group of 2015 had a further distance to the ideal solution, which indicated that they might have a worse health condition. A positive impact of social development could be observed on elderly people’s health conditions.
Besides, the deep learning methods which have ballooned in recent years are indeed a powerful evaluation tool [11–13]. However, these methods mentioned above need a large number of sample data and a remarkable computation resource. Besides, these methods would be more suitable for dealing with real-time data. Oppositely, in this study, we want to focus on the health reports evaluation, considering the nonignorable computation cost and real-time data applicability of deep learning methods, which might not be a proper solution. Therefore, the Z-score-based improved TOPSIS was selected in this study.
5. Conclusions
- 1.
The evaluation analysis results induced in this case study identified in northeast China demonstrated a positive impact of the social development on the elderly people’s health conditions. Oppositely, the influence of age and sex could be considered slight.
- 2.
An obvious increasing health examination number in 2021 could demonstrate that this community’s individual health care has grown remarkably. However, it should be noticed that much more male elderly preferred to come for health examinations than females in recent years.
- 3.
The Z-scored-based improved TOPSIS method proposed in this study could provide a powerful tool to evaluate the original data without a positive or negative ideal solution.
This study contributes to the characterization of the health condition of elderly people residing in Harbin, as well as its influence factor.
Also, we have noticed an interesting phenomenon: the female elderly people in 60–64 ages had the smallest distance to the ideal solution, which indicated that they might be the most healthy group. However, an obviously low willingness for the health examination was observed in such populations. We still do not fully understand why this phenomenon appeared, which would be studied in our future works.
Besides, only the health examination reports, i.e., the static data, were studied in this work. In future works, the deep learning method which is suitable to deal with real-time data, for instance, the data obtained from the sensors, might be also considered.
Conflicts of Interest
The authors declare no conflicts of interest.
Funding
This work was supported by the China Postdoctoral Science Foundation (Grant No. 2019M651292 and Grant No. 2019T120273).
Acknowledgments
This work was supported by the China Postdoctoral Science Foundation (Grant No. 2019M651292 and Grant No. 2019T120273).
Appendix A: Original Data
| Sort | Indicator | 55–59-male | 55–59-female | 60–64-male | 60–64-female |
|---|---|---|---|---|---|
| Physical examination | Systolic pressure | 124.12 | 117.71 | 125.68 | 125.68 |
| Diastolic pressure | 83.81 | 78.79 | 80.41 | 80.41 | |
| Heart rate | 71.82 | 70.60 | 67.24 | 67.24 | |
| Liver function (blood) | Alanine transaminase | 24.63 | 22.90 | 23.68 | 23.68 |
| Aspartate transaminase | 23.74 | 23.06 | 23.89 | 23.89 | |
| γ-Glutamyl transpeptidase | 56.69 | 28.61 | 29.73 | 29.73 | |
| Alkaline phosphatase | 69.37 | 71.85 | 74.38 | 74.38 | |
| Gross protein | 73.64 | 73.30 | 72.76 | 72.76 | |
| Albumin | 46.17 | 45.72 | 46.22 | 46.22 | |
| Globulin | 27.47 | 27.59 | 26.55 | 26.55 | |
| Ratio albumin to globulin | 1.71 | 1.70 | 1.77 | 1.77 | |
| Total bilirubin | 13.39 | 11.08 | 11.52 | 11.52 | |
| Direct bilirubin | 4.94 | 4.03 | 3.89 | 3.89 | |
| Indirect bilirubin | 8.45 | 7.05 | 7.63 | 7.63 | |
| Total bile acid | 4.04 | 3.00 | 2.74 | 2.74 | |
| Cholinesterase | 9198.14 | 9340.23 | 9995.00 | 9995.00 | |
| Renal function (blood) | Carbon dioxide | 26.96 | 26.42 | 25.23 | 25.23 |
| Creatinine | 85.93 | 69.23 | 71.27 | 71.27 | |
| Urea nitrogen | 5.56 | 5.07 | 5.59 | 5.59 | |
| Uric acid | 383.01 | 294.29 | 305.54 | 305.54 | |
| Blood lipids (blood) | Total cholesterol | 4.93 | 5.21 | 5.55 | 5.55 |
| Low-density lipoprotein | 3.28 | 3.55 | 3.78 | 3.78 | |
| Triacylglycerols | 2.16 | 1.46 | 1.53 | 1.53 | |
| Lipoprotein (a) | 118.61 | 196.76 | 307.69 | 307.69 | |
| High-density lipoprotein | 1.16 | 1.31 | 1.41 | 1.41 | |
| Fasting blood-glucose | 6.15 | 5.63 | 5.71 | 5.71 | |
| Clinical urine tests | PH | 5.97 | 6.10 | 6.27 | 6.27 |
| Specific gravity | 1.02 | 1.02 | 1.02 | 1.02 | |
| Complete blood count (blood) | White blood cell | 6.95 | 6.00 | 5.93 | 5.93 |
| Percentage of lymphocytes | 33.50 | 35.28 | 37.42 | 37.42 | |
| Percentage of monocyte | 5.93 | 5.27 | 5.37 | 5.37 | |
| Percentage of neutrophilic granulocyte | 57.58 | 57.13 | 54.46 | 54.46 | |
| Percentage of acidophil cell | 2.55 | 1.96 | 2.41 | 2.41 | |
| Percentage of basophil cell | 0.45 | 0.36 | 0.34 | 0.34 | |
| Absolute value of lymphocytes | 2.29 | 2.09 | 2.19 | 2.19 | |
| Absolute value of monocyte | 0.41 | 0.31 | 0.32 | 0.32 | |
| Absolute value of neutrophil | 4.05 | 3.46 | 3.26 | 3.26 | |
| Absolute value of acidophil cell | 0.17 | 0.12 | 0.15 | 0.15 | |
| Absolute value of basophil cell | 0.03 | 0.02 | 0.02 | 0.02 | |
| Red blood cell | 5.01 | 4.48 | 4.48 | 4.48 | |
| Hemoglobin | 157.19 | 136.75 | 136.86 | 136.86 | |
| Hematocrit | 48.11 | 41.91 | 42.01 | 42.01 | |
| Mean corpuscular Volume | 96.13 | 93.68 | 93.99 | 93.99 | |
| Mean corpuscular hemoglobin | 31.48 | 30.57 | 30.63 | 30.63 | |
| Mean corpuscular hemoglobin concentration | 327.46 | 326.40 | 325.95 | 325.95 | |
| Coefficient of variation of red cell distribution width | 12.37 | 12.41 | 12.33 | 12.33 | |
| Standard deviation of red cell distribution width | 49.38 | 47.18 | 46.83 | 46.83 | |
| Platelet | 222.06 | 243.14 | 234.95 | 234.95 | |
| Platelet ratio | 0.20 | 0.23 | 0.22 | 0.22 | |
| Mean platelet volume | 9.14 | 9.35 | 9.35 | 9.35 | |
| Macroplatelet ratio | 31.85 | 26.67 | 27.37 | 27.37 | |
| Platelet distribution width | 16.03 | 15.16 | 15.02 | 15.02 | |
| Sort | Indicator | 55–59-male | 55–59-female | 60–64-male | 60–64-female |
|---|---|---|---|---|---|
| Physical examination | Systolic pressure | 137.05 | 130.73 | 140.18 | 136.20 |
| Diastolic pressure | 82.03 | 74.75 | 80.40 | 74.92 | |
| Heart rate | 77.56 | 62.10 | 77.16 | 62.16 | |
| Liver function (blood) | Alanine transaminase | 22.78 | 22.89 | 23.20 | 26.77 |
| Aspartate transaminase | 20.55 | 22.24 | 21.82 | 27.71 | |
| γ-Glutamyl transpeptidase | 37.94 | 26.17 | 36.04 | 31.38 | |
| Alkaline phosphatase | 77.07 | 82.71 | 76.64 | 87.29 | |
| Gross protein | 73.32 | 73.99 | 73.62 | 74.19 | |
| Albumin | 47.05 | 46.48 | 46.51 | 46.53 | |
| Globulin | 26.29 | 27.50 | 27.10 | 27.66 | |
| Ratio albumin to globulin | 1.82 | 1.71 | 1.75 | 1.72 | |
| Total bilirubin | 14.48 | 10.42 | 14.66 | 11.85 | |
| Direct bilirubin | 5.23 | 3.94 | 5.40 | 4.36 | |
| Indirect bilirubin | 9.26 | 6.46 | 9.30 | 7.48 | |
| Total bile acid | 3.98 | 2.97 | 3.80 | 3.92 | |
| Cholinesterase | 9527.05 | 9566.99 | 9079.50 | 9510.29 | |
| Renal function (blood) | Carbon dioxide | 26.05 | 25.87 | 25.83 | 25.95 |
| Creatinine | 79.89 | 59.90 | 78.00 | 59.73 | |
| Urea nitrogen | 5.52 | 5.11 | 5.70 | 5.05 | |
| Uric acid | 376.81 | 295.71 | 368.28 | 303.86 | |
| Blood lipids (blood) | Total cholesterol | 4.89 | 5.30 | 4.73 | 5.51 |
| Low-density lipoprotein | 3.28 | 3.54 | 3.15 | 3.68 | |
| Triacylglycerols | 2.01 | 1.52 | 1.80 | 1.58 | |
| Lipoprotein (a) | 154.88 | 159.90 | 140.50 | 160.25 | |
| High-density lipoprotein | 1.22 | 1.47 | 1.22 | 1.52 | |
| Fasting blood glucose | 6.16 | 5.65 | 6.08 | 5.70 | |
| Clinical urine tests | PH | 5.71 | 5.94 | 5.75 | 5.88 |
| Specific gravity | 1.02 | 1.02 | 1.02 | 1.02 | |
| Complete blood count (blood) | White blood cell | 6.48 | 5.63 | 6.47 | 5.79 |
| Percentage of lymphocytes | 32.84 | 36.79 | 33.83 | 37.09 | |
| Percentage of monocyte | 7.42 | 6.53 | 7.32 | 6.59 | |
| Percentage of neutrophilic granulocyte | 56.27 | 53.66 | 55.52 | 53.25 | |
| Percentage of acidophil cell | 2.59 | 2.28 | 2.46 | 2.27 | |
| Percentage of basophil cell | 0.57 | 0.55 | 0.57 | 0.55 | |
| Absolute value of lymphocytes | 2.10 | 2.04 | 2.15 | 2.11 | |
| Absolute value of monocyte | 0.48 | 0.36 | 0.47 | 0.37 | |
| Absolute value of neutrophil | 3.68 | 3.06 | 3.64 | 3.12 | |
| Absolute value of acidophil cell | 0.17 | 0.13 | 0.16 | 0.13 | |
| Absolute value of basophil cell | 0.04 | 0.03 | 0.04 | 0.03 | |
| Red blood cell | 5.05 | 4.54 | 4.99 | 4.50 | |
| Hemoglobin | 156.91 | 137.04 | 155.67 | 136.26 | |
| Hematocrit | 45.88 | 40.89 | 45.51 | 40.53 | |
| Mean corpuscular volume | 91.02 | 90.20 | 91.34 | 90.25 | |
| Mean corpuscular hemoglobin | 31.14 | 30.23 | 31.26 | 30.35 | |
| Mean corpuscular hemoglobin concentration | 342.24 | 335.12 | 342.26 | 336.28 | |
| Coefficient of variation of red cell distribution width | 12.46 | 12.39 | 12.49 | 12.48 | |
| Standard deviation of red cell distribution width | 41.48 | 40.83 | 41.77 | 41.20 | |
| Platelet | 221.36 | 250.69 | 220.93 | 240.28 | |
| Platelet ratio | 0.23 | 0.26 | 0.23 | 0.25 | |
| Mean platelet volume | 10.54 | 10.58 | 10.63 | 10.52 | |
| Macroplatelet ratio | 29.32 | 29.54 | 29.99 | 28.98 | |
| Platelet distribution width | 12.61 | 12.44 | 12.72 | 12.30 | |
Open Research
Data Availability Statement
The data used to support the findings of this study are included in the article.


