Optimal Multiobjective Operation of Multicarrier Energy Hub Taking Energy Buffering Into Account
Abstract
This paper introduces a pioneering model for short-term planning of an energy hub (EH) that goes beyond traditional approaches by considering a comprehensive multicarrier energy system. The proposed model focuses on minimizing energy buffering costs while ensuring system operation and optimizing economic performance. The novelty of this study lies in its integrated approach, which simultaneously addresses operational efficiency, energy storage requirements, and overall system performance. The EH in this study is modeled as a prosumer within a day-ahead energy market, where both inflows and outflows of energy are optimized. The system’s capability to interact with upstream energy networks, including gas, heat, and electricity, is a critical aspect of the model. This interaction is managed through various technologies that enhance the hub’s ability to meet local demands efficiently. By employing an advanced improved particle swarm optimization (IPSO) algorithm, this model solves the complex multiobjective optimization problem inherent in EH management. The proposed model’s effectiveness is validated through extensive simulation on a test system, where its performance is compared with conventional heuristic optimization algorithms. The results demonstrate the superior efficiency and applicability of the IPSO algorithm, confirming that the proposed model offers a significant advancement in the field of sustainable energy management.
1. Introduction
Nowadays, different types of energy, including electricity, natural gas, heating, and cooling, are required by the energy consumers in residential, commercial, and industrial sectors. Although the energy networks have separately been operated, recently the integration of the electricity network with natural gas and district heating systems to create multienergy systems (MESs) is receiving more attention [1]. An MES including natural gas power, solar power, wind power, hydropower, and thermal generation can offer different energy advantages by utilizing the complementarities of natural resources [2]. The drawbacks of intermittency, randomness, seasonality, and volatility of renewable energy power systems can be overcome by MES which has characteristics of high reliability, flexibility, and stability in comparison to independent hydropower generation, photovoltaic (PV) power, and wind power systems [3, 4]. Comprehensive MES implementation can increase electric energy efficiency and result in improved economic and social status [5, 6].
For the modeling analysis of MESs, energy hub (EH) concept was firstly proposed by Geidl and Andersson [7] as a universal model that could be used to convert, transmit, and store various types of energy. The operation and planning of real-world energy systems frequently hint at the idea that EHs are the primary distributed energy sources (DERs) of the future. A system with DERs such as PV arrays, electrical storage system (ESS), combined heat and power (CHP), wind turbines, boilers, and other thermal energy producing systems can be used to define an EH. It might have a significant impact on converting, storing, and supplying energy [8]. The decrease in wasted energy from various energy sources and the increase in system effectiveness are two of the major advantages of EHs. To lower operating costs, lower emissions, and improve system flexibility/stability, EHs offer a significant potential for integrating distributed generation (DG) using renewable energy sources (RESs) [7]. As a result, the energy provider will use EH systems as a potent remedy for facilities’ heating, gas, and electrical networks’ optimal operation. However, the integration of these networks into the large-scale energy systems has faced many challenges due to the random nature of RES [9].
Many studies with the subject of modeling various energy systems have been done recently on gas, heat, and electricity. In order to give a thorough reference for future research, Mohammadi et al. [10] synthesized many models and concepts examined in the literature for EH while addressing their difficulties, advantages, and disadvantages. Ayele et al. [11] have proposed an extended EH by linking heating and electrical networks to model a general multicarrier energy system. The authors introduced a clear distinction between the interconnection point and the hub. A coupling model between inputs and outputs in MESs based on linear EH modeling was proposed by Wang et al. [12]. In [13], a new integrated model for the EH is developed taking into account thermal, cooling, and electrical demand as well as energy storages and demand response (DR) in order to solve the optimal EH scheduling problem. The EH model proposed in [14, 15] includes RES, DG, DR, and energy storages under uncertainty. A thorough linear model for the optimal design of EHs is proposed in [16] that takes stability limitations into consideration.
Optimal planning of EH is a significant scientific subject that can address a variety of issues, including where and when to invest in storage systems and energy converters as well as what size to take into account for this equipment to maximize economy and environmental advantages [17]. Considering the evaluation criteria of reliability, emission, and energy efficiency, an optimal expansion planning for an EH is proposed by Zhang et al. [18] that includes heat, natural gas, and electricity. Further, Dolatabadi et al. [19] presented a novel stochastic technique to build an EH system planning model while taking into consideration the energy demand, wind power uncertainty, and availability of components. The EH model that is suggested in this paper can reduce energy costs and increase supply reliability. The work in [20] offers an integrated strategy for the optimal planning and management of EH while taking into account the impacts of wind energy resources. To account for the effect of uncertain parameters, the proposed model was defined as a stochastic programming problem based on a two-stage optimization procedure. A Monte Carlo simulation strategy generates different scenarios to address the model’s uncertain parameters, and the possibilities are then decreased using the K-means algorithm. Additionally, the way DR programs may affect the operational subproblem is also considered.
The utilization of EH systems under various operating situations has also been widely explored within the context of an optimization problem while taking various objective functions into account. The authors in [21, 22] proposed an optimization technique and a basic power flow model compatible for EHs with multiple energy carriers including electricity, natural gas, and district heating networks. The optimal power flow of multiple energy carriers employing various RESs has been addressed in [23–26]. In reference [24], a multiperiod optimization method was introduced for solving the EH’s optimal power flow problem while considering biomass energy toward district heating in multiple energy carriers. In [27–31], EH utilization is optimized according to the costs of energy carriers as well as the real-time demand to determine how much of each energy carrier should be produced or purchased. Through combined cooling, heat, and power (CCHP), the authors of [30] optimally solved the issue of multienergy carriers’ power dispatch. Multicarrier energy network with multiobjective optimization has been studied in [31]. Also, to deliver the best performance of EH and energy networks, a two-level optimization strategy has been utilized in [32]. In reference [33], in order to perform the EH economic dispatch, a self-adaptive learning approach with a time-varying acceleration coefficient-gravitational search optimization is suggested. In [34], based on mixed-integer linear programming, a solution is suggested to solve the power flow of multiple energy carrier systems. In [35], the efficient operation of heat, natural gas, and electricity is sought while taking integrated energy storage devices and DRs into account.
Ma, Wu, and Hao [36] have researched the optimal scheduling and coordinated operation methods for micro-energy grids based on the sub-EH structure containing cooling hub, heating hub, and power hub. The sub-EH and optimal scheduling models that have been put forth are general approaches for looking at issues with power flow and economic dispatch in micro-energy grids. In the neighborhood grids, for multiple home EHs, a hierarchical energy management system is presented by Gholinejad et al. [37] where reducing the peak of the upstream grid and maximizing financial gain are the major goals. The suggested home energy management system (HEMS) controls energy production, storage, and exchange between various residences and the upstream network. In [38], a standardized modeling and optimization technique for the connected EH system was presented. In the suggested approach, single- and multidimensional piecewise linear approximation techniques, compressor function, generator cost functions, and nonconvex natural gas transmission functions are utilized. The model provided in [39] focuses on EH scheduling including various types of energy storage, RESs, and DR program for a day-ahead time horizon. The performance and efficiency of EH operation are specifically examined in the proposed model in order to better understand the ice storage effects as a developing and novel device of storage which is still a researchable topic.
Determining the best structure and sizing as well as the operating method based on the system requirements and considering the uncertainty of renewable sources, energy market spot prices, demands, etc. are the key problems for the smart energy hub (SEH) modeling. Uncertainty modeling is an essential area for future research in the SEH modeling since it helps decision-making process with a realistic optimal strategy. In [40], Lasemi et al. discuss the challenges of uncertainty analysis in the planning, design, and management of SEH. The considered hub energy, equipped with an energy conversion system, an energy storage system, and renewable energy resources. It is also connected to upstream energy networks to supply its own demand. The major goal of this work is to categorize and assess the current approaches of incorporating uncertainty into SEH design, operation, and planning in order to better understand upcoming difficulties. In order to reduce overall operating costs for EHs, the work in [41] has presented an effective operation model for managing numerous EHs with electrical and thermal energy demands. To address the uncertainties of distributed RESs and power costs, a reliable optimization technique has been put forth. Meanwhile, the suggested model has taken into account both thermal and electrical DR programs. To meet electricity, gas, and heat demand while taking into account DR programs [42–44], Yuan et al. [45] developed an optimal stochastic scheduling issue of P2G storage integrated with EH, electrical storage, and thermal storage (DRP). Electrical loads have been subjected to the load shifting–based DRP in order to reduce EH running costs. Additionally, the P2G storage system has been utilized as a new resource that connects the natural gas and electrical networks by first converting electricity to hydrogen and then, via electrolysis and automation, to natural gas.
- 1.
The proposed optimization problem includes energy interactions between upstream network and downstream EH according to the model of the EH and loads.
- 2.
A practical objective function is developed that takes into account the economic, environmental, and energy buffering costs to address the best design of the EH system.
- 3.
A planning and management algorithm is introduced to handle interactions between the upstream network and the EH in areas where operational and economic constraints are met.
- 4.
IPSO, PSO, and GA algorithms are utilized to create a robust planning algorithm to find the best use of different resources and energy storage to reduce overall costs.
A comparison that outlines advantages and disadvantages of previous work in the field versus the work presented in the current paper is proposed in Table 1.
| Criteria | Previous work | Current work | |
|---|---|---|---|
| Optimization method | - Mathematical methods (e.g., linear programming, nonlinear programming) | Evolutionary methods (e.g., improved particle swarm optimization—IPSO) | |
| Optimization method | Advantages of previous work | - Well-established theoretical foundation | - Flexible handling of complex, nonlinear, and dynamic problems |
| - Effective for linear and some nonlinear problems | - Inherent support for multiobjective optimization | ||
| - Predictable performance and results | |||
| Disadvantages of previous work | - May struggle with nonlinearity and complexity | - Potentially higher computational cost | |
| - Potential to get trapped in local minima | - Requires careful parameter tuning | ||
| - Less adaptable to dynamic changes | - May need more iterations to converge | ||
| Advantages of current work | - Superior in managing nonlinear and complex interactions | - Empirical validation of IPSO shows better performance compared to other heuristic techniques | |
| - Global search capability reduces risk of local minima | - Can balance multiple conflicting objectives effectively | ||
| - Adaptable to dynamic and changing conditions | |||
| Disadvantages of current work | - Higher computational cost | - Initial setup and parameter tuning can be time-consuming | |
| - Complexity in implementation and tuning | - Requires expertise in evolutionary algorithms for effective implementation | ||
| Handling of multiobjective optimization | - Often rigid and less flexible | - Inherent capability to handle multiobjective problems by maintaining a population of solutions | |
| - May require decomposition into single-objective problems | |||
| Adaptability to market fluctuations | - Less adaptable, often static models | - Highly adaptable, suitable for dynamic market conditions | |
| Scalability and robustness | - Challenges in scaling for large, complex systems | - More robust and scalable for large, high-dimensional problems | |
| Real-world applicability | - Sometimes limited due to oversimplified assumptions | - Demonstrated empirical performance and practical applicability | |
The rest of this paper is structured as follows.
Section 2 introduces the framework, formulation, and model of the EH and its components. The proposed optimization problem is presented in Section 3. In Section 4, the solution to EH planning optimization problem will be presented. Section 5 covers the simulation findings and additional discussion. Finally, Section 6 draws the conclusions.
2. EH Modeling
2.1. Proposed EH Definition
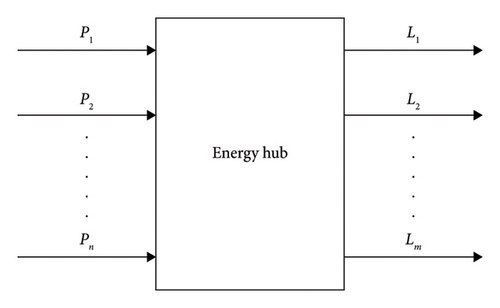
In the EH architecture, connections between consumers, producers, and transmitters can occur either directly or through conversion tools that control one or more energy carriers [10]. These carriers must be converted from one form to another using converters. Examples of converter devices include CHP, fuel cells, furnaces, and boilers. Combining several energy carriers in EHs has a number of benefits including improved system stability, flexible generation, and optimal operation potential [7]. Particularly in urban and rural regions, they can be used for applications with wide ranges, including industrial, residential, and commercial ones [7]. The proposed EH is schematically depicted in Figure 1, with electricity, natural gas, and district heating serving as the primary energy sources. Depending on the conditions inside the hub, the energy carriers at the input side are transformed or transported to the output. Meeting the demands of the various loads at the output using direct conversion or connection tools is the specific objective. EH can exchange power with the upstream major market and optimize operational parameters via ESSs. The suggested EH is viewed as a prosumer, which can exchange energy with upstream energy networks, as can be seen in Figure 1.
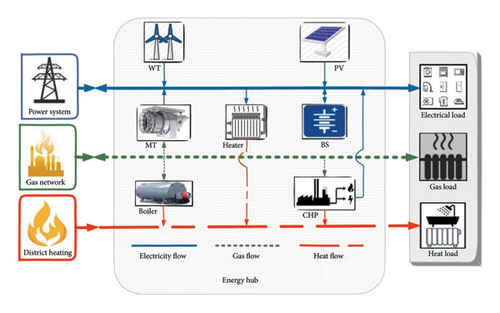
Figure 1 shows the interaction of facilities and various forms of energies in the proposed EH. In addition, EH can maximize its benefits by selling to and intervening in upstream energy systems. The proposed problem optimizes the next day operation problem of the proposed EH by implementing the best energy management for local energy consumption as well as the best bidding strategy to participate in upstream energy market. The suggested self-scheduling model is for the next 24 h. To put it another way, the suggested model is tested on the day-ahead market. The optimization method must simultaneously assess operation interactions and connection limitations while optimizing EH’s day-ahead planning.
2.2. Proposed EH Formulation
The proposed EH is supplied by a power system, a natural gas, and a district heating system network and is connected to a gas, an electrical, and a heating load. As seen in Figure 1, the proposed system takes into account WT, PV, MT units, energy storage systems, boilers, electrical heaters, and CHP units. As was already indicated, the EHs couple a variety of energy carriers using some facilities that are supplied by one type of energy resource and produce one or two different forms of energies. As one of the main components of the EH system, the CHP unit, for instance, is fueled with natural gas and produces both thermal and electrical energy. Consequently, it is difficult to interface between various operational factors and the various EH facilities. Furthermore, by taking into account prosumer roles, the suggested EH can buy electrical energy from the upstream networks during the low-price periods, store them in storage systems such as electrical energy storage, and then resell them to the upstream networks during the high-price periods. Therefore, another difficulty in the proposed problem is determining the appropriate bidding strategy based on the day-ahead energy market and EH restrictions. The full model of a multicarrier EH is created by deriving mathematical models for each part of an EH in the subsections that follow.
3. The Proposed Optimization Problem
The primary objective of the proposed model is to meet electrical, heating, and gas demands in the EH considering different constraints. Moreover, the proposed EH is presented as a prosumer, i.e., it can exchange electricity with the upstream network. A general model that is constrained by different limitations is developed to represent the optimal EH scheduling considering many requirements with the goal of minimizing total operation costs. This section presents the entire problem formulation, including problem constraints and the objective function.
3.1. Problem Constraints
The restrictions on the problem are mostly related to the models for renewable energy, energy conversion units, power balancing, maximum output constraints for each generation system, energy conversion devices, and storage unit constraints.
3.1.1. Renewable Sources Model
-
Wind turbine model: In the electricity generation system, a wind turbine is utilized to transform wind kinetic energy into mechanical energy, which is then used to produce electricity. In general, the air density, wind speed, turbine size, and a parameter termed Cp influence the amount of power generated by a wind turbine as follows:
() -
where is the power output of the wind turbine at time t. Moreover, ρ, vt, and RWT are, respectively, the air density, wind speed at moment t, and the turbine blade’s radius while Cp denotes the energy efficiency. In order to model wind turbines, many important factors, including wind availability and wind turbine power curve, must be considered [46]. If the location of installation and the wind turbine type are fixed, it is also assumed that the blade radius and air density are constant. Therefore, according to the power performance, the actual relationship between and vt can be determined as the following equations:
() -
where vr, Pr, vci, and vco are rated wind speed, rated power, and internal and external wind cutting speed, respectively. In addition, a, b, c, and d are constants and depend on the installation location and the type of wind turbine.
-
PV array model: A PV array is an interconnected set of solar panels that converts solar radiation into electrical energy in which the power required to charge a load cannot be supplied by a single module. PV arrays generate electricity without any moving parts. Thus, they can be operated quietly without any pollution and with low maintenance [47]. The impact of solar density is modeled by taking into account the output power of the module in relation to the radiation [46]. The module output power is modeled as
() -
where is the output power of the module in radiation at moment t and PSTC is the maximum power of the module in standard test conditions. and Tr are the ambient and the reference temperature at moment t, respectively, while K is the coefficient of the relationship between the output power and the temperature.
3.1.2. Energy Conversion Units
-
CHP model: The CHP unit uses natural gas to produce heat and electricity. Equations (6)–(10) define the mathematical model of this equipment. Equation (6) shows the gas energy imported to CHP and the produced electrical power and heat are determined using equations (7) and (8). The total CHP energy at time t is calculated by equation (9). The natural gas input is limited for this converter by equation (10) which shows possible nonlinear operation area for CHP unit:
()()()()() -
where and are the imported gas energy to CHP and the total energy of CHP at moment t, and are the CHP electrical output energy at moment t and gas-to-electricity conversion efficiency of CHP, and and are the CHP heat output energy and gas-to-heat conversion efficiency of CHP. Also, is the CHP total energy and , , , , and are the CHP coefficients and is CHP’s ON/OFF status at time t, [1, 0], respectively.
-
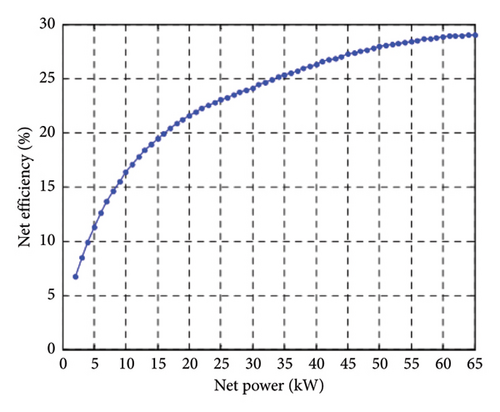
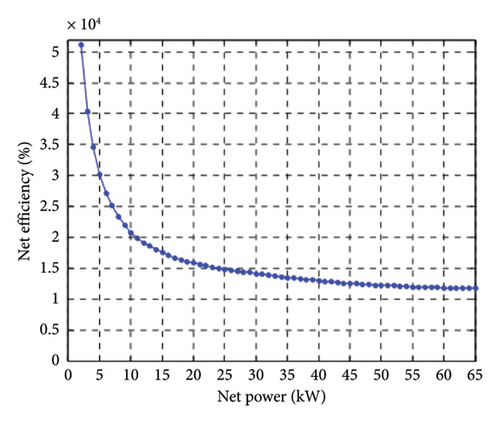
MT model: IPSO typically use a simple design with a small number of moving parts to reduce maintenance costs and improve system reliability. The micro turbine model is similar to the fuel cell model. However, the curves and parameters need to be modified to define the performance of this unit. In order to obtain the efficiency of micro turbine, the electric and thermal efficiency curves of micro turbine can be used and its efficiency can be obtained in terms of the generated power [47]. The micro turbine used in the proposed EH is the Capstone Model C65 MT type whose performance under partial load and ISO conditions is presented in Figures 3 and 4. Unlike fuel cells, MT efficiency increases with increasing generated power, as modeled by the following equation:
()()()()() -
Here, , Cnl, , NMT, and LHV are the imported gas energy to MT, the cost of natural gas fed into MT, the net generated electric power in a specific period, the efficiency in the specific period, and the low heating value of the fuel, respectively. Also, is the MT electrical output energy, is the MT total energy at time t and , , , , and are the MT coefficients, and is MT’s ON/OFF status at time t, [1, 0]. The specific relationship between and NMT in terms of electrical power can be obtained by interpolating the data provided by the manufacturer in the MT economic model [47] as shown in equation (12).
-
Heater model: Heaters generate thermal energy by using electrical power for heating demands. Equations (16) and (17) are proposed for modeling this equipment:
()() -
where and are the input electrical energy to heater and the total energy of heater and and ηHeater are the heater’s heat output energy and electricity-to-heat conversion efficiency of heater while is the heater’s ON/OFF status at time t, [1, 0].
-
Gas boiler model: In the proposed EH system, when the total heat produced by the CHP units and heater is insufficient, the boiler is called upon as a backup system to meet the thermal energy demand. In order to meet the need for thermal energy, the purchased natural gas is burned in the boiler. The boiler introduced in equation (18) produces heat energy by burning cubic meters of natural gas proportionate to its efficiency. Constraint equation (19) represents the limitation of gas amount that can be consumed.
()() -
where , , and ηBoiler are the gas energy input to boiler, the total energy of boiler, and the gas-to-heat conversion efficiency of boiler, respectively, and is the boiler’s ON/OFF status at time t, [1, 0].
3.1.3. Battery Storage (BS) Model
3.1.4. Energy Balance Constraints
-
Electrical power balance: The equation for equilibrium of active power is written as equation (26). The active powers of WT and PV arrays are assumed to be obtained at maximum power point depending on weather conditions. The power balance limit of the EH is written as follows:
() -
Gas energy balance: The gas energy balance limit during the simulation period can be written as
() -
District heating energy balance: The heating power balance limit during the simulation period can be expressed as
()
3.2. Objective Function
4. Proposed Solution Methodology
In this paper, we have employed IPSO algorithm by considering adaptive inertia factor to solve the proposed problem. In the rest of this section, the detailed description of the proposed solution methodology is given.
4.1. Traditional Particle Swarm Algorithm
In equation (37), Nmax is the overall iteration count and n is the current iteration. Following the addition of the linearly declining inertia factor ω, PSO is able to begin exploring a bigger region and target the general position of the optimal solution more quickly. As ω gradually drops and particle velocity slows, PSO initiates an intricate local search (ω) that is analogous to the temperature parameter in the simulated annealing method. This helps to speed up convergence and enhance PSO algorithm’s performance.
4.2. IPSO Algorithm
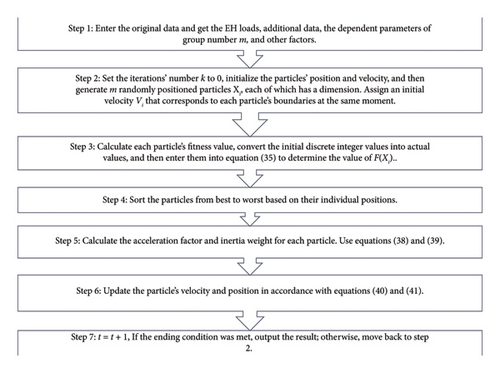
The EH optimization problem updates the initial values of the EH bids. The following steps shown in Figure 5 should be taken into consideration when applying the IPSO algorithm to solve the EH optimization problem.
5. Simulation Results
After the energy carriers are created or extracted in the production system, they are transmitted and distributed to customers through networks. If the transmission channels in the energy supply network are taken immediately and without preparation, they struggle with issues like excess demand on available supply and excess supply on available demand. Some network loads will go unsupplied if the amount of consumed energy exceeds the amount of generated energy. However, if greater energy is created than is needed, it will unavoidably cost more to manufacture because there will not be enough space to store the extra energy. The general nonsatisfaction of the grid’s consumers and the reliability of such electricity networks are both low. As suggested in the introduction section, one way to deal with this issue is to gather energy carriers made in an EH system. Additionally, some energy carriers could be created by the power plant, which will improve the network’s reliability. The multienergy district is used in the electric-gas-heat-combined EH optimization scheduling model suggested in this paper.
The pseudocode of IPSO algorithm is proposed in Table 2.
| Algorithm: IPSO |
|---|
| pBest i: Best individual |
| pBest: Best group |
| for each particle i |
| Initialize velocity Vi and position Xi for particle i |
| Calculate the individual optimal fitness and set pBest i = Xi |
| end for |
| gBest = max{pBest i} |
| while not stop |
| for t = 1 to tmax |
| Update the velocity and position of particle i |
| Calculate particle i |
| if fitness (Xi) > fitness (pBest i) |
| pBest i = Xi; |
| if fitness (pBest i) > fitness (gBest) |
| gBest = pBest i; |
| end for |
| end while |
| print gBest |
The study of the EH system, which includes CHP, boiler units, MT, heaters, wind turbines, PV systems, and ESSs to satisfy local electricity, heat, and natural gas demands, aims to assess the efficacy of the proposed EH model. This study uses a typical day’s schedule rather than taking into account energy transfer losses [48]. The proposed model is implemented using the MATLAB platform on a computer with an Intel Core i5-M 540 CPU running at 2.53 GHz and 8 GB of RAM to address the energy planning problem in the studied EH.
5.1. Input Data
Figure 6 illustrates several load profiles that the EH system should provide. Additionally, Figure 7 shows the hourly gas and electricity energy prices.
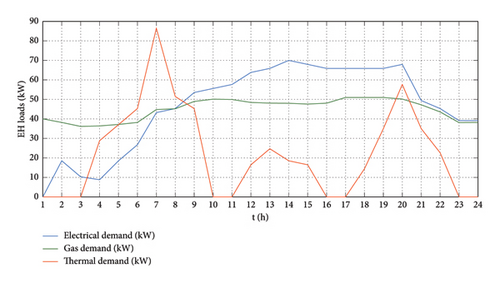
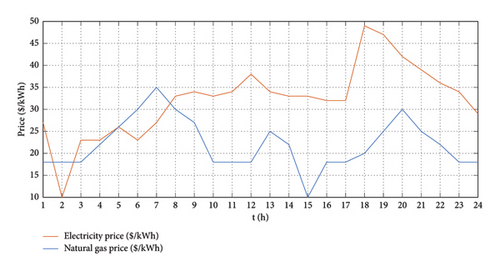
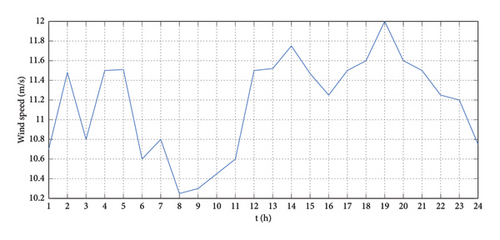
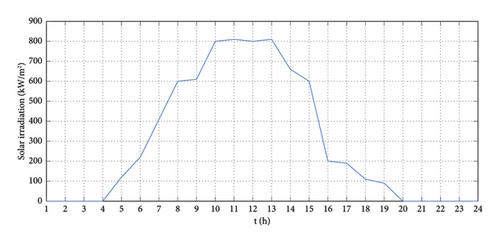
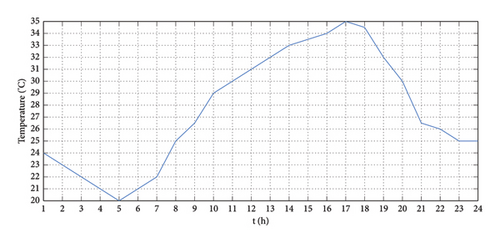
Figure 8 shows the PV system’s temperature, solar radiation, and the wind turbine’s hourly wind speed. Table 3 lists the prices of other energy sources purchased for use by various pieces of equipment in the EH system as well as the expenses of various generation units. The AOC 15/50 wind turbine utilized in this study was developed by Seaforth Energy Company. Table 4 lists the variables that were utilized to model the wind speed curve’s output power. Additionally, this table provides the specifications of the PV array as measured under STC conditions [44].
| Parameter | Value | Unit |
|---|---|---|
| Heater maximum power | 100 | kW |
| Boiler maximum power | 100 | kW |
| CHP maximum power | 100 | kW |
| MT maximum power | 65 | kW |
| BS maximum charge and discharge capacity | 50, −50 | kW |
| WT maximum power | 50 | kW |
| PV maximum power | 25 | kW |
| District heating energy price | 10 | $/kW |
| WT unit parameters | PV unit parameters | ||||
|---|---|---|---|---|---|
| # | Unit | Value | # | Unit | Value |
| Vci | m/s | 5.26 | PSTC | kW | 25 |
| Vr | m/s | 14.68 | K | — | 0.016 |
| Vco | m/s | 22.40 | GSTC | W/m2 | 1000 |
| a, b, c, d | — | −0.0609, 1.7882, −10.8347, 16.3773 | Tr | °C | 0 |
| Pr | kW | 50 | |||
The parameters belong to the CHP and MT units, and heater and boiler units are given in Tables 5 and 6, respectively. Table 7 also provides IPSO algorithm parameters.
| CHP unit parameters | MT unit parameters | ||||
|---|---|---|---|---|---|
| # | Unit | Value | # | Unit | Value |
| — | 0.35 | Cnl | — | 0.1 | |
| — | 0.45 | LHV | — | 0.65 | |
| — | 1 | — | 100 | ||
| — | 0.1 | — | 0.2 | ||
| — | 0.0001 | — | 0.001 | ||
| — | 1 | — | 2 | ||
| — | 0.0001 | — | 0.001 | ||
| Heater unit parameters | Gas boiler unit parameters | ||||
|---|---|---|---|---|---|
| # | Unit | Value | # | Unit | Value |
| ηHeater | — | 0.95 | ηBoiler | — | 0.75 |
| Parameter | Value |
|---|---|
| NV | 120 |
| npop | 20 |
| Itterationmax | 1000 |
| Α | 0.1 |
| Tf | 1 |
| NE | 20 |
| k | 0.5 |
| C1 & C2 | 1, 3.5 |
| αE, αG, αH, αBS | 10, 10, 10, 1000 |
Equations (4) and (5) calculate the hourly power generated by the PV unit and WTs using the data of solar radiation and wind speed. The generated electricity from PV arrays and WTs is depicted in Figure 9.


5.2. Results and Discussion
In the current study, the IPSO algorithm is employed to determine the optimal planning for the EH system under the assumption that all demand can be met using the available components. Inputs to the problem include solar radiation, wind speed, load profile, and costs, which are considered critical factors in modeling and forecasting energy production and consumption within the system. Consequently, the optimal generation or consumption of each component is calculated using the proposed methodology, illustrated in Figure 10. This method takes into account the energy stored in battery ESSs, the electricity generated by CHP and MT units, and the thermal power produced by the heater, boiler, and CHP units.


The results presented in Figure 10(a) clearly demonstrate that the charging and discharging behavior of the BS has been optimized throughout the day to maximize the utilization of stochastic energy generated by wind and solar resources. However, during hours 20 and 21, due to the absence of energy production from the PV system and the increased consumption by users, the BS releases its stored energy to the grid to meet the electrical demands.
The results presented in Figures 10(b) and 10(c) clearly indicate that the CHP system is activated during the necessary hours, producing both electrical energy and utilizing the generated heat. This optimal operation of the CHP is driven by the demand for the produced heat, as shown in Figure 10(c). Furthermore, whenever there is only a demand for electrical energy and no need for heat, the MT system is solely used to generate energy. In such cases, a portion of the electrical energy produced by the MT is stored in the BS system for future use.
Figure 11 displays the amounts of electricity, heat, and gas that were purchased from the grid and sold back to it.


In this work, the interactions among resources, loads, and ESSs are carefully examined. Renewable energy systems are first examined to supply electrical loads, as covered in the previous section. As a result, at certain times, DG power output exceeds electrical demand. As previously noted, if renewable energy–based DGs provide more power than required by electrical loads, the excess power is used to charge the battery ESSs. Also, according to the EH planning algorithm, any excess electricity is bought from the electrical network if the power provided by the EH’s components is insufficient to meet the overall electricity demand. Hence, the network supplies the demand with stable situation.
As we know, the EH is programmed to show the best performance in a 24-hour day through optimization and reasonable profit. For example, at 1 o’clock in the morning, because the purchased price of electricity (Figure 11) from the upstream network is high, it is economical to purchase gas to generate electricity from CHP and MT units since gas price is lower than electricity (Figures 10 and 11). Given the gas price in Figure 6, MT and CHP units generate electricity, as shown in Figure 10(b). During periods when the purchase price of gas is low, it is economical to use MT and CHP units to generate electricity.
According to the amount of demand and consumption, the required electricity is generated by the EH and is provided to the consumer units. One of these consumers is the heater which produces the required heat. At this time, due to gas purchase, heat is also supplied through boiler and CHP units (Figure 10(c)). The surplus power is sold to the upstream network at 1 a.m. due to the reasonable price of electricity (Figure 11) and the total heat generated is also sold. This makes for the profitability of the hub. Of course, the wind turbine and the PV system (Figure 9) are always at their maximum generation due to their near-zero production costs for the hub.
The trend of changes in electricity purchases from the grid is generally influenced by the electricity load demand profile during the day (Figure 6). By paying attention to Figure 11, during hours when the relative peak of electricity price is accompanied by heat load demand, for example, at 8 p.m., the EH supplies its electric load demand through CHP and MT (Figure 10(b)). From 6 p.m. to 7 p.m., when electricity prices are at their daily peak, electricity purchases from the grid fall sharply (Figure 11).
In the studied EH, a BS is used (Figure 10(a)) which saves power in case of excess production. Also, in cases when the demand is high, the production capacity of the hub is low, and/or the purchase price of electricity is high, the battery power is injected to the network. As can be seen in Figure 10(a), when the production of electricity is not enough, for example, at 1 o’clock in the morning, the BS is inevitably discharged and at 4 o’clock, due to increased production and the reasonable price of electricity, battery is charged to the maximum allowable SOC. The heat generated at this time, which is obtained from boiler, heater, and CHP units, can be sold. In the studied EH, it is not possible to produce gas and it is always purchased from the upstream network. Thus, in the hours when the gas price is reasonable, gas is purchased as needed to help generate electricity from MT and CHP units. Of course, the gas purchased for the boiler will also be used and the heat produced by this unit will be sold. At hour 20, the EH shows the greatest loss in terms of cost due to high overall demand, and at hour 22, due to the reasonable sale price and the demand level, it shows the highest profit.
5.3. Sensitivity Analysis
In this section, a sensitivity analysis regarding the proposed objective functions is performed in order to investigate the effect of each cost function on the final results of the proposed problem solution. To this end, 6 different scenarios have been considered by applying different weighting coefficients of the objectives of the optimization problem. The results obtained by applying proposed model for different scenarios are listed in Table 8. As can be seen, considering the biggest value for w1, the most preferred solution is found by paying more attention to energy trading cost between EH and upstream energy networks. Similarly, by increasing w2, the proposed algorithm tries to find a solution that offers a lower energy buffering cost.
| Solution # | Cost function | Solution value | |||
|---|---|---|---|---|---|
| F1 | F2 | w1 | w2 | F | |
| 1 | 1.1800e + 05 | 1.6403e + 04 | 0.0 | 1.0 | 1 |
| 2 | −4.8982e + 05 | 3.9253e + 04 | 0.2 | 0.8 | 2.0238 |
| 3 | −7.9004e + 05 | 4.7178e + 04 | 0.4 | 0.6 | 2.0784 |
| 4 | −7.9574e + 05 | 5.2105e + 04 | 0.6 | 0.4 | 1.8035 |
| 5 | −8.9179e + 05 | 5.4077e + 04 | 0.8 | 0.2 | 1.4556 |
| 6 | −8.9604e + 05 | 5.4398e + 04 | 1.0 | 0.0 | 1 |
5.4. Algorithm Evaluation
The proposed algorithm’s performance is assessed in this section. Because the proposed problem is presented as an NLP optimization problem, it is solved using a metaheuristic approach. Furthermore, the proposed technique is compared to alternative ways for solving the NLP problem. Four additional algorithms Fmincon, GA, TLBO, and PSO are used, and the results are compared to those obtained by the proposed algorithm. Because the metaheuristic method is inherently unpredictable, the algorithm should be repeated multiple times to acquire the best results. Each of these runs is referred to as an era. In different iterations, the algorithm searches for the best answer in each epoch. For a proper comparison across methods, the initial population, as well as the number of algorithm iterations and running epochs, should all be equal. The collected results of the various algorithms are provided in Table 9 along with statistical analysis. According to this table, the IPSO algorithm has the best outcome among the many algorithms linked with the best and worst results. In addition, when it comes to variance and standard deviation indices, the TLBO approach delivers the best results.
| Best result | Worst result | Mean | Standard deviation | Variance | |
|---|---|---|---|---|---|
| Fmincon | 1.9985 | 3.1338 | 2.7855 | 0.7652 | 1.1572 |
| GA | 2.0153 | 3.1152 | 2.5768 | 0.9857 | 1.2368 |
| TLBO | 1.9945 | 2.8925 | 2.1865 | 0.3459 | 0.9586 |
| PSO | 2.1086 | 3.3189 | 2.9395 | 0.7689 | 1.4524 |
| IPSO | 1.4556 | 2.9518 | 1.8345 | 0.4657 | 1.0928 |
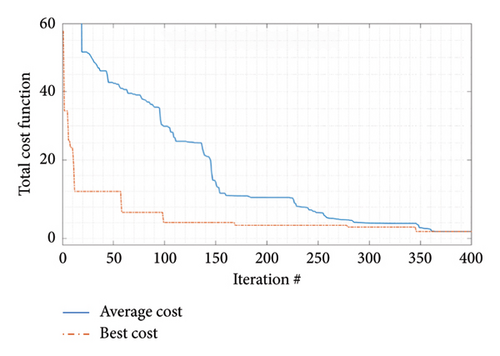
Figure 12 depicts the convergence process for the suggested algorithm’s best obtained results. The best and average costs based on the per-unit value are shown in this diagram. When the average cost value achieves the best cost value, the metaheuristic algorithm is said to have converged. The suggested approach converges in iteration 364, as illustrated in Figure 12.
6. Conclusion
This paper presents a novel framework for optimal operation aimed at reducing the costs of an EH. In an integrated energy market, consisting of electrical power, natural gas, and heat market, the proposed EH is presented as a prosumer and bidirectional flows are investigated between EH and upstream energy networks. The proposed model considers various factors such as economic and energy factors. Both inflows and outflows of energy at the EH are checked as the proposed problem variables. The simulation results demonstrate that for optimal performance in an EH, in addition to issues related to load and its price, attention to thermal load consumption conditions and the price of natural gas is also essential. The necessity for optimal planning of the charging and discharging of energy storage systems is clearly reflected in the results, highlighting the efficient and targeted use of RESs.
In general, it can be said that the difference in electricity and natural gas prices at different times of the day, along with their varying behaviors, creates an opportunity to increase the profitability of the EH. This allows electricity to be generated during periods when electricity prices are high and natural gas prices are low. During these times, MT and CHP systems, by consuming natural gas and generating electricity, can be profitable. On the opposite side, during times when natural gas prices are high, the stored power in batteries, which comes from RESs, can be used to produce thermal energy at the lowest cost.
Conflicts of Interest
The authors declare no conflicts of interest.
Author Contributions
M.-M. M.-Z., conceptualization, methodology development, data collection, simulation, and initial manuscript drafting; R. E., supervision, project administration, validation of results, critical review, and editing of the manuscript; M. G., software implementation, result verification, and manuscript revision.
Funding
The authors received no specific funding for this work.
Open Research
Data Availability Statement
The data that support the findings of this study are available from the corresponding author upon reasonable request.


