A Novel TKEO With the Decision Tree–Based Method for Fault Analysis of the HVDC Transmission Link Fed by Offshore Wind and Solar Farms
Abstract
Detecting and classifying various faults on high voltage DC transmission (HVDC) lines and pinpointing their locations are crucial tasks for the power system’s efficient operation. This paper presents a Teager–Kaiser energy operator (TKEO) technique with a decision tree–based fault type classifier to monitor power system faults on the HVDC transmission line. The change identification filter technique is used to identify the fault location and record it as the change initiation point (CIP). There are only three samples of the average current (Iavrg) used at the CIP of the HVDC link. The eight indices for fault analysis are produced by the suggested TKEO approach by processing average current (Iavrg) signals not the differential current. Electricity networks may be restored as soon as practical while minimizing economic losses to the greatest extent possible, thanks to the new method’s speedy problem identification. This state-of-the-art technique improves fault localization, categorization, and identification efficiency. It also reduces the time and computational complexity needed to find faults. It is even more cost-effective because the suggested method is connected to a nearby microgrid, which supplies a small portion of the total electricity produced by the two wind and solar farms. With a fault-detecting efficiency of 97%, the suggested method shows a significant improvement in accuracy.
1. Introduction
One of the main goals of renewable energy is to close the gap between supply and demand for electricity. Nowadays, a significant portion of demand is met by wind, solar, and tidal technologies, particularly onshore wind farms [1, 3]. Offshore wind farms can also fulfill the criterion, in addition to onshore wind farms. For higher ratings, high-voltage direct current (HVDC) transmission electrical power transmission systems are more advantageous than HVAC transmission systems [4, 5].
Losses frequently rise with transmission distance because of increases in capacitance, inductance, and resistance. The skin effect and corona losses cause the transmission length to reduce transmission efficiency.
The aforementioned losses can be addressed by the HVDC bipolar transmission technology. Over the following few days, bulk power will be transported across two networks: voltage source converter (VSC) and CSC. Cost reduction and improved transmission efficiency are desired for VSC-type HVDC transmission.
Since it produces reactive power in VSC-based systems, a reactive compensator is not required. Furthermore, VSC-type systems allow for the independent management of both reactive and active power. While there are benefits to the VSC-based HVDC bipolar transmission system over the traditional system, there are also challenges. These include model design, system stability, converter regulation, and component protection, particularly for transmission lines, transformers, and converters. Fault detection and classification, with the location of the fault being a crucial challenge, is one of the most important problems in the HVDC transmission system. If an extended amount of time is permitted for the fault current to stay on the HVDC transmission link, the entire system will fail horribly. As quickly as feasible, the type of fault and its location on the transmission line should be identified to repair the system and minimize financial damages. An extended fault current on the HVDC transmission system may result in a catastrophic failure of the entire system. The Hilbert–Huang transform and the wavelet method are two commonly used fault analysis approaches. Currently, these methods’ fault-finding efficiency falls short of expectations [6].
Employing a decision tree–based mechanism, this study aims to analyze faults occurring on HVDC transmission lines while assessing the effectiveness of the Teager–Kaiser energy operator (TKEO) method. The flaw may be found with minimal computational complexity in an average of 13 s. In fault analysis, the average current (Iavrg) signals are the two most important measurements [7]. At the change initiation point (CIP) of an HVDC link, the average current (Iavrg) signal is used. To derive the necessary eight indices, the proposed TKEO method simplifies by analyzing only three instances of average current (Iavrg) signals—specifically at the CIP, as well as one sample each shortly before and after the CIP. Utilizing these signals, the “Teager Energy” is swiftly computed. This calculated “Teager Energy” yields various features including amplified temperature, temperature, standard deviation, mean, entropy, kurtosis, maximum amplitude, and variance. “In subsequent stages, F1 (energy), F2 (amplified energy), F3 (mean), F4 (standard deviation), F5 (kurtosis), F6 (entropy), F7 (variance), and F8 (maximum amplitude) provide the desired information.” Subsequently, a rudimentary event classifier utilizing a tree structure was developed, enabling the utilization of the aforementioned feature for defect identification and categorization. This section outlines the entire work completed in this paper.
Section 1 explains the topic of this article and the fault analysis of HVDC (VSC-based) bipolar transmission lines supplied by offshore wind and solar farms. Section 2 described the single line design of the double-fed induction generator (DFIG) offshore wind farm model with HVDC transmission line needs. Section 3 illustrates the proposed technique’s methodology. Section 4 describes the whole operation of the proposed innovative method. Section 5 explains detailed results and analysis. Section 6 illustrates the final outcome of the proposed strategy.
1.1. Literature Review
There have been numerous fault detection and classification algorithms developed for HVDC transmission networks. However, due to the aforementioned issues, HVDC transmission line security techniques are more limited than typical transmission system methods [8]. The following is a comprehensive review of the literature focusing on exploring fault detection and classification techniques for HVDC transmission lines. Every attempt has been made to incorporate pertinent and up-to-date research in this area. Nonetheless, the survey results reveal a noticeable gap in the availability of voltage imbalance classification and detection systems tailored for HVDC transmission lines. Numerous factors, as previously highlighted, influence fault classification and detection methodologies in HVDC transmission lines. These factors have been scrutinized from various perspectives, each undergoing individual analysis [9].
Mohan and Vittal [10] recommended an approach for nonunit type protection in hybrid HVDC transmission links that involves assessing the faulty segment on the basis of changes observed in backward traveling waveforms during both external and internal fault scenarios. Through this study, the devised protection method has shown effectiveness in distinguishing between external and internal faults and precisely determining the affected line, as evidenced by outcomes of simulations conducted.
Wang and Zhang [11] proposed polarity-based pilot transmission line protection for hybrid HVDC systems. To discern the polarity characteristics of fault components and detect transmission line faults, a method involving digitization of current and voltage fault components is employed. This approach has the potential to mitigate the influence of discrepancies in fault component magnitudes stemming from different converter structures and control strategies. Simulation outcomes validate the practicality and credibility of the proposed protection scheme, showcasing its ability to accurately distinguish faults, including those with high transition resistance.
Liu et al. [12] offered a protection mechanism that gives a rapid and dependable solution to these drawbacks. The proposed algorithm utilizes traveling wave simulation and analysis for the detection of abrupt transient signals to enhance protection measures. Renowned for its efficiency, reliability, and selectivity, the algorithm operates with a low sampling frequency. Evaluation of the efficacy of this security measure was conducted by a real-time digital simulator (RTDS).
Li et al. [13] developed a novel fault feature, the convolution power, to handle fault discrimination in hybrid multiterminal DC (MTDC) systems. The convolution power can use the frequency characteristic (FC) of DC boundaries to distinguish between external and internal faults, for which the frequency band (FBs) can be mathematically produced. When the power of convolution is combined with the benefits of current and voltage traveling waves, the analysis results demonstrate that it has the same capability as current traveling waves to determine the path of faults and distinguish between external and internal faults in specific circuit breakers, even when the fault resistance is high.
Wang et al. [14] established a new fault identification criterion based on the original signal’s temporal domain integral. The success of the strategy is supported by the paper’s electromagnetic transients including DC (EMTDC) simulation and site data.
Li et al. [15] proposed an adaptive fault detection approach based on the Laplace transform or S transform (ST). This improved ST detects problems in the frequency domain in as low as 0.3 milliseconds. The detection system has two parts: high frequency for speedy reactions and low frequency for distinguishing failures from transient conditions.
Li et al.’s [16] study introduced a swift and precise DC fault detection system leveraging the Hilbert–Huang transform. It employs the instantaneous energy density level of DC line current as a detection metric to discern various transients, “such as phase-to-phase (PP) faults, phase-to-ground (PG) faults,” power flow alterations, and lightning strikes. The efficacy of this method was verified across varied fault scenarios and noise levels through experimentation conducted in both a phase-to-phase (P2P) experimental setup and an MTDC simulation system utilizing OPAL-RT.
Mitra et al.’s [17] paper describes a method for efficiently isolating fault zones in a radial MTDC without the usage of a communication link. Individual local measurements are used to control the DC circuit breakers of the hybrid type in this manner. Outside the protective range of a breaker, faults induce fluctuations in the rate of current or voltage alteration, potentially resulting in breaker failures.
Yang et al. [18] propose a data-driven methodology for extracting and synthesizing multidimensional characteristics in MTDC systems, resulting in quick and reliable DC fault detection and classification. Highly comparable time-series analysis (HCTSA) is first used to extract vast features with obvious physical interpretations from fault current waveforms, and then, a few features useful for fault diagnosis are chosen using the greedy forward search. Based on the reduced characteristics, a softmax regression classifier (SRC) is presented to determine the likelihood of each defect category with a low online computing overhead.
1.2. Identified Research Gaps
- ➢
Fault-finding efficiency not greater than 80% was achieved in several studies. A less number of algorithms generate data that “may cause the entire system to be misled.”
- ➢
The majority of research studies have neglected to consider “the computational complexity and time required for identifying and classifying faults” for fault analysis.
- ➢
Many studies have not reduced the relay tripping time as soon as possible, which may cause collapse of the entire system.
- ➢
For the fault analysis of power system equipment, a minority of researchers focused specifically on addressing issues related to faulty signals caused by noise interference only.
- ➢
At present, HVDC transmission lines are predominantly fed by conventional power plants, with minimal integration of renewable energy resources. Research into transmitting electricity generated by renewable energy sources via HVDC links using well-designed models is still lacking.
1.3. Unique Contributions of the Article
To achieve precise faulty link identification and classification in the HVDC transmission system, it is imperative to address the identified research voids:
- ✓
The study is conducted to improve the efficiency by 97% in terms of the precise fault type as well as to reduce the time required to find faults.
- ✓
Only three current samples are enough to analyze the various faults, and the computing burden is reduced.
- ✓
The relay tripping time is reduced by about 12 milliseconds which is very crucial to isolate the abnormal section from the healthy section; otherwise, the whole system may get collapsed.
- ✓
The proposed study stands out as it is the first to integrate the TKEO method “with a decision tree–based fault classifier in an HVDC transmission system for fault analysis”.
- ✓
Moreover, the proposed approach addresses the drawbacks of current methods, including the complexity of computing and the time needed for fault detection and classification.
- ✓
Setting the threshold value accurately in fluctuating DC analysis poses a significant challenge when conducting precise fault analysis.
2. Single Line Diagram of the Proposed Model
Figure 1 shows a 150-km, VSC-based, HVDC bipolar transmission link, represented by solid yellow lines and supplemented by dashed red lines, receiving power from both an offshore wind farm and a solar farm.
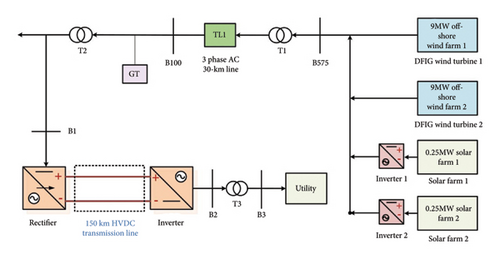
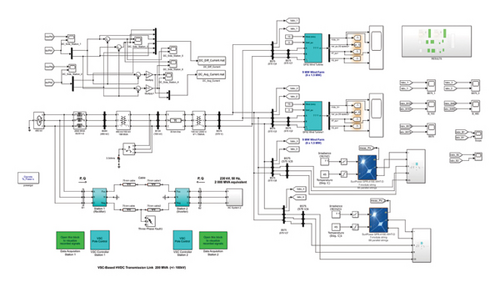
The major emphasis of this novel work is to perform analysis of various disturbances (faults) on a 150-km high-voltage DC transmission line. It includes two integrated 9 MW offshore DFIG wind farms with six 1.5 MW wind turbines each and two 250 KW solar farms. Induction generator converters with wound rotors are used in the DFIG. For the simulation, the wind speed has been maintained at a constant rate of 15 m/s. The SPR-415E WHT-D solar power model is employed, which has 7 module strings (series) and 88 parallel strings and a maximum power of 415 W. In this proposed novel method, two DFIG wind turbines are linked in the cascade mode, producing a maximum voltage of 2300 V via bus B1, and two PV arrays are also linked in the cascade mode, producing a maximum voltage of 230 V via bus B1. The integrated system, which includes offshore wind farms and solar farms, transports power to “a 30-km transmission line (T/L1) outfitted with a transformer (T1)” rated at 2300 V/100 kV.
The 30-km transmission line incorporates a single pi segment. “Connecting the converter station and inverter station via a 150-km transmission link (T/L2)” are 2 pi segment lines with 2 connections. The fault analysis is conducted on this 150-km HVDC transmission link.
2.1. Different Faults
- 1.
Positive-to-ground (PG)
- 2.
Negative-to-ground (NG)
- 3.
Short circuit fault between the negative and positive links (PN).
- 4.
Short circuit fault between the ground, the negative link, and the positive links (PNG).
When a fault occurs, large currents flow across the entire device, affecting the whole system.
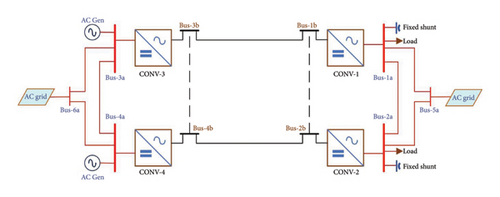
Figures 3, 4, 5, and 6 illustrate the total 4 faults, PG, NG, positive-to-negative (PN), and positive-negative-ground (PNG), respectively, that occur on HVDC power transmission links. Most benchmark models, such as the CIGRÉ HVDC benchmark system shown in Figure 7 [19], are designed for standard HVDC networks that rely on conventional power plants and may not accurately represent the unique characteristics, operational constraints, and fault behaviors of renewable energy-integrated HVDC transmission. Additionally, benchmark models often involve fixed parameters and predefined fault scenarios, limiting flexibility for analyzing new fault detection techniques such as the proposed TKEO-based method. Although having these limitations, the proposed method was tested on the benchmark simulation model to better reflect real-world challenges in modern HVDC transmission networks. The results are discussed in the Results and Discussion section.


Figures 8, 9, 10, and 11 show graphs for the PG, NG, PN, and PNG faults. The fault initiation time is between 0.5 and 0.6 s, while the run time is one second. As demonstrated in Figures 8, 9, 10, and 11, the magnitude of the current (Y-axis) with respect to time (X-axis) varies for all 4 kinds of faults at the same distance.
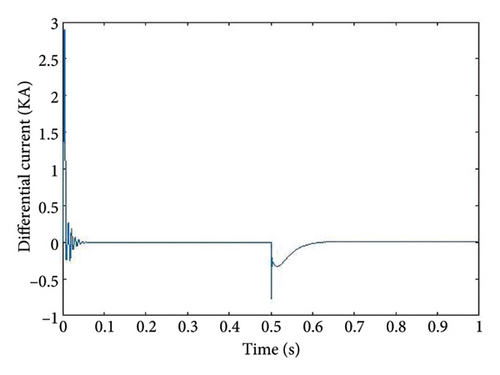
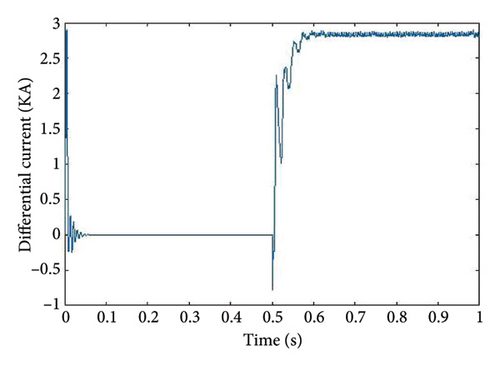
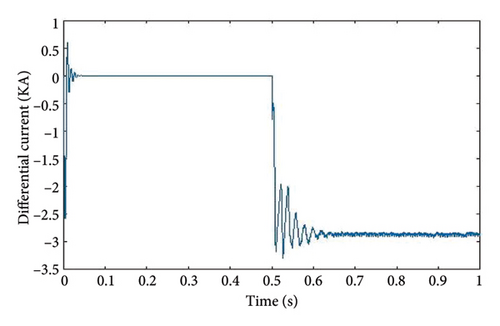
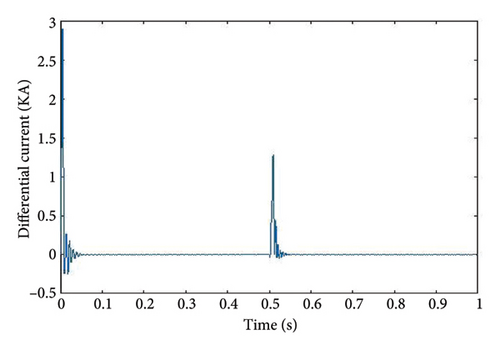
Figures 8, 9, 10, and 11 illustrate the correlation between time (t) on the X-axis and DC average current (Idiff) on the Y-axis, with a fault resistance of 0.01 Ω and fault location at 50 km.
These dynamic graphs demonstrate that for various faults transpiring at identical position (50 km), the magnitude of the plots fluctuates with respect to time. From 0 to 0.2 s, a transitory effect generates a transient disturbance in all graphs, and the graphs stabilize at 0.22 s. All 4 kinds of faults are generated for each kilometer, and the accompanying numerical data of respective fault current are saved. To simplify understanding, only one graph of each fault at the same 50-km location is provided. Graphs and numerical data are compiled for every kilometer for all four types of faults. These are consolidated into a unified graph representing each fault instance at the 50-km location for ease of understanding.
The proposed system’s stability is depicted in Figure 12. This graph depicts the continuous DC voltage waveform produced by individual wind turbines as a function of time and voltage. It also displays the stability of the intended system. The wind turbine has a voltage of about 1270 PU and a simulation run time of one second. The overall designed system voltage wave is not steady state from the start because of transient behavior at the start, which can last up to 0.3 s. After 0.3 s, the wave shape has virtually reached a steady state. Fault analysis can only be undertaken after the designed system has stabilized.

Figure 13 illustrates the three-phase voltage and current variations over time prior to connection to the rectifier. It also indicates that before the fault occurrence, “all three phases (R, Y, and B) remain stable”. Initially, due to transient effects, the waveform exhibits variability; for instance, the voltage waveform stabilizes from 0.15 s, whereas the current waveform stabilizes after 0.3 s. Prior to transmitting “the three-phase voltage and current waveforms to the rectifier circuit, it is essential to ensure their stabilization.”
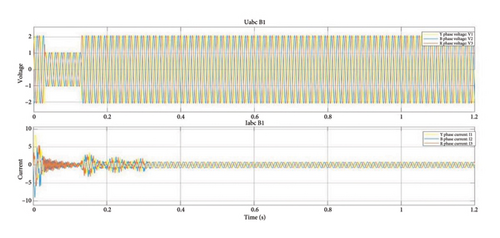
Figure 14 displays the 3-phase current against time and three-phase voltage versus time of a specified system after it has been connected to an inverter. It also demonstrates that “all three phases (R, Y, and B)” were stable previous to the fault. The waveform of the current reaches the stable state at 0.3 s, whereas the voltage waveform becomes stable at 0.1 s. Before transmitting the “three-phase voltage and current waveforms to the inverter circuit, confirm that they are stable.”
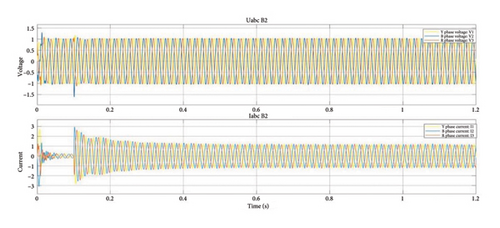
The proposed system’s “three-phase current against time and three-phase voltage vs time” are depicted in Figure 15 at the malfunctioning rectifier. It also confirms that at the time of the fault, “all three phases (R, Y, and B) are not stable.” The problem occurs on the HVDC transmission line between 0.5 and 0.6 s. The average current spikes could be visible for the duration of the defective time, which is at 0.8 s. Due to transient effects, the waveform initially lacks stability; specifically, the voltage waveform stabilizes after 0.15 s, while the current waveform achieves stability after 0.3 s.
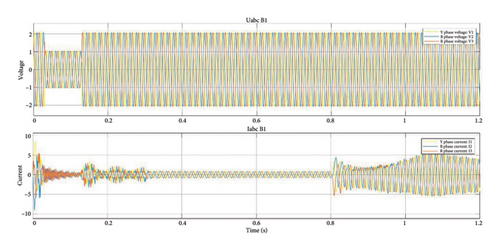
Figure 16 displays the proposed system’s three-phase current versus time and three-phase voltage vs time at the inverter at the abnormal state. It also confirms that “all three phases (R, Y, and B) were not stable” at the time of the failure. For the duration of the defective time, which at 0.8 s, the average current spikes can be noticed. Due to the transient effect, the waveform is not stable at first, i.e., the voltage becomes stable at 0.1 s, but the current waveform becomes steady at 0.25 s.

The AC currents and voltages of the proposed model’s three-phase stability under no-fault situations are shown in Figures 13 and 14. Figures 13 and 14 show the response of voltage and currents immediately before and after interfacing with the rectifier and inverter under normal conditions, and Figures 15 and 16 show the response of voltage and currents within the rectifier and inverter under the abnormal state. The current and voltage units represented in Figures 13, 14, 15, and 16 are in per unit. The transients are observed during the fault conditions. The voltage does not affect at a faulty condition, only current effects. That is the reason, at a transient condition, only voltage varies. Moreover, at a faulty condition, either average or differential current only gets effects.
2.2. Average and Differential Current Calculation
3. Methodology of the Proposed Technique
-
STEP 1: The proposed system requires just average current signals at the CIP, which is recorded by the CIFT.
-
STEP 2: To analyze nonlinear and nonstationary signals, the basic job is to extract “Teager Energy” from the average current signal.
-
STEP 3: From these average current signals, only three samples at the CIP and both sides of the CIP are used by the TKEO algorithm to produce the required “Teager Energy.”
-
STEP 4: Once Teager Energy is produced, the required indices (features) such as F1 (energy), F2 (amplified energy), F3 (mean), F4 (standard deviation), F5 (kurtosis), F6 (entropy), F7 (variance), and F8 (maximum amplitude) can be extracted.
-
STEP 5: Finally, a decision tree–based fault classifier is employed in the final step to allow the aforementioned 8 feature sets to pass through for fault identification and classification.
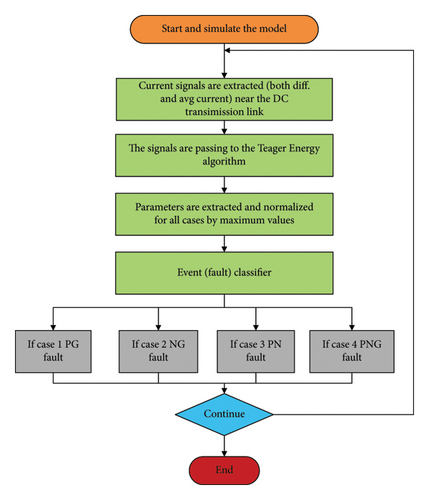
The overall working methodology of the proposed method is clearly presented in Figure 17 as a flow chart can be simply understood.
4. Key Indices Extraction
This paper introduces a novel optimization technique termed TKEO, aimed at mitigating the deficiencies outlined in the identified research gaps.
The key advantage of this algorithm lies in its ability to overcome the limitations of “existing methods, including the reduction of computational complexity and time needed” for fault classification identification. Notably, it eliminates the necessity for a signal processing unit, thereby streamlining the computational process without incurring additional time requirements. The TKEO method exhibits greater sensitivity to signal variations under examination. Hence, in this scenario, employing TKEO combined with a decision tree–based approach is preferred over alternative methods due to its enhanced resolution and reduced detection time for identifying problematic sites [3, 4].
The TKEO was employed to extract a range of metrics from nonlinear signals, including parameters such as “mean, energy, amplified energy, maximum amplitude, standard deviation, kurtosis, entropy, and variance.” In terms of fault classification accuracy, the suggested TKEO method beats other frequently used algorithms. The Teager Kaiser energy tracing operator was initially used in speech signal processing units but has recently shown promising results in nonstationary and nonlinear engineering applications. The TKEO is a simple, temporally localized method that correctly monitors the signal’s immediate amplitude and frequency and is easy to compute under appropriate signal conditions. The current state of available approaches for fault localization detection and fault categorization is insufficient. Furthermore, the time necessary to analyze raw current signal data for faulty analysis by “the signal processing unit required by those methodologies is longer.” The following steps describe the TKEO algorithm technique [3, 4]:
Consider a signal C(y) that comprises y samples and y = 1, 2 … n. Then,
Energy (F1): Consider a signal C(y) with current signal samples y = 1, 2, 3, …, n.
4.1. Decision Tree–Based Fault Event Classifier
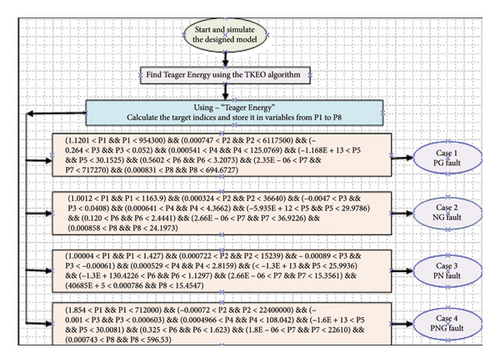
The HVDC transmission line model underwent simulation following its design phase. Equations (4) and (5) were employed to compute both the average current at the CIP. Eight performance indices were then derived utilizing the average current signals not differential current. Subsequently, these indices were channeled through an event classifier to discern the nature and location of the issue. The proposed methodology involves executing the eight aforementioned characteristics, as illustrated in the flow chart depicted in Figure 18. “In a VSC-based HVDC bipolar transmission system, a decision tree–based fault classifier” is utilized to promptly ascertain the fault type and its location. The decision-making process of the event classifier is clearly delineated in the decision tree diagram below (fault type) [20].
The flow chart in Figure 18 illustrates that the average current Iavrg is extracted and saved first. These raw signals are subjected to the TKEO algorithm, which yields 8 characteristics. The processed 8 features were put through an event classifier to determine the type of defect with location.
From Figure 19, the entire working mechanism of the proposed TKEO with CIFT can be understood clearly.
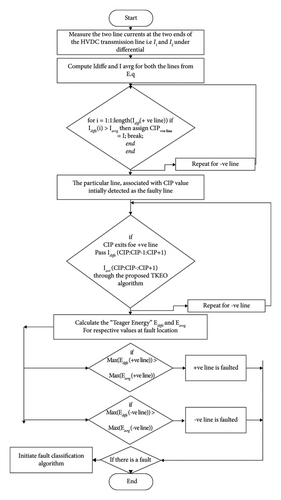
Initially, two line currents (I1 , I2) are measured at the two ends of HVDC transmission lines. Then, using equations (4) and (5), compute the differential and average currents (Idiffer , Iavrg), and if the (Idiffer > Iavrg), we can assign the CIP in the positive line. If it is less than the average current, return to the previous step. The line linked with the CIP value is originally considered defective. If (Idiffer > Iavrg) and Iavrg flows via the TKEO Algorithm, the Teager Energy (Ediffer, EAvrg) for respective fault locations is calculated. If not, return to the previous step. Then, if max(Ediffer(−ve line) > Eavrg(−ve line)), the fault is on the positive line.
The positive line DC current values (average current) should be stored in .mat files with matching variable names. Insert the associated mat file with an m-file and send to the precise numerical values from the mat file into a temporary variable, such as DC Diff Current 1 km. Run the DC Diff Current. The acronym CIF is being utilized. After executing CIF, send the CIF data to the “Teager Energy” execution. At this point, send the “Teager Energy” data to the CIFT. Then, execute the equations for all of the parameters and store the results as “maximum amplitude (F8), variance (F7), entropy (F6), kurtosis (F5), standard deviation (F4), mean (F3), amplified energy (F2), and energy (F1).” Repeat the preceding step to obtain the DC currents of the final parameters.
5. Results and Discussion
MATLAB Simulink is the software tool used in this study. The maximum simulation time of the system is one second. The following faults are created on an HVDC line: short-circuit fault between ground and negative pole (NG), PN fault, and PNG fault are all examples of PG faults. “The HVDC transmission link, a 150-km transmission line” made up of two pi sections, has all four types of faults. “The key indices, energy (F1), amplified energy (F2), mean (F3), standard deviation (F4), kurtosis (F5), entropy (F6), variance (F7), and maximum amplitude (F8)” are calculated using equations (11)–(18), respectively. Later, these indices are passed through the decision tree fault classifier for fault categorization.
Tables 1, 2, 3, and 4 demonstrate the maximum and minimum ranges of various parameters “such as energy (F1), amplified energy (F2), mean (F3), standard deviation (F4), kurtosis (F5), entropy (F6), variance (F7), and maximum amplitude (F8) under faulty conditions for all four fault types.”
| Fault | Indices | Highest value | Lowest value |
|---|---|---|---|
| PG | F1 | 954,300 | 1.1201 |
| F2 | 6,117,500 | 0.000747 | |
| F3 | 0.052 | −0.264 | |
| F4 | 125.0769 | 0.000541 | |
| F5 | 30.1525 | −1.168E + 13 | |
| F6 | 3.2073 | 0.5602 | |
| F7 | 717,270 | 2.35E − 06 | |
| F8 | 694.6727 | 0.000831 |
| Fault | Indices | Highest value | Lowest value |
|---|---|---|---|
| NG | F1 | 1163.9 | 1.0012 |
| F2 | 36,640 | 0.000324 | |
| F3 | 0.0408 | −0.0047 | |
| F4 | 4.3662 | 0.000641 | |
| F5 | 29.9786 | −5.935E + 12 | |
| F6 | 2.4441 | 0.120 | |
| F7 | 36.9226 | 2.66E − 06 | |
| F8 | 24.1973 | 0.000858 |
| Fault | Indices | Highest value | Lowest value |
|---|---|---|---|
| PN | F1 | 1.427 | 1.00004 |
| F2 | 15,239 | 0.000722 | |
| F3 | −0.00061 | −0.00089 | |
| F4 | 2.8159 | 0.000529 | |
| F5 | 29.9936 | −1.3E + 13 | |
| F6 | 1.1297 | 0.4226 | |
| F7 | 15.3561 | 2.66E − 06 | |
| F8 | 15.4547 | 0.000786 |
| Fault | Indices | Highest value | Lowest value |
|---|---|---|---|
| PNG | F1 | 712,000 | 1.854 |
| F2 | 22,400,000 | −0.00072 | |
| F3 | 0.000603 | −0.001 | |
| F4 | 108.042 | 0.0004966 | |
| F5 | 30.0081 | −1.6E + 13 | |
| F6 | 1.623 | 0.325 | |
| F7 | 22,610 | 1.8E − 06 | |
| F8 | 596.53 | 0.000743 |
Different and average numerical values of indices extracted for different locations from the average currents at various fault locations vary. Each index can have various numerical values at various fault locations. All these numerical index values are sorted out from minimum to maximum values, so the range can be identified and recorded for each index.
Tables 5, 6, 7, and 8 are a PG fault, an NG fault, a PN fault, and a PNG fault, respectively. For each 1 km of the whole 150-km HVDC link, 298 (149 × 2) datasets are calculated in each table. The fault datasets are tabulated utilizing two currents (differential and average currents) and 596 × 8 feature datasets each. For the system, a total of (596 × 8) × 2 feature datasets have been created. The characteristic data for the four faults at various random locations are provided in the tables below for simple understanding. In a bipolar HVDC system, the positive and negative poles carry currents in opposite directions, with the ground serving as a reference point. When a PG fault occurs, the positive pole is shorted to ground, causing a rapid drop in its current. To maintain balance, the system redistributes the current, often leading to a surge in the negative pole’s current in the opposite direction, which appears as a negative current spike. Similarly, when an NG fault occurs, the negative pole is shorted to ground, leading to a sudden drop in its current, while the positive pole compensates by momentarily increasing its current, causing a positive rise in the observed current [22]. Additionally, the system control mechanisms and converter responses contribute to these current variations. In PG faults, the VSC attempts to stabilize the system by adjusting the current flow, which can result in an inversion of the current direction in the negative pole. In NG faults, the loss of current in the negative pole leads to a temporary rise in the positive pole current as the system reacts to the fault. Moreover, charge redistribution effects, transient responses, and the characteristics of the transmission line influence these current behaviors. In HVDC systems, a PN fault refers to a direct short circuit between the positive and negative poles without any ground involvement, resulting in high fault currents limited only by line impedance and typically creating symmetrical disturbances in both poles. In contrast, a PNG fault is more severe and involves a simultaneous short circuit between the positive, negative poles, and ground, leading to complex current paths through all three terminals. The involvement of ground in PNG faults causes larger, more chaotic current surges and poses a greater risk to system stability, as it can trigger both pole and ground protection mechanisms [21].
| Fault location (km) | Maximum amplitude | Entropy | Standard deviation | Amplified energy | Variance | Kurtosis | Mean | Energy |
|---|---|---|---|---|---|---|---|---|
| 12 | 40.8412 | 3.5409 | 7.4794 | 2.05E + 05 | 57.5671 | 29.1338 | −0.0024 | 3.41E + 03 |
| 25 | 0.7181 | 3.064 | 0.2561 | 85.2716 | 0.1969 | −210.8837 | −0.0035 | 5.0012 |
| 33 | 36.4437 | 2.1805 | 7.5326 | 2.53E + 04 | 506.3855 | 24.1123 | 0.015 | 3.46E + 04 |
| 42 | 7.8241 | 3.1662 | 1.9456 | 2.68E + 03 | 19.9722 | 29.2977 | 0.0012 | 231.9128 |
| 55 | 37.638 | 2.7561 | 6.3467 | 2.09E + 04 | 290.7807 | 26.4127 | −0.0059 | 2.46E + 03 |
| 66 | 0.405 | 2.2179 | 0.1923 | 8.1777 | 1.7665 | −698.6823 | −0.0151 | 3.27 |
| 78 | 0.22 | 2.3892 | 0.129 | 3.922 | 0.7656 | −3.59E + 03 | −0.006 | 2.017 |
| 89 | 23.8574 | 2.5731 | 5.74 | 3.01E + 04 | 167.0462 | 15.663 | 0.0104 | 2.01E + 03 |
| 95 | 19.7083 | 2.7239 | 3.2566 | 6.92E + 03 | 67.57 | 25.1261 | −0.0111 | 647.9243 |
| 106 | 13.1575 | 3.4689 | 2.9091 | 1.17E + 04 | 22.8836 | 29.2724 | −0.0024 | 517.2334 |
| 115 | 0.9859 | 2.7064 | 0.2544 | 61.0593 | 0.2908 | −226.4066 | −0.0051 | 4.9508 |
| 125 | 242.7519 | 2.6439 | 53.71 | 3.43E + 06 | 9.25E + 03 | 17.6731 | −0.0047 | 1.76E + 05 |
| 133 | 21.2988 | 3.855 | 3.703 | 1.88E + 04 | 37.1879 | 28.1961 | 0.0036 | 87.43 |
| 140 | 70.9667 | 3.5714 | 12.8702 | 2.36E + 05 | 485.1961 | 23.0344 | −0.0134 | 1.01E + 04 |
| 148 | 281.6447 | 2.3145 | 46.3272 | 3.85E + 06 | 4.45E+03 | 30.6484 | −3.32E − 04 | 1.31E + 05 |
| Fault location (km) | Maximum amplitude | Entropy | Standard deviation | Amplified energy | Variance | Kurtosis | Mean | Energy |
|---|---|---|---|---|---|---|---|---|
| 12 | 0.5006 | 0.6383 | 0.075 | 4.7321 | 0.025 | −3.15E + 04 | 3.15E − 04 | 1.3434 |
| 25 | 0.0124 | 0.7938 | 0.004 | 0.038 | 5.94E − 05 | −4.02E + 09 | −0.0011 | 1.001 |
| 33 | 0.0016 | 0 | 0.0021 | 0.0171 | 1.03E − 05 | −5.07E + 10 | −8.20E − 04 | 1.0003 |
| 42 | 4.36E − 04 | 0 | 8.39E − 04 | 0.036 | 1.28E − 06 | −2.02E + 12 | −5.92E − 04 | 1.0001 |
| 55 | 0.0036 | 0.6744 | 0.0014 | 0.0068 | 1.11E − 05 | −2.98E + 11 | 7.11E − 04 | 1.0001 |
| 66 | 0.0039 | 0.988 | 0.0016 | 0.0122 | 2.91E − 05 | −1.44E + 11 | 0.0013 | 1.0003 |
| 78 | 0.0045 | 0.9932 | 0.0019 | 0.0145 | 4.40E − 05 | −8.02E + 10 | 0.0017 | 1.0004 |
| 89 | 0.0041 | 0.9383 | 0.0015 | 0.0095 | 1.99E − 05 | −2.03E + 11 | 0.0011 | 1.0002 |
| 95 | 0.0045 | 0.988 | 0.0019 | 0.0157 | 4.39E − 05 | −6.96E + 10 | 0.0016 | 1.0004 |
| 106 | 0.0021 | 0.2056 | 8.37E − 04 | 0.0017 | 3.60E − 06 | −2.04E + 12 | 1.87E − 04 | 1.0003 |
| 115 | 0.0024 | 0.2056 | 0.0025 | 0.0225 | 1.45E − 05 | −2.54E + 10 | −9.00E − 04 | 1.0004 |
| 125 | 0.0115 | 0.806 | 0.004 | 0.0385 | 4.19E − 05 | −3.87E + 09 | −0.0012 | 1.0011 |
| 133 | 0.4343 | 0.5216 | 0.0608 | 5.4325 | 0.0094 | −7.30E + 04 | 2.62E − 04 | 1.0045 |
| 140 | 0.0188 | 2.0025 | 0.0096 | 0.1758 | 5.73E − 04 | −1.19E + 08 | 0.0012 | 1.0057 |
| 148 | 0.0022 | 0.5086 | 6.82E − 04 | 0.0039 | 4.63E − 06 | −4.63E + 12 | 0.001 | 1.0001 |
| Fault location (km) | Maximum amplitude | Entropy | Standard deviation | Amplified energy | Variance | Kurtosis | Mean | Energy |
|---|---|---|---|---|---|---|---|---|
| 12 | 38.28735 | 4.067498 | 6.385151 | 6.04E + 04 | 1.03E+02 | 27.5531 | −0.0039 | 2.49E + 03 |
| 25 | 1.986597 | 3.186776 | 0.503244 | 2.96E + 02 | 0.824335 | −2.43625 | −0.00379 | 16.4494 |
| 33 | 0.319547 | 2.602752 | 0.096749 | 9.345757 | 0.039491 | −1.14E + 04 | −0.00189 | 1.571199 |
| 42 | 0.8646 | 2.7117 | 0.3363 | 72.396 | 0.7692 | −65.9373 | −0.0072 | 7.9033 |
| 55 | 0.4474 | 2.5629 | 0.1381 | 9.1332 | 0.3537 | −2.74E + 03 | 0.0087 | 2.1672 |
| 66 | 274.9563 | 2.0618 | 98.094 | 1.31E + 06 | 4.36E + 05 | 29.4481 | −15.8629 | 6.03E + 05 |
| 78 | 0.1846 | 2.0647 | 0.0505 | 2.2195 | 0.0254 | −1.54E + 05 | 0.004 | 1.1567 |
| 89 | 0.567 | 2.2046 | 10.0734 | 6.51E + 03 | 6.03E + 03 | 56.6048 | −1.523 | 6.33E + 03 |
| 95 | 18.578 | 2.6175 | 4.4147 | 4.00E + 03 | 411.9288 | 25.6337 | −0.0586 | 1.19E + 03 |
| 106 | 0.3987 | 2.6117 | 0.1351 | 14.0537 | 0.1151 | −2.99E + 03 | −7.88E − 04 | 2.1135 |
| 115 | 0.9339 | 2.9223 | 0.2931 | 71.8595 | 0.4302 | −127.101 | −0.0063 | 6.2431 |
| 125 | 5.4963 | 3.0351 | 1.5553 | 2.73E + 03 | 8.1417 | 14.2053 | −0.0059 | 148.5652 |
| 133 | 30.876 | 2.578 | 5.0686 | 3.80E + 04 | 65.1981 | 24.8824 | 5.82E − 04 | 1.57E + 03 |
| 140 | 54.1789 | 3.5856 | 0.7586 | 1.59E + 05 | 230.8843 | 22.6408 | 0.0077 | 5.94E + 03 |
| 148 | 1.42E + 04 | 3.9535 | 2.58E + 03 | 1.19E + 10 | 1.37E + 07 | 30.0081 | −0.0116 | 4.05E + 08 |
| Fault location (km) | Maximum amplitude | Entropy | Standard deviation | Amplified energy | Variance | Kurtosis | Mean | Energy |
|---|---|---|---|---|---|---|---|---|
| 12 | 9.3311 | 3.8756 | 2.5811 | 9.33E + 03 | 18.404 | 16.5023 | −0.0029 | 4.07E + 02 |
| 25 | 8.88E + 01 | 2.53E + 00 | 2.11E + 01 | 6.12E + 05 | 1.20E + 03 | 3.11E + 01 | −1.10E − 03 | 2.71E + 04 |
| 33 | 0.3648 | 1.3942 | 0.1141 | 12.9128 | 0.0491 | −5850 | −0.0025 | 1.7952 |
| 42 | 1.8329 | 1.5599 | 0.366 | 29.4427 | 2.3219 | −25.1975 | −0.0027 | 9.1704 |
| 55 | 0.0199 | 0.8965 | 0.0058 | 0.0351 | 0.000181 | −9E + 08 | −0.0011 | 1.0021 |
| 66 | 0.0788 | 1.3297 | 0.0112 | 0.0206 | 0.0063 | −6.3E − 07 | 0.0024 | 1.008 |
| 78 | 0.7628 | 2.0367 | 0.1988 | 41.4719 | 0.1403 | −603.803 | −0.00026 | 3.4103 |
| 89 | 0.8344 | 1.1656 | 0.1196 | 27.8725 | 0.0274 | −4841 | 0.000674 | 1.8732 |
| 95 | 0.451 | 0.5216 | 0.0644 | 8.3619 | 0.0077 | −58110 | 0.000532 | 1.253 |
| 106 | 0.474 | 0.7889 | 0.0739 | 11.2159 | 0.0099 | −33530 | 0.0013 | 1.3331 |
| 115 | 0.7268 | 0.9847 | 0.1189 | 27.925 | 0.0267 | −4974 | 0.0015 | 1.8623 |
| 125 | 0.5232 | 0.8076 | 0.0979 | 25.8635 | 0.0144 | −10800 | 0.000324 | 1.5846 |
| 133 | 1.2165 | 0.9092 | 0.1988 | 30.153 | 0.2273 | −611.382 | −0.0013 | 3.4111 |
| 140 | 140 | 0.4405 | 1.0687 | 0.0921 | 14.938 | 0.0207 | −14000 | −0.0016 |
| 148 | 0.0289 | 0.6965 | 0.0064 | 0.0123 | 0.0012 | −6E + 08 | −0.00048 | 1.0025 |
Tables 5, 6, 7, and 8 provide comprehensive ranges of values across various distances for different types of features, enabling accurate fault classification and localization. To enhance comprehension of the proposed methodology, specific examples of distances along with their corresponding values for all eight characteristics (from F1 to F8) are furnished. Because distinct attributes have varying values, fault categorization and location may be appropriately determined. Each distinct feature possesses its own numerical value, ensuring that there is no overlap with another, thereby enhancing the precision of fault location determination.
In Tables 5, 6, and 7, all the same location index data are taken for the same fault locations for simple understanding, but in the table, the same locations were not taken which is a typo error. In Table 8 also, data will be replaced with the same fault location index data similar to Tables 5, 6, and 7. Table 8 data are changed with the same distance as the other Tables 5, 6, and 7 fault location.
Every fault location has a different fault current at different locations on HVDC transmission lines. The eight indices extracted from the respective average current of HVDC transmission lines vary. So at different locations, the extracted indices were sent through the decision-making tree algorithm, so based on the different index values the different fault locations can be identified accurately.
5.1. Performance Assessment of the Proposed Method
| Sl. no. | Type of abnormal condition | Total data group taken randomly | Set of samples taken randomly for the testing purpose | Efficiency of fault detection (%) |
|---|---|---|---|---|
| 1 | PG | 149 × 2 = 298 | For testing purposes, 476 random sample datasets (40% of the total) were selected from the pool of 1192 | 97% |
| 2 | PN | 149 × 2 = 298 | ||
| 3 | NG | 149 × 2 = 298 | ||
| 4 | PNG | 149 × 2 = 298 | ||
| Total datasets | 298 × 4 = 1192 | |||
The total number of “fault samples of just average current (Iavrg) is 298 × 4 = 1192, of which 60% (715) are taught for system training purposes and the remaining 40% (477) are tested to determine the efficiency and accuracy of the faulty type and its exact position.” The remaining 1192 differential samples were not considered for convenience of analysis. 1192 + 1192 = 2384 is the total sample difference and average.
-
Step I: Allocate C = 0 if the sample length for the test is D and the number of successfully identified data groups is C.
-
Step II: A random number (y) and an initial estimate should be generated; if y falls between data group 1 and 298, the abnormal condition is PG, and the m set should be assigned to 1. “If y is between 299 and 596, the abnormal condition and m is assigned to 2.” Otherwise, if y is between 597 and 894, the abnormal condition is NG and the value of m is assigned to 3. Otherwise, if y is between 895 and 1192, the abnormal condition is PNG and m is assigned to 4.
-
Step III: The datasets ([F1, F2,…, F8] ∗ 8) concerning as ‘y’ row, from the original dataset which are allowed to pass “through the decision tree–based fault classifier to create n, the algorithm works according to the following rules for the finalization of fault classification.”
-
If the program finds a short circuit for a PG fault, assign n to 1.
-
Alternatively, “n is assigned to 2 if the software identifies a short circuit disturbance between the negative pole and the positive pole (PN).”
-
Alternatively, if the algorithm detects an abnormal condition between ground and Ne NG fault, n is assigned a value of 3.
-
If none of the aforementioned conditions are satisfied, n is assigned to 4 when the program identifies a short-circuit disturbance between grounds, the negative pole, and the positive pole (PNG).
-
-
Step IV: If m = n, then C = C + 1.
-
Step V: To determine the efficiency by using the following formula, efficiency (η %) = [(C/D) 100]. The proposed method’s efficiency is compared to existing approaches to confirm that it provides improved protection efficiency, as tabulated in Table 10.
- 1.
A method based on the wavelet transform and Park theory (M1) [15]:
| Sl. no. | Abnormal condition | Resistance at abnormal condition (in ohms) | Tripping time of the relay (milliseconds) | Operating mode of the wind energy source |
|---|---|---|---|---|
| 1 | PG | 0.1 | 10.61 | All wind energy sources are switched ON |
| PN | 0.1 | 11.12 | ||
| NG | 0.1 | 10.37 | ||
| PNG | 0.1 | 12.22 | ||
| 2 | PG | 0.2 | 10.33 | All wind energy sources are switched ON |
| PN | 0.2 | 10.12 | ||
| NG | 0.2 | 10.12 | ||
| PNG | 0.2 | 10.17 | ||
| 3 | PG | 0.5 | 11.21 | All wind energy sources are switched ON |
| PN | 0.5 | 12.68 | ||
| NG | 0.5 | 11.56 | ||
| PNG | 0.5 | 10.21 | ||
| 4 | PG | 1 | 10.25 | All wind energy sources are switched ON |
| PN | 1 | 11.1 | ||
| NG | 1 | 09.81 | ||
| PNG | 1 | 09.85 | ||
- 2.
The technique founded on morphological mathematics (M2) [16]:
- 3.
The correlation concept-driven methodology (M3) [17]:
- 4.
The approach based on reactive power (M4) [20]:
The data in Tables 10 and 11 clearly illustrate the efficiency of the proposed approach in fault identification. On the other hand, alternative methods show deficiencies in different scenarios when utilizing the specified set of 8 indices. The proposed method is compared with 4 methods which are being used currently to assess its performance. Furthermore, the proposed approach exhibits a mean time delay of approximately 12 milliseconds, a feat that the other methods are unable to achieve. Moreover, in a comparison with the alternative examined approaches, the proposed method showcases a notably lower computational complexity under load. It is crucial to highlight that the computational burden is reduced since only two samples are analyzed to generate the 8 indices. The effectiveness of the proposed eight indices—energy, amplified energy, mean, standard deviation, kurtosis, entropy, variance, and maximum amplitude—stems from their ability to extract key fault characteristics using the TKEO method. By relying solely on three samples (before, at, and after the fault point), the approach minimizes computational complexity and reduces fault detection time to 12 milliseconds, outperforming traditional methods. The indices effectively distinguish different fault types (PG, NG, PN, and PNG) and achieve a 97% accuracy rate when processed through a decision tree–based classifier. However, alternative classification models such as SVM or deep learning could further enhance performance, and exploring additional statistical or frequency-domain features might improve fault detection and classification accuracy beyond the current indices. The efficiency of the proposed method using the novel TKEO with a decision tree–based classifier tested on the CIGRÉ HVDC system integrated with renewable energy sources is 91.5% for fault detection and classification, considering 1000 test datasets of prefault and postfault conditions. This accuracy was achieved using only average current samples and analyzing just three points (before, at, and after the CIP), resulting in a satisfactory fault detection system due to the limitations, making it suitable for real-time protection applications in HVDC systems.
| Factor | Method (conventional) | Proposed technique | |||
|---|---|---|---|---|---|
| M1 | M2 | M3 | M4 | ||
| Preciseness % | 64.3 | 70 | 82.3 | 74.3 | 97 |
| Average required time for operation (in ms) | 18 | 23 | 24 | 15 | 12 |
| Operating robustness | Low | Low | Low | Low | High |
| Computing complexity | Yes | Yes | Yes | Yes | No |
6. Conclusion
This paper explores the identification and categorization, pinpointing of faults in a VSC-based HVDC transmission network. In the event of a fault in an HVDC line, a novel approach called TKEO interfaced with a decision tree classifier is employed to analyze various abnormal conditions. The “Teager Energy” is derived from average current samples. The traced “Teager Energy” is then utilized to generate the desired set of eight indices. A decision tree based on an 8-feature dataset is employed for fault classification. Additionally, a thorough examination of four types of abnormal conditions is conducted on a typical DFIG wind farm-based HVDC transmission link. The results section illustrates a significant improvement in fault detection efficiency, reaching 97%. Notably, the computational cost is markedly reduced as only three samples are assessed for fault analysis (at the CIP and one each before and after the CIP). The detection time is notably quick, taking only 12 s, and decreases the computing burden, in contrast to conventional methods because just three samples are enough for analysis. The proposed method accomplishes quick fault diagnosis and classification while maintaining a high level of accuracy. The simulation and results section confirms the satisfactory findings, showcasing the broad applicability of the suggested technique, which proves beneficial for power system equipment protection.
Conflicts of Interest
The authors declare no conflicts of interest.
Funding
No funding was received for this manuscript.
Open Research
Data Availability Statement
The data that support the findings of this study are available on request from the corresponding author. The data are not publicly available due to privacy or ethical restrictions.


