An Integrated Approach for Multiarea Reliability Improvement With Risk-Based Contingency Analysis and Optimal Load Curtailment
Abstract
Line failures, particularly in the form of N-1 contingencies, are a significant cause of interruptions in power grids, negatively affecting system reliability. Effective risk-based contingency analysis (RBCA) is essential in modern power systems to address increasing uncertainties and complexities. This paper proposes an RBCA framework that calculates the probabilistic risk index (RI) based on transmission line severity functions for single- and multiarea bulk power systems. The approach identifies critical transmission lines and least reliable buses, enabling utilization of load curtailment strategies. Meta-heuristic techniques, particle swarm optimization (PSO), and gray wolf optimization (GWO), are employed for optimal load curtailment, achieving approximately 30% reduction in curtailed load compared to the analytical proportional load curtailment approach. The methods chosen for their robustness and ability to balance exploration and exploitation in various optimization problems provide practical insights for system operators to enhance reliability under diverse operating conditions. Furthermore, the study examines the impact of flexible thermal rating (FTR) on multiarea systems considering variations in weather conditions, and a comparison is drawn with the static thermal rating (STR) system. Key reliability indices, including EENS, EDNS, BPECI, MBPCI, and EIC, are determined and analyzed for the proposed study. The proposed approach benefits system operators in preventing outages and formulating contingency action plans and emphasizes the study’s contribution to ensuring a stable and reliable power supply which is critical for modern societal needs. The proposed approach has been tested and validated on IEEE 24 reliability test system (RTS).
1. Introduction
1.1. Motivation
In the case of a system-wide emergency, the goal of the system operators is to maintain a stable power supply. Transmission line outages, the most frequent type of power system disturbance, can significantly affect system reliability. The N − 1 criterion stipulates that the power system must be planned and managed in such a way that it can continue to supply all loads in the case of the failure of a single component [1]. Practical case studies, such as the 2012 Northern Grid Failure in India, highlight the severe consequences of insufficient contingency planning and load management in interconnected power systems. This failure was primarily due to overloading and the inability to manage contingencies across the interconnected grid, stressing the critical importance of risk-based contingency analysis (RBCA) and optimal load curtailment (LC) strategies to prevent such large-scale failures [2]. The event highlights the need for improved reliability measures in multiarea power systems and demonstrates the relevance of the study, particularly in the context of identifying critical lines and buses for developing a suitable action plan of such contingencies. System operators are required to perform LC in the event of a critical power supply imbalance that risks system security. These events can have a wide range of effects on a bulk power system, from relatively small disruptions to potentially catastrophic consequences. As a result, evaluating reliability costs becomes a critical component in the study of bulk power systems. This highlights the need to determine the level of disturbances and disruptions experienced by consumers connected to load points. Reliability cost analysis is a critical tool for understanding the effects of LC policies, emphasizing the importance of effective risk mitigation and management approaches to ensure the power system’s overall reliability [3, 4]. Risk analysis, particularly in power systems, is critical for identifying vulnerabilities and minimizing potential disturbances. This approach identifies important lines and buses based on their susceptibility to failure under N − 1 scenarios. These essential components are crucial sites of vulnerability in the electrical grid, with failure of a single component possibly leading to cascading failures or system-wide disruptions. By identifying these critical lines and buses, system operators and planners can prioritize preventive maintenance, implement upgrades, and develop contingency plans to improve the overall reliability of the power system, ensuring an uninterrupted supply of electricity to consumers [5].
Additionally, the role of flexible thermal rating (FTR) (or dynamic thermal rating [DTR]) in reliability assessment is vital for providing a more accurate representation of transmission line capacities under varying operating conditions. Unlike standard static ratings, which rely on conservative assumptions and fixed environmental conditions, FTR takes into consideration dynamic elements including ambient temperature, wind speed, and line loading patterns. FTR improves grid reliability and security by dynamically altering transmission line capacity in real time. This facilitates system operators to optimize power flows and mitigate congestion in the power system [6, 7]. In contemporary power systems, multiarea analysis is of paramount importance from a reliability point of view, particularly for tie lines that function as critical linkages between interconnected regions. Tie lines enable the transfer of power between regions, improving system stability and resource sharing. However, they also offer a risk since disturbances or failures in tie lines can spread across adjacent areas, resulting in cascading outages and system-wide disruptions. Multiarea reliability evaluations allow operators to optimize tie line operations, prioritize maintenance efforts, develop and implement effective contingency plans to reduce the risk of outages, and provide a reliable supply throughout interconnected regions [8].
1.2. Literature Review
Over the years, contingency-based bulk power system reliability has been evaluated by researchers around the globe. In [9], authors use sequential simulation to investigate the implications of various load-shedding strategies on the reliability of bulk electric systems. It analyses three unique LC methodologies and assesses delivery point reliability indices obtained using the sequential strategy, providing useful insights for anticipating future system reliability. In [10], the proportional load-shedding method is proposed for real and reactive power balance considering voltage violations on the system. This approach entails lowering the load on individual buses in proportion to their percentage of the total system load. Priority load shedding and reliability cost/worth-based load-shedding approaches are used to reduce actual power load based on customers’ willingness to pay for increased reliability to analyze reliability cost indices. In [11], the authors investigate generation redispatch and cost-based load-shedding techniques used in real-time market and system operation to efficiently handle emergencies considering the reliability perspective. Reliability criteria are implicitly addressed by incorporating the cost of customer interruptions by calculating various reliability indices. In [12], the study proposes a regression approach based on convolutional neural networks (CNNs) to predict the minimal LCs of sampled states without explicitly solving the optimal power flow (OPF), except during the training phase. The minimal LCs are then used to measure power and energy indices, such as predicted demand not met, as well as the frequency and probability indices. The authors in [13] present a fast approach for computing optimal load shedding by leveraging shadow pricing, hence avoiding the time-consuming process of using OPF algorithms. In [14], the authors proposed a load-shedding program to minimize the value of loss of load using linear programming for contingency states that lead to LC, and furthermore, in [15–17], enhancement of power system reliability is proposed using particle swarm optimization (PSO) in the context of minimization of LC. In [18], the authors proposed a heuristic local load-shedding scheme to conduct a generation adjustment and LC considering different operating conditions.
Nowadays, the concept of FTR is extensively utilized for the enhancement of reliability on power system networks. To optimize the operation of transmission lines, the study in [19] proposes a risk-based paradigm for line management that takes into account conductor tensile strength concerns, probabilistic weather forecasts, and line failure probability. In [20, 21], the authors proposed the impact of DTR for investigating the uncertainties of the failure parameters of transmission lines. Evaluating the impact of DTR on reliability performance, the failure model uses statistical approaches based on historical failure data for formulating probability distribution functions through the Arrhenius model.
Most electric power utilities function as members of an integrated power system due to the benefits of coordinated operation and planning. Therefore, multiarea system reliability assessment has garnered focus recently. In [8, 22], the authors investigate alternative strategies for assessing multiarea system reliability by capturing the chronological dynamics of load profiles. The proposed approach assesses the usefulness and precision of various methods in effectively predicting frequency and duration (F&D) indices while considering each area’s unique load curves. Additionally, multiarea reliability concepts are incorporated while assessing the capability of the Brazilian power system to fulfill peak load demands. In [5], the research presents power flow–based models for assessing several elements of line capacity in multiarea power systems, including reliability, vulnerability, and contingency assessments. The authors in [23, 24] discussed the multiarea AC SCUC model using variable replication and decoupling–factorization–substitution method, and furthermore, the concept of capacity benefit margin approach is presented for large multiarea power systems to provide external generation to deficit areas. In [25], the authors proposed a multiarea reliability evaluation that incorporates Markov Chain Monte Carlo (MCMC) with optimal importance sampling, taking into account the correlation between loads and variable sources. In [26], a risk-based security assessment approach is proposed that considers spatiotemporal interdependence when evaluating the risk of transmission line overloading on interzonal power systems. This is performed by utilizing vine copula to address and represent the complex relationships inherent in the spatial and temporal elements of the transmission system.
1.3. Novelty and Contributions
According to the above literature review, a comparison is performed and shown in Table 1 between existing studies and proposed approach based on various aspects such as—multiarea consideration, load uncertainty, reliability studies, FTR consideration, and risk analysis. In the context of modern power systems, the comparison shown in Table 1 emphasizes the significance of a risk-based method for multiarea reliability analysis. This assessment considers load uncertainty and includes FTR—a feature evidently lacking in previous studies. Moreover, security assessment of associated tie lines between areas is not discussed in depth, which is significant for power system operation and planning, establishing the perception of uncertainties such as line outages, and taking appropriate control action to meet load demand reliably. The risk-based reliability analysis emphasizes the dynamic and linked nature of modern power networks, where uncertainties in load demand and operational conditions are prevalent. Incorporating load uncertainty compensates for unpredictability in demand patterns, allowing operators to make informed decisions and anticipate changes in system behavior. Furthermore, incorporating FTR enables real-time adjustments to transmission line capacities based on environmental and operational conditions, improving grid efficiency and reducing congestion threats.
| Reference | Risk analysis | Multiarea consideration | Load uncertainty | Reliability indices | FTR |
|---|---|---|---|---|---|
| [9] | ✗ | ✗ | ✗ | ✓ | ✗ |
| [10] | ✗ | ✗ | ✗ | ✓ | ✗ |
| [11] | ✗ | ✗ | ✗ | ✓ | ✗ |
| [12] | ✗ | ✗ | ✓ | ✓ | ✗ |
| [13] | ✗ | ✗ | ✓ | ✓ | ✗ |
| [14] | ✗ | ✗ | ✗ | ✓ | ✗ |
| [15] | ✗ | ✗ | ✓ | ✓ | ✗ |
| [19] | ✓ | ✗ | ✓ | ✗ | ✓ |
| [20, 21] | ✗ | ✗ | ✓ | ✓ | ✓ |
| [8, 22] | ✗ | ✓ | ✓ | ✗ | ✗ |
| [5] | ✓ | ✓ | ✓ | ✓ | ✗ |
| [23] | ✗ | ✓ | ✗ | ✗ | ✗ |
| [24] | ✗ | ✓ | ✓ | ✓ | ✗ |
| [25] | ✗ | ✓ | ✓ | ✓ | ✗ |
| [26] | ✓ | ✓ | ✓ | ✗ | ✗ |
| Proposed approach | ✓ | ✓ | ✓ | ✓ | ✓ |
- i.
A RBCA is proposed to assess the criticality of line failures on single- and multiarea bulk power system focusing on the N − 1 contingency level. Furthermore, based on RBCA, candidate load buses are selected, and LC is performed using a proportional LC—an analytical approach.
- ii.
Critical transmission lines are identified by calculating probabilistic risk index (RI) based on severity functions developed for each contingent line considering uncertain load demand.
- iii.
Reliability cost is evaluated for single- and multiarea bulk power systems based on an analytical approach for consumers or load buses by calculating reliability indices—expected energy not supplied (EENS), expected demand not served (EDNS), bulk power/energy curtailment index (BPECI), modified bulk power curtailment index (MBPCI), and expected interruption cost (EIC).
- iv.
Optimization of LC is performed to overcome the limitations of the analytical approach using meta-heuristic techniques—PSO and GWO. A comparative analysis is also carried out between analytical approach and proposed meta-heuristic techniques based on reliability indices.
- v.
Reliability improvement is proposed at each single-line outage for multiarea systems by implementing the concept of FTR, and a comparison is discussed between the existing STR system and FTR system.
1.4. Paper Organization
The following sections comprise the paper. The RBCA for bulk power system with the concept of FTR on the multiarea system is discussed in Section 2. The analytical approach for solving LC for the assessment of reliability cost is described in Section 3. Sections 4 and 5 emphasize the use of PSO and GWO to minimize LC. The proposed methodology is tested on IEEE 24 RTS, and results are illustrated in Section 6. Section 7 highlights the paper’s conclusion.
2. RBCA for Bulk Power System
2.1. Selection of Candidate Load Buses for LC
On the basis of OIm calculated using (1), operating state available line m is categorized in Table 2 and shown as follows where Sm is power flow in line m and is the MVA limit of line m.
| Range | Category |
|---|---|
| OI < ρ | Normal (N) |
| ρ ≤ OI < 1 | Alert (A) |
| OI ≥ 1 | Insecure (I) |
A generalized severity function of each contingent line is shown in Figure 1, indicating the three operating states as normal (N), alert (A), and insecure (I) based on the severity of the contingency.
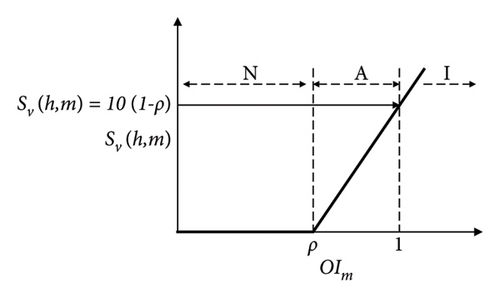
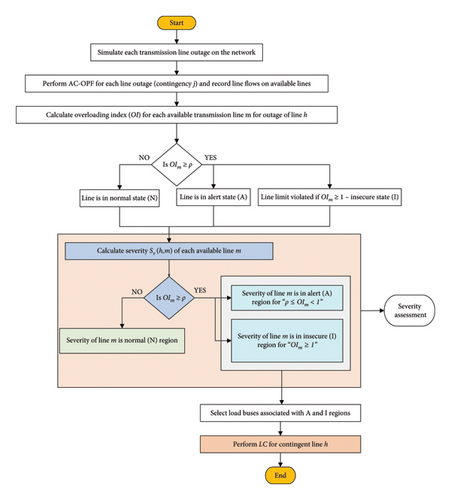
Based on the severity function obtained for each contingent line, available lines falling in the category of (A) and (I) regions are selected. Based on the selected lines, LC is performed at the load buses associated with it. Flowchart for selection of candidate load buses for LC is shown in Figure 2.
2.2. Computation of RI
RIh obtained is normalized and classified based on Table 3 as follows.
| Range | Category |
|---|---|
| RIh ≥ ηU | High Risk(HR) |
| ηL ≤ RIh < ηU | Medium Risk(MR) |
| RIh < ηL | Low Risk(LR) |
The quantitative information obtained in Table 3 gives the impact of critical lines on the system. On the basis of the simulation results obtained for the test system, the upper and lower limits for classification in RBCA are taken into consideration [29].
2.3. Modeling of Load Uncertainty
2.4. FTR Model of the Multiarea System
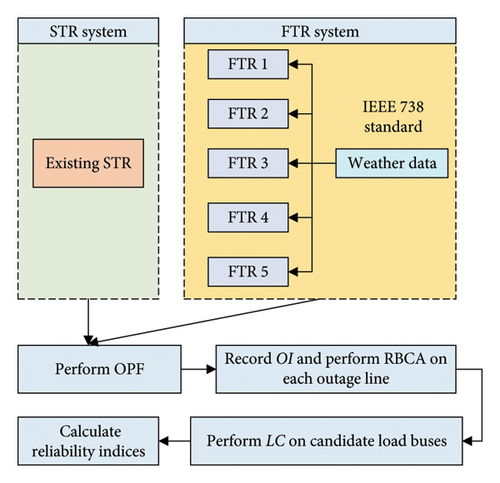
Traditionally, the STR system has been preferred due to its simplicity and uncomplicated use. This rating is established by examining both the physical characteristics of the conductors and the historical weather data of the area where the conductors are located. The static ratings are then determined using a set of cautious weather conditions with a low risk of surpassing the conductor’s previous ratings. The implementation of STR understates the entire potential of line capacity since it is computed using relatively conservative meteorological assumptions, such as low wind speed, full solar radiation, and high ambient temperature. However, actual weather conditions are frequently favorable, allowing conductors to undergo more cooling than anticipated. Moreover, because typical weather conditions are not as bad as most weather assumptions, the STR system tends to underestimate most of the line’s available transfer capacity [6, 7, 19, 20]. In power system networks, this problem can be addressed by increasing flexibility on power transfer capability of transmission lines. The FTR system is employed to overcome the limitations encountered by the STR system, and furthermore, power transfer capability is improved [21, 31, 32].
Furthermore, on the basis of FTR obtained for the multiarea bulk power system, RBCA is performed, and a comparative analysis is carried out with the existing STR of the transmission lines. The criticality of transmission considering N − 1 criteria is identified, and LC is performed on candidate load buses based on Figure 2. Five FTR on HR lines of the multiarea system is generated, and risk-based reliability analysis is performed. The FTR systems are further compared with the existing STR system of those lines, and reliability indices are calculated. The proposed FTR model on the multiarea bulk power system is shown in Figure 3.
3. Reliability Evaluation Using Analytical Approach
3.1. Reliability Indices
- 1.
For contingency j at bus i, EENS is defined as MWhr/yr and formulated as
() -
where LCij is bus i’s contingency-induced active power LC [3, 34].
- 2.
EDNS: The extent of lost load due to major outages is quantified in terms of EDNS [3], which is calculated during the operation of bulk power systems. For bus i, EDNS is expressed as
() - 3.
BPECI for bus i is expressed as [3]
() -
where PD,Peak is the system peak load.
- 4.
MBPCI for bus i is expressed as [3]
() - 5.
The unreliability cost incurred by consumers or load points in the occurrence of a contingency is known as the EIC. The unit of EIC is k$/yr. EIC can be formulated first by determining the departure rate D, which is calculated on the basis of failure and repair rate contingent lines.
() -
where μ (repairs/yr) and λ (failures/yr) are repair and failure rates of contingent lines, respectively. Furthermore, duration of contingency, dr, is calculated using (15) which further calculates EIC using (16).
()() -
where drj is duration (in years) of contingency j, and LDF(drj) is load damage function for duration of contingency j in k$/MWhr [3, 34].
3.2. Analytical Approach—Proportional Load Curtailment
- i.
Power balance constraints
()() - ii.
Generation constraints
()() - iii.
LC constraint
() - iv.
Bus voltage limit
() - v.
Line MVA limit
() -
where Nb is the number of buses of the system, for unit z, the active generation is Pgz and reactive generation is Qgz, Pdi is the active load, Qdi is the reactive load at bus i, Yiw and ζiw are the admittance and angle of line connecting bus i to w, θi and θw are the voltage angle for bus i and w, the lower limit of active and reactive generation for unit z is denoted by Pgz,min and Qgz,min, similarly, upper limits are denoted by Pgz,max and Qgz,max, is the maximum load at bus i, the voltage limits at bus i—the voltage lower limit is and voltage upper limit is , Siw is the line MVA from bus i to w, and is the MVA limit of line connecting bus i to w. The MVA limit of line, , considered for solving LC at load buses, incorporates the STR and FTR.
The analytical approach results in over curtailment of load buses when line outage contingency occurred on the system. Due to this, some reliability standards for the system at a particular operating outage condition are neglected. To prevent this, LC is minimized at each load bus. In this paper, LCij minimization using meta-heuristic or population-based approaches such as PSO and GWO is suggested and is discussed in Sections 4 and 5.
4. Optimal LC Using PSO
The objective function is subjected to network constraints mentioned in (18)–(24).
4.1. Initialization
- ➢
The weight value for bus i in relation to contingency j is defined by the particles (x1, x2, ……xn).
- ➢
Each x particle is made up of elements from set X, which specifies their location.
- ➢
The objective function for the xth particle is formulated by , which is realized when the load value for bus i is determined.
- ➢
To create the best minimization of LCij in a single iteration, Gbest realizes all values.
4.2. Algorithm Description
- i.
The characteristics of the swarm are specified, including the swarm size (S), the acceleration constants, and the weighting factor.
- ii.
The initial swarm size is determined by randomly generating a set of particles whose vector dimensions are furthermore randomly generated.
- iii.
Now, the initial random position of Pbest is determined by considering all of the network constraints at each particle, and this value is indicated by LCij.
- iv.
Initial Gbest will be represented by the particle that produces the minimal LCij value.
- v.
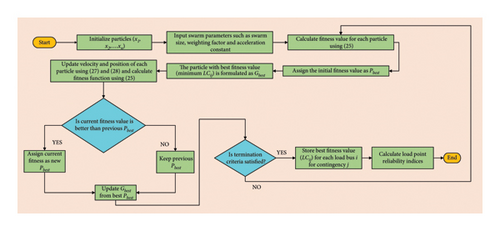
Each individual particle x in the swarm S has its location (Xx), and its velocity (Vx) is updated by (27) and (28). At first, the inertia weight wt is calculated for iteration k using the following equation:
() -
where minimum and maximum values of inertia weight are denoted by wtmin and wtmax, respectively, and kmax is the maximum no. of iterations.
() -
where c1 (cognitive) and c2 (social) are acceleration constants, r1 and r2 are random numbers ∈ [0, 1], the best value of the objective function for particle x at iteration k is represented by , and Gbest(k) is the particle with the best fitness function value calculated at iteration k. The position of the particle is updated as follows:
() -
where xth particle position at iteration k is Xx(k).
- vi.
Set k equal to (k + 1).
- vii.
The fitness function for each particle is determined in (25) with the aforementioned network constraints being taken into consideration.
- viii.
Update Pbest and Gbest.
- ix.
Follow Step 5 to Step 8 again until the termination criteria mentioned in (29) is not fulfilled.
() -
where ε is the tolerance level for the algorithm.
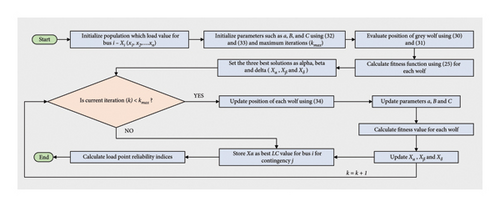
The reliability indices in (10)–(13) and (16) are computed using the minimum LCij obtained using the PSO algorithm due to contingency j at each load bus i. Figure 4 depicts a flowchart of the proposed PSO for determining the minimum LCij. Similarly, in Section 5, the application of GWO is described in the context of minimization of LCij.
5. Optimal LC Using GWO
The GWO algorithm is proposed by Mirjalili, which is based on gray wolves’ leadership, social organization, and hunting process. Four types of gray wolves are used to replicate the leadership structure: α, β, δ, and ω. In addition, the three fundamental hunting processes are implemented: chasing, surrounding, and attacking the prey. Each species of wolf serves a specific objective. The leader wolf α makes the decisions and the others follow. This concept of the GWO algorithm is used to find the optimal global solution. The β comes next in the order, followed by the δ and ω. These four wolves (solutions) become initial solution candidates, which are then refined in consecutive iterations [40–42]. GWO will be applied to evaluate the fitness function mentioned in (25) subject to network constraints addressed in (18)–(24).
5.1. Mathematical Model Formulation
5.2. Algorithm Description
- i.
Xi(x1, x2, ……xn) is the initialization of the population indicating the load value for bus i and the contingency j.
- ii.
- iii.
Using (25), compute the objective function for Xα, Xβ, and Xδ.
- iv.
Using (31) and a, B, and C, update the current position.
- v.
Save the updated Xα, Xβ, and Xδ.
- vi.
Evaluate the objective function for updated Xα, Xβ, and Xδ.
- vii.
Set k = k + 1.
- viii.
Save Xα as the optimal value whenever the current iteration—k ≥ kmax.
Reliability indices are computed for minimum LCij using GWO using (10)–(13), (16) for contingency j at each load bus i. Figure 5 depicts the proposed GWO flowchart.
In Section 6, case study (IEEE 24 RTS) and results by applying proposed approach (PSO and GWO) is discussed and compared with the analytical approach.
6. Case Study and Results
6.1. RBCA of Transmission Lines
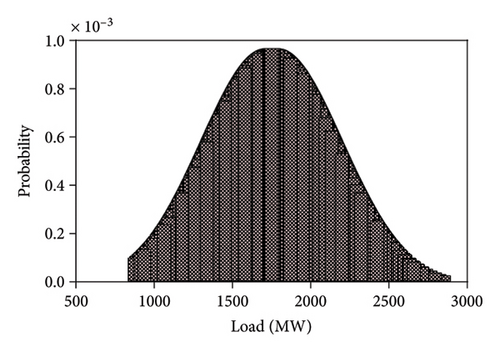
The RBCA on transmission lines is performed on IEEE 24 RTS. The test system includes 3405 MW of generating capacity and 2850 MW of annual peak load across 32 generating units with 24 buses and 38 transmission lines (30 single circuit lines and four double circuit lines) [3]. For reliability analysis of multiarea power systems, the associated tie lines between the areas are used to evaluate their reliability taking into consideration the limitations of tie line power interchange capacity. Each area should be self-sufficient in interconnected power systems to supply secure and reliable power to meet the load demand. IEEE 24 RTS is divided in four areas, as shown in Figure 6 (details mentioned in [44, 45]), connected with tie lines—2–6, 5–10, 8–9 (Area 1 to Area 2), 3–24 (Area 1 to Area 4), 9–11, 9–12 (Area 1 to Area 3), 10–11, 10–12 (Area 2 to Area 3), and 14–16, 16–19 (Area 3 to Area 4). The RBCA is applied considering uncertainty of loads using random normal distribution by considering the variation of ±5% of base case data, and it is shown in Figure 7.
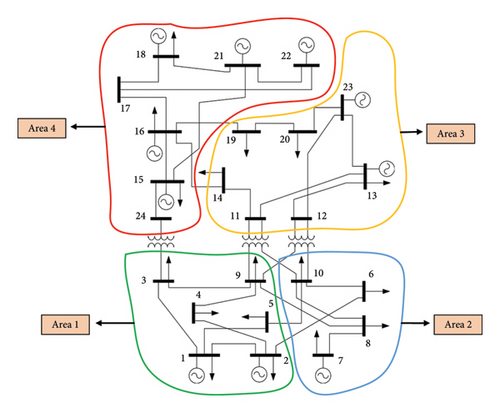
AC-OPF is performed to check whether the areas are self-sufficient or not. In order to meet the load demand in an area, power is supplied through the tie lines to the generation deficit areas from the generation surplus area without violating constraints from (21)–(27). Table 4 shows self-sufficient characteristics of all the areas.
| Area | Self sufficient | Tie lines considered |
|---|---|---|
| Area 1 | ✗ | (9–11) and (9–12)—Area 1 to Area 3 |
| Area 2 | ✗ | (10–11) and (10–12)—Area 2 to Area 3 |
| Area 3 | ✓ | — |
| Area 4 | ✓ | — |
Area 1 and Area 2 are found to be not self-sufficient when AC-OPF is performed. To satisfy the power balance of Area 1 and Area 2, the tie lines 9–11 and 9–12 are considered for interchange of power flow between Area 1 and Area 3. Similarly, Area 2 and Area 3 are connected through tie lines 10–11 and 10–12 to meet the load demand considering all network constraints. Interconnection of Area 1 to Area 4 via tie Lines 3–24 is not possible as the MVA limit of the specified tie Lines 3–24 and Lines 15–24 is violated when AC-OPF is performed. Also, interconnection of Area 1 to Area 2 via tie Lines 2–6, 5–10, and 8-9 is not possible as both areas are not self-sufficient, hence power balance is not satisfied. On performing simulations at the N − 1 outage level on connecting Area 3 to Area 4 via tie Lines 14–16 and 16–19, all lines associated to both the areas are classified as (N) state as they both are generation surplus areas, and power balance is satisfied on performing AC-OPF at each outage level.
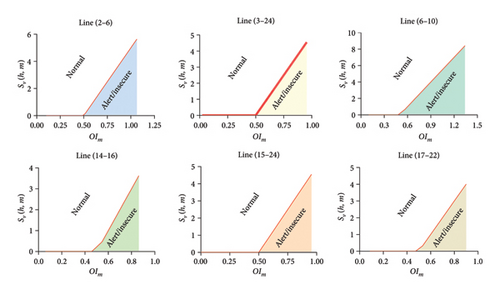
For each single-line outage, severity function is developed using (2), and load buses are selected for LC. Severity function of sample lines of the test system is shown in Figure 8. For interconnected areas (Area 1–Area 3 and Area 2–Area 3) and self-sufficient areas (Area 3 and Area 4), single-line outage scenario is created, and severity functions is developed. Severity functions for tie lines of Area 1–Area 3 and Area 2–Area 3 are shown in Figure 9. It is found from simulations that Area 4 remains in normal (N) state with the N − 1 outage level, and it never falls into (A) and (I) states. Therefore, it can be deduced that Area 4 is N − 1 secure considering transmission line outage. Load buses for LC are selected on the basis of (A) and (I) states obtained for each single and multiareas.
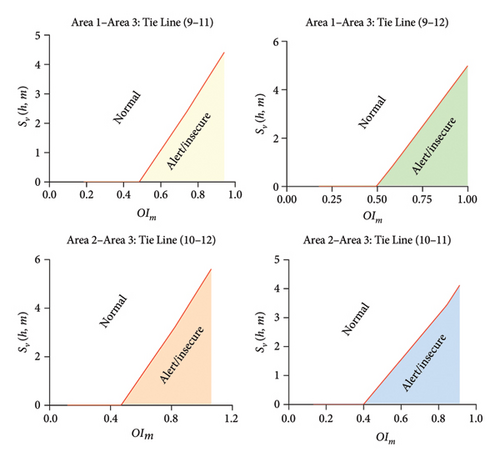
Based on severity functions obtained for contingent lines of the system, RI is calculated to classify the risk level associated with single-line outages in the system. Figure 10 shows RI calculated for each transmission line for IEEE 24 RTS, and based on categorization (see Table 3), HR lines are highlighted. The ηU and ηL for quantification of RI are considered as 0.6 and 0.4, respectively [29]. Similarly, for multiarea (Area 1–Area 3 and Area 2–Area 3) and single-area networks (Area 3), RI is calculated for its associated transmission lines, and HR category lines are depicted in Figure 11.
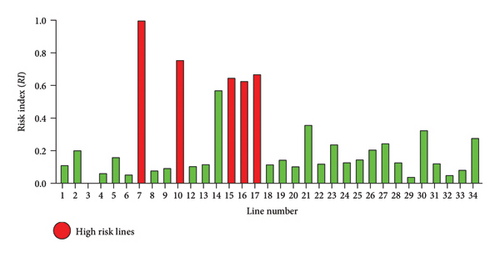
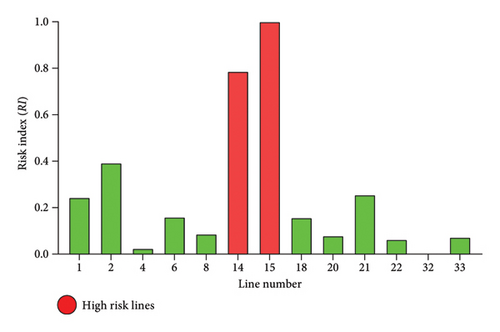
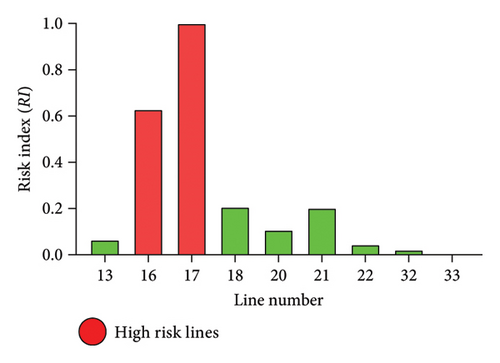
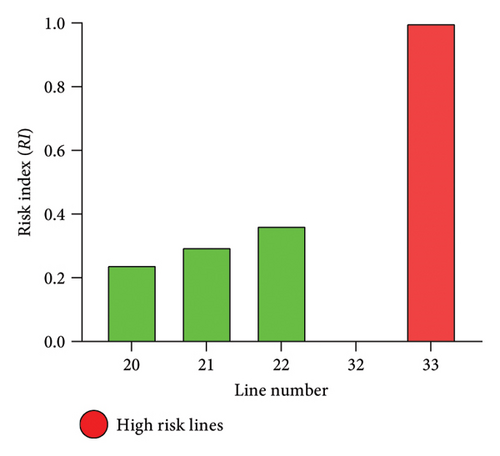
From Figures 10 and 11, HR category lines are highlighted which infers that these lines have a higher degree of severity among other transmission lines when their outage takes place on the system. Also, it has been seen in Figures 11 (a) and 11(b) that in multiarea systems or interlinking areas, tie lines fall in the category of HR. Figure 11(c) shows the lines fall under the HR category for a single area. This information on transmission lines (and tie lines) is essential for system operators as they greatly impact the system and forms an important link between multiple areas.
6.2. Reliability Analysis With Analytical Approach
In this paper, the analytical approach and proposed meta-heuristics techniques for optimal LC is performed on IEEE 24 RTS. AC-OPF is applied for each line outage, and based on the severity function obtained, load on candidate load buses is curtailed (as shown in Table 5) and amount of LCij is determined. The value of LDF for various loads is considered from [11]. Table 6 shows the calculated reliability indices at each load bus along with the LC value due to line failure. Results shown in Table 6 indicates the cumulative effect of bus LC with each single-line outage. For example, according to Table 5, load at Bus 1 is curtailed for four single-line outage cases. For outage of Lines 1-2, EENS and EIC values at Bus 1 are 453.62 MWhr/yr and 7429.14 k$/yr, respectively. For Lines 1–3, EENS and EIC at Bus 1 are 665.72 MWhr/yr and 10,902.66 k$/yr, respectively. For Lines 1–5, EENS and EIC at Bus 1 are 210.87 MWhr/yr and 3453.53 k$/yr, respectively, and lastly, for outage of Lines 2–4, EENS and EIC at Bus 1 are 350.23 MWhr/yr and 5735.78 k$/yr, respectively. Thus, total EENS and EIC values obtained at Bus 1 are 1680.45 MWhr/yr and 27,521.12 k$/yr, respectively. Similarly, for load buses, cumulative EENS and EIC values are calculated, as shown in Table 5. Other indices such as EDNS, BPECI, and MBPCI are also calculated using (11)–(13) and are shown in Table 6. Similarly, LC is performed at candidate buses for interconnected areas, and single area and reliability are calculated, as shown in Table 7.
| Line number | From bus | To bus | Candidate load buses for LC |
|---|---|---|---|
| 1 | 1 | 2 | 1, 2, 3, 5, 10, 18 |
| 2 | 1 | 3 | 1, 3, 9, 10, 18 |
| 3 | 1 | 5 | 1, 5, 10, 18 |
| 4 | 2 | 4 | 1, 2, 4, 6, 9, 10, 18 |
| 5 | 2 | 6 | 2, 6, 10 |
| 6 | 3 | 9 | 3, 9, 14, 15, 18 |
| 7 | 3 | 24 | 3, 9, 14, 18 |
| 8 | 4 | 9 | 4, 9, 14 |
| 9 | 5 | 10 | 5, 10 |
| 10 | 6 | 10 | 6, 10 |
| 11 | 7 | 8 | 7 |
| 12 | 8 | 9 | 8, 9, 10 |
| 13 | 8 | 10 | 8, 10 |
| 14 | 9 | 11 | 3, 9, 10 |
| 15 | 9 | 12 | 3, 9, 10, 14 |
| 16 | 10 | 11 | 3, 6, 10, 14 |
| 17 | 10 | 12 | 3, 6, 10, 14 |
| 18 | 11 | 13 | 10, 13, 14, 16 |
| 19 | 11 | 14 | 3, 10, 13, 14, 15, 16 |
| 20 | 12 | 13 | 10, 13, 14 |
| 21 | 12 | 23 | 3, 10, 13, 14, 15, 16 |
| 22 | 13 | 23 | 3, 10, 14, 16 |
| 23 | 14 | 16 | 3, 9, 10, 13, 14, 15, 16, 19 |
| 24 | 15 | 16 | 3, 10, 14, 15, 16, 18 |
| 25 | 15 | 21 | 3, 10, 14, 15, 16, 18 |
| 26 | 15 | 24 | 7, 9, 10, 13, 14, 15, 16, 18 |
| 27 | 16 | 17 | 3, 7, 10, 14, 15, 16, 18 |
| 28 | 16 | 19 | 3, 7, 10, 14, 16, 18, 19 |
| 29 | 17 | 18 | 3, 7, 10, 14, 16, 18 |
| 30 | 17 | 22 | 3, 7, 10, 14, 16, 18 |
| 31 | 18 | 21 | 3, 7, 10, 16, 18 |
| 32 | 19 | 20 | 3, 10, 14, 16, 18, 19, 20 |
| 33 | 20 | 23 | 10, 14, 16, 18, 20 |
| 34 | 21 | 22 | 3, 7, 10, 14, 16, 18 |
| Load bus | LCij (MW) | EENS (MWhr/yr) | EIC (k$/yr) | EDNS (MW) | BPECI | MBPCI |
|---|---|---|---|---|---|---|
| 1 | 19.25 | 1680.45 | 27,521.12 | 0.1918 | 0.5896 | 6.7E − 05 |
| 2 | 17.29 | 1159.15 | 16,579.55 | 0.1323 | 0.4067 | 4.6E − 05 |
| 3 | 32.09 | 25,122.66 | 406,164.93 | 2.8679 | 8.8150 | 1.0E − 03 |
| 4 | 13.19 | 495.44 | 7994.48 | 0.0566 | 0.1738 | 2.0E − 05 |
| 5 | 12.66 | 704.40 | 12,769.47 | 0.0804 | 0.2472 | 2.8E − 05 |
| 6 | 24.25 | 6342.12 | 101,228.90 | 0.7240 | 2.2253 | 2.5E − 04 |
| 7 | 22.29 | 5423.72 | 96,417.82 | 0.6191 | 1.9031 | 2.2E − 04 |
| 8 | 30.49 | 1403.08 | 22,472.11 | 0.1602 | 0.4923 | 5.6E − 05 |
| 9 | 31.20 | 11,851.62 | 249,914.29 | 1.3529 | 4.1585 | 4.7E − 04 |
| 10 | 34.77 | 33,519.52 | 574,762.31 | 3.8264 | 11.7612 | 1.3E − 03 |
| 13 | 47.25 | 7879.93 | 134,502.40 | 0.8995 | 2.7649 | 3.2E − 04 |
| 14 | 34.59 | 25,187.47 | 383,291.61 | 2.8753 | 8.8377 | 1.0E − 03 |
| 15 | 56.52 | 10,412.58 | 186,541.12 | 1.1887 | 3.6535 | 4.2E − 04 |
| 16 | 17.83 | 6938.53 | 119,899.96 | 0.7921 | 2.4346 | 2.8E − 04 |
| 18 | 59.38 | 26,348.10 | 454,834.71 | 3.0078 | 9.2449 | 1.1E − 03 |
| 19 | 32.27 | 1829.92 | 29,229.78 | 0.2089 | 0.6421 | 7.3E − 05 |
| 20 | 22.82 | 853.39 | 12,786.36 | 0.0974 | 0.2994 | 3.4E − 05 |
| Area | Load bus | EENS (MWhr/yr) | EIC (k$/yr) | EDNS (MW) | BPECI | MBPCI |
|---|---|---|---|---|---|---|
| Area 1–Area 3 | 1 | 844.95 | 13,837.90 | 0.0965 | 0.5736 | 6.55E − 05 |
| 2 | 322.85 | 4617.88 | 0.0369 | 0.2192 | 2.50E − 05 | |
| 3 | 13,531.63 | 218,769.66 | 1.5447 | 9.1864 | 1.05E − 03 | |
| 4 | 246.30 | 3974.40 | 0.0281 | 0.1672 | 1.91E − 05 | |
| 5 | 851.79 | 15,441.26 | 0.0972 | 0.5783 | 6.60E − 05 | |
| 9 | 12,577.94 | 265,230.39 | 1.4358 | 8.5390 | 9.75E − 04 | |
| 13 | 14,929.99 | 254,839.87 | 1.7043 | 10.1358 | 1.16E − 03 | |
| 14 | 5522.73 | 84,042.53 | 0.6304 | 3.7493 | 4.28E − 04 | |
| 19 | 590.24 | 9428.14 | 0.0674 | 0.4007 | 4.57E − 05 | |
| 20 | 517.64 | 7755.86 | 0.0591 | 0.3514 | 4.01E − 05 | |
| Area 2-Area 3 | 6 | 17,510.78 | 279,495.9 | 1.9989 | 12.5525 | 1.4E − 03 |
| 7 | 8603.28 | 152,940.9 | 0.9821 | 6.1672 | 7.0E − 04 | |
| 8 | 9893.59 | 158,458.1 | 1.1294 | 7.0922 | 8.1E − 04 | |
| 10 | 11,193.9 | 191,942.9 | 1.2778 | 8.0243 | 9.2E − 04 | |
| 13 | 10,340.63 | 176,504.1 | 1.1804 | 7.4126 | 8.5E − 04 | |
| 14 | 5542.55 | 84,344.04 | 0.6327 | 3.9732 | 4.5E − 04 | |
| 19 | 0 | 0 | 0 | 0 | 0 | |
| 20 | 519.50 | 7783.68 | 0.0593 | 0.3724 | 4.3E − 05 | |
| Area 3 | 13 | 4203.02 | 71,741.29 | 0.4798 | 5.4727 | 6.25E − 04 |
| 14 | 10,804.43 | 164,417 | 1.2334 | 14.0683 | 1.61E − 03 | |
| 19 | 0 | 0 | 0 | 0 | 0 | |
| 20 | 537.10 | 8047.40 | 0.0613 | 0.6994 | 7.98E − 05 | |
When the analytical method is used, the system’s %LCij is 17.83%, as shown in Table 6. PSO and GWO algorithms are used to minimize %LCij at each load bus of the entire system, as well as multiarea and single-area systems, and furtherore, reliability indices are computed.
6.3. Reliability Analysis With Optimal LC by PSO and GWO
The LC obtained through an analytical method is unable to reflect accurately the actual status of reliability for the test system under consideration. PSO is thus used to calculate optimal LC at each load bus. On performing PSO for optimal LC, the total number of particles is considered as 200, with maximum and minimum inertia weight taken as 0.9 and 0.4, respectively. The total number of iterations for performing PSO is taken as 200, and acceleration constants are equal to two [39]. The average, best, and worst statistical analyses [46] are performed for multiple runs of the PSO technique, and the results are presented in Table 8. The optimization techniques solved for the proposed RBCA with optimal LC are programmed in MathWorks MATLAB 2023a on a system equipped with Intel I5 12th Gen 1.7-GHz CPU and 16 GB of RAM.
| Load bus | Best—LCij (MW) | Average—LCij (MW) | Worst—LCij (MW) | LCij (%) |
|---|---|---|---|---|
| 1 | 8.4103 | 8.42 | 8.4322 | 7.79 |
| 2 | 11.534 | 11.54 | 11.558 | 11.89 |
| 3 | 11.834 | 11.90 | 12.038 | 6.61 |
| 4 | 9.5857 | 9.59 | 9.6048 | 12.95 |
| 5 | 7.6354 | 7.64 | 7.6512 | 10.76 |
| 6 | 12.214 | 12.22 | 12.291 | 8.98 |
| 7 | 12.135 | 12.14 | 12.151 | 9.71 |
| 8 | 12.762 | 12.77 | 12.786 | 7.46 |
| 9 | 14.911 | 14.95 | 15.026 | 8.54 |
| 10 | 10.211 | 10.27 | 10.284 | 5.26 |
| 13 | 23.036 | 23.04 | 23.057 | 8.69 |
| 14 | 12.244 | 12.25 | 12.284 | 6.31 |
| 15 | 15.758 | 15.87 | 15.914 | 5.00 |
| 16 | 7.104 | 7.15 | 7.197 | 7.15 |
| 18 | 15.338 | 15.34 | 15.351 | 4.60 |
| 19 | 12.388 | 12.44 | 12.497 | 6.87 |
| 20 | 12.108 | 12.15 | 12.196 | 9.49 |
Table 9 shows the reliability indices and LCij computed after minimizing the LC using the PSO. The PSO results indicate reduction in the system’s % LCij from 17.83% (analytical approach) to 7.35%, and reliability indices are greatly improved.
| Load bus | EENS (MWhr/yr) | EIC (k$/yr) | EDNS (MW) | BPECI | MBPCI |
|---|---|---|---|---|---|
| 1 | 734.86 | 11,913.40 | 0.0839 | 0.2578 | 2.9E − 05 |
| 2 | 773.62 | 10,989.53 | 0.0883 | 0.2714 | 3.1E − 05 |
| 3 | 9315.98 | 148,890.93 | 1.0635 | 3.2688 | 3.7E − 04 |
| 4 | 77.28 | 5780.91 | 0.0411 | 0.1263 | 1.4E − 05 |
| 5 | 425.60 | 7665.84 | 0.0486 | 0.1493 | 1.7E − 05 |
| 6 | 3197.06 | 50,563.37 | 0.3650 | 1.1218 | 1.3E − 04 |
| 7 | 3521.68 | 62,300.60 | 0.4020 | 1.2357 | 1.4E − 04 |
| 8 | 587.96 | 9316.50 | 0.0671 | 0.2063 | 2.4E − 05 |
| 9 | 5679.77 | 118,899.40 | 0.6484 | 1.9929 | 2.3E − 04 |
| 10 | 9904.23 | 167,777.44 | 1.1306 | 3.4752 | 4.0E − 04 |
| 13 | 3841.99 | 65,000.22 | 0.4386 | 1.3481 | 1.5E − 04 |
| 14 | 8920.46 | 134,053.84 | 1.0183 | 3.1300 | 3.6E − 04 |
| 15 | 2923.30 | 51,752.73 | 0.3337 | 1.0257 | 1.2E − 04 |
| 16 | 2785.72 | 47,647.95 | 0.3180 | 0.9774 | 1.1E − 04 |
| 18 | 6807.53 | 116,030.99 | 0.7771 | 2.3886 | 2.7E − 04 |
| 19 | 705.65 | 11,144.17 | 0.0806 | 0.2476 | 2.8E − 05 |
| 20 | 454.35 | 6745.03 | 0.0519 | 0.1594 | 1.8E − 05 |
Similarly, LCij is minimized using the GWO. The maximum number of iterations for GWO is 200, and the population size is considered as 200. The average, best, and worst statistical analyses are performed for multiple runs of the GWO technique, and the results are presented in Table 10.
| Load bus | Best—LCij (MW) | Average—LCij (MW) | Worst—LCij (MW) | LCij (%) |
|---|---|---|---|---|
| 1 | 6.014 | 6.06 | 6.097 | 5.61 |
| 2 | 8.903 | 8.92 | 8.984 | 9.20 |
| 3 | 10.435 | 10.49 | 10.508 | 5.82 |
| 4 | 6.113 | 6.15 | 6.191 | 8.31 |
| 5 | 4.036 | 4.07 | 4.088 | 5.73 |
| 6 | 10.302 | 10.35 | 10.383 | 7.61 |
| 7 | 10.068 | 10.10 | 10.162 | 8.08 |
| 8 | 9.781 | 9.80 | 9.855 | 5.73 |
| 9 | 7.638 | 7.66 | 7.682 | 4.38 |
| 10 | 8.954 | 8.97 | 8.986 | 4.60 |
| 13 | 17.824 | 17.84 | 17.861 | 6.73 |
| 14 | 11.201 | 11.21 | 11.237 | 5.78 |
| 15 | 9.752 | 9.77 | 9.786 | 3.08 |
| 16 | 4.608 | 4.61 | 4.627 | 4.61 |
| 18 | 11.266 | 11.28 | 11.294 | 3.38 |
| 19 | 9.902 | 9.91 | 9.922 | 5.47 |
| 20 | 9.607 | 9.61 | 9.635 | 7.50 |
Table 11 depicts the reliability indexes at each load bus using GWO. The results show that %LCij at all load buses decreases considerably, resulting in improved reliability indices. Using the PSO and GWO algorithms, similar analyses are performed on both multiarea and single-area systems for improvement of reliability indices calculated from an analytical approach. Significant improvement is seen as compared to an analytical approach. Among both the optimization techniques, GWO performed better, and indices are improved. Results obtained for multiarea and single-area systems of the test system using PSO and GWO algorithms are illustrated in Tables 12 and 13.
| Load bus | EENS (MWhr/yr) | EIC (k$/yr) | EDNS (MW) | BPECI | MBPCI |
|---|---|---|---|---|---|
| 1 | 529.48 | 7449.23 | 0.0604 | 0.1858 | 2.1E − 05 |
| 2 | 598.08 | 6907.95 | 0.0683 | 0.2099 | 2.4E − 05 |
| 3 | 8210.63 | 119,828.82 | 0.9373 | 2.8809 | 3.3E − 04 |
| 4 | 231.10 | 2656.05 | 0.0264 | 0.0811 | 9.3E − 06 |
| 5 | 226.49 | 2957.04 | 0.0259 | 0.0795 | 9.1E − 06 |
| 6 | 2708.36 | 36,249.53 | 0.3092 | 0.9503 | 1.1E − 04 |
| 7 | 3140.77 | 47,706.90 | 0.3585 | 1.1020 | 1.3E − 04 |
| 8 | 451.26 | 6379.73 | 0.0515 | 0.1583 | 1.8E − 05 |
| 9 | 2912.00 | 43,335.90 | 0.3324 | 1.0218 | 1.2E − 04 |
| 10 | 8647.72 | 133,990.09 | 0.9872 | 3.0343 | 3.5E − 04 |
| 13 | 2975.23 | 41,072.90 | 0.3396 | 1.0439 | 1.2E − 04 |
| 14 | 8164.86 | 118,404.58 | 0.9321 | 2.8649 | 3.3E − 04 |
| 15 | 1801.28 | 28,485.91 | 0.2056 | 0.6320 | 7.2E − 05 |
| 16 | 1797.01 | 26,247.28 | 0.2051 | 0.6305 | 7.2E − 05 |
| 18 | 5005.96 | 79,322.85 | 0.5715 | 1.7565 | 2.0E − 04 |
| 19 | 562.09 | 8103.89 | 0.0642 | 0.1972 | 2.3E − 05 |
| 20 | 359.34 | 4633.29 | 0.0410 | 0.1261 | 1.4E − 05 |
| Area | Load bus | EENS (MWhr/yr) | EIC (k$/yr) | EDNS (MW) | BPECI | MBPCI |
|---|---|---|---|---|---|---|
| Area 1–Area 3 | 1 | 369.49 | 5990.17 | 0.0422 | 0.2508 | 2.86E − 05 |
| 2 | 215.47 | 3060.90 | 0.0246 | 0.1463 | 1.67E − 05 | |
| 3 | 5017.80 | 80,196.04 | 0.5728 | 3.4065 | 3.89E − 04 | |
| 4 | 178.99 | 2873.94 | 0.0204 | 0.1215 | 1.39E − 05 | |
| 5 | 851.79 | 15,441.26 | 0.0972 | 0.5783 | 6.60E − 05 | |
| 9 | 6027.85 | 126,186.2 | 0.6881 | 4.0922 | 4.67E − 04 | |
| 13 | 7279.38 | 123,155.0 | 0.8310 | 4.9419 | 5.64E − 04 | |
| 14 | 5522.73 | 84,042.53 | 0.6304 | 3.7493 | 4.28E − 04 | |
| 19 | 227.61 | 3594.585 | 0.0260 | 0.1545 | 1.76E − 05 | |
| 20 | 275.59 | 4091.35 | 0.0315 | 0.1871 | 2.14E − 05 | |
| Area 2–Area 3 | 6 | 13,568.18 | 215,982.4 | 1.5489 | 9.7263 | 1.1E − 03 |
| 7 | 5309.90 | 93,867.07 | 0.6062 | 3.8064 | 4.3E − 04 | |
| 8 | 4145.90 | 65,693.68 | 0.4733 | 2.9720 | 3.4E − 04 | |
| 10 | 3307.53 | 56,029.58 | 0.3776 | 2.3710 | 2.7E − 04 | |
| 13 | 5041.75 | 85,298.14 | 0.5755 | 3.6142 | 4.1E − 04 | |
| 14 | 5542.55 | 84,344.04 | 0.6327 | 3.9732 | 4.5E − 04 | |
| 19 | 0 | 0 | 0 | 0 | 0 | |
| 20 | 276.58 | 4106.03 | 0.0316 | 0.1983 | 2.3E − 05 | |
| Area 3 | 13 | 2049.25 | 34,670.01 | 0.2339 | 2.6683 | 3.05E − 04 |
| 14 | 10,804.43 | 164,417 | 1.2334 | 14.0683 | 1.61E − 03 | |
| 19 | 0 | 0 | 0 | 0 | 0 | |
| 20 | 285.95 | 4245.15 | 0.0326 | 0.3723 | 4.25E − 05 | |
| Area | Load bus | EENS (MWhr/yr) | EIC (k$/yr) | EDNS (MW) | BPECI | MBPCI |
|---|---|---|---|---|---|---|
| Area 1–Area 3 | 1 | 266.22 | 3745.54 | 0.0304 | 0.1807 | 2.06E − 05 |
| 2 | 166.58 | 1924.06 | 0.0190 | 0.1131 | 1.29E − 05 | |
| 3 | 4422.43 | 64,542.53 | 0.5048 | 3.0023 | 3.43E − 04 | |
| 4 | 114.89 | 1320.44 | 0.0131 | 0.0780 | 8.90E − 06 | |
| 5 | 851.79 | 15,441.2 | 0.0972 | 0.5783 | 6.60E − 05 | |
| 9 | 3090.47 | 45,991.7 | 0.3528 | 2.0981 | 2.40E − 04 | |
| 13 | 5637.14 | 77,820.2 | 0.6435 | 3.8270 | 4.37E − 04 | |
| 14 | 5522.73 | 84,042.53 | 0.6304 | 3.7493 | 4.28E − 04 | |
| 19 | 181.30 | 2613.93 | 0.0207 | 0.1231 | 1.41E − 05 | |
| 20 | 217.97 | 2810.43 | 0.0249 | 0.1480 | 1.69E − 05 | |
| Area 2–Area 3 | 6 | 12,955.55 | 198,038.7 | 1.4789 | 9.2871 | 1.1E − 03 |
| 7 | 4650.354 | 68,598.12 | 0.5309 | 3.3336 | 3.8E − 04 | |
| 8 | 3182.039 | 44,985.56 | 0.3632 | 2.2810 | 2.6E − 04 | |
| 10 | 2887.925 | 44,746.23 | 0.3297 | 2.0702 | 2.4E − 04 | |
| 13 | 3904.329 | 53,898.92 | 0.4457 | 2.7988 | 3.2E − 04 | |
| 14 | 5542.55 | 84,344.04 | 0.6327 | 3.9732 | 4.5E − 04 | |
| 19 | 0 | 0 | 0 | 0 | 0 | |
| 20 | 218.752 | 2820.513 | 0.0250 | 0.1568 | 1.8E − 05 | |
| Area 3 | 13 | 1586.94 | 21,907.58 | 0.1812 | 2.0663 | 2.36E − 04 |
| 14 | 10,804.43 | 164,417 | 1.2334 | 14.0683 | 1.61E − 03 | |
| 19 | 0 | 0 | 0 | 0 | 0 | |
| 20 | 226.16 | 2916.07 | 0.0258 | 0.2945 | 3.36E − 05 | |
6.4. Impact of FTR on the Multiarea System
According to RBCA on multiarea systems, tie lines Area 1–Area 3 and Area 2–Area 3 are at high risk. Tie lines provide an important link between generation deficit area to generation surplus area. Therefore, the FTR system is employed to scale up their power delivering capacity and enhance their reliability. Five FTR are generated considering different weather conditions and employed on tie lines 9–11, 9–12, 10–11, and 10–12. Weather information for the FTR system is taken from NREL western wind dataset [33]. MTTR and MTTF values for the FTR system are calculated using (8) and (9). Furthermore, AC-OPF is performed, and severity functions are generated. Based on severity function, RI is calculated at each FTR, and LC is performed on candidate load buses. Table 14 shows the generated values of FTR applied on the multiarea system and their comparison with existing STR. It was found from Table 14 that the rating of tie lines is enhanced significantly by applying FTR. The impact of FTR is then analyzed by performing RBCA.
| STR (MVA) | FTR 1 (MVA) | FTR 2 (MVA) | FTR 3 (MVA) | FTR 4 (MVA) | FTR 5 (MVA) |
|---|---|---|---|---|---|
| 400 | 420.3 (+5.07%) | 445.43 (+11.358%) | 465.56 (+16.39%) | 485.86 (+21.46%) | 470.23 (+17.55%) |
6.4.1. Area 1 to Area 3—Lines 9–11 and Lines 9–12
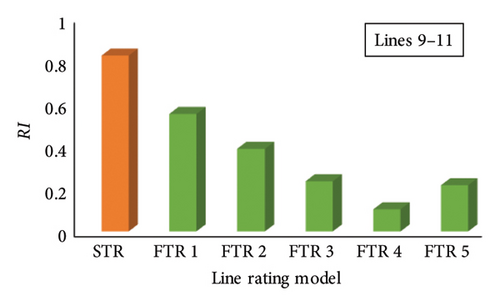
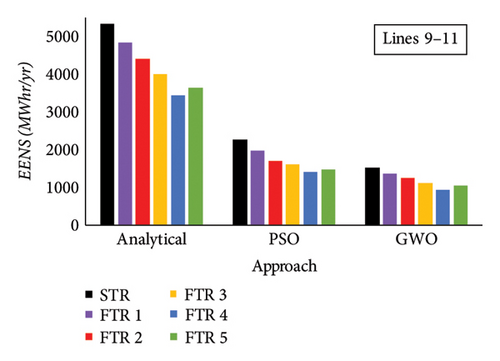
FTRs mentioned in Table 14 are applied on Lines 9–11 and Lines 9–12. AC-OPF is performed considering Lines 9–11 and Lines 9–12 outage by implementing N-1 criteria on the system. Severity function then calculated and generated using (2) for Lines 9–11 and Lines 9–12. Figure 12(a) shows the linear severity function of tie Lines 9–11 of Area 1–Area 3. On the basis of severity functions generated for different FTRs, RI is calculated using (4). Figure 13(a) shows the comparison of calculated RI of the existing STR of Lines 9–11 with different FTRs. It was found from Figure 13(a) that, by implementing FTR on Lines 9–11, severity of line is reduced considerably contributing toward reduction in the risk level on the multiarea system when compared to the STR system. Candidate load buses are selected based on severity functions of each FTR, and LC is performed using analytical approach considering network constraints. Furthermore, optimal LC is calculated using PSO and GWO. EENS is calculated for the tie Lines 9–11, and a comparison is performed with the existing STR system. EENS of Lines 9–11 at STR and different FTRs are shown in Figure 14(a).
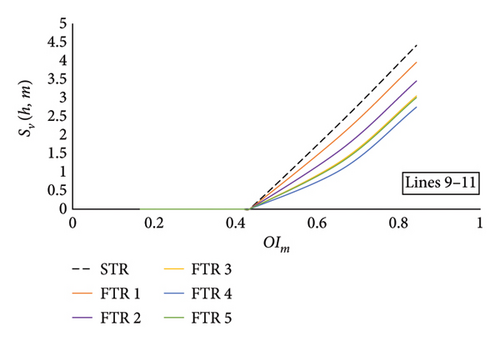

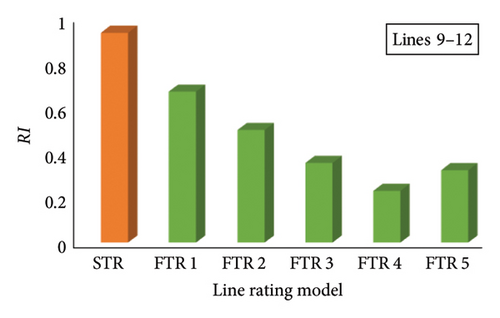
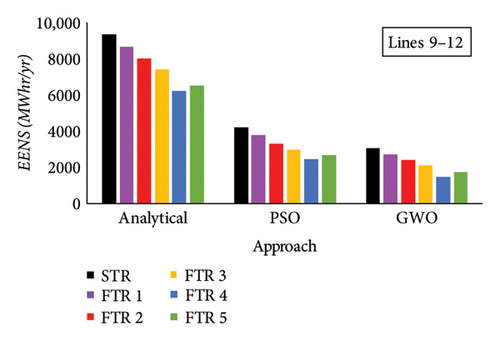
Similar analysis is performed on tie Lines 9–12 of Area 1–Area 3 by applying FTRs mentioned in Table 14. Linear severity function is generated after performing AC-OPF with FTR on tie Lines 9–12. The severity functions of tie Lines 9–12 with FTR are shown in Figure 12(b). Based on the severity functions in Figure 12(b), RI is calculated, and a comparison with the existing STR for tie Lines 9–12 is shown in Figure 13(b). It was found that, on applying FTR on Lines 9–12, severity is reduced considerably in comparison to STR. Also, on applying FTR 4 and FTR 5 on tie Lines 9–12 at the N-1 outage level, operating state of available Lines 3–9 is changed to normal (N) state, which indicates the reduction in the severity level of available lines when FTR is applied. As a result, this reduction in the severity of available lines truncates the risk level in comparison to the existing STR system. Based on the severity function, candidate load buses are selected for each FTR system, and LC is performed. Further, based on analytical approach, PSO and GWO LC load curtailment is performed. EENS is further calculated for outage of Lines 9–12, and a comparison is instigated with the existing STR system of tie Lines 9–12. A comparison of FTRs with the STR system of Lines 9–12 is shown in Figure 14(b). It was deduced from Figure 14(b) that EENS of tie Lines 9–12 is considerably reduced when FTR is employed on the tie lines which indicates enhancement in the reliability level of the system at the N − 1 outage level. Also, on applying FTR 4 and FTR 5, candidate load buses for LC are reduced and further elucidate decrease in EENS of tie Lines 9–12.
6.4.2. Area 2 to Area 3—Lines 10–11 and Lines 10–12
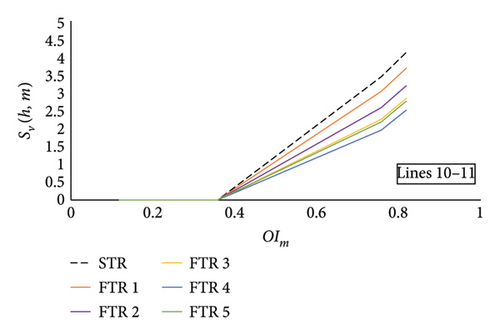
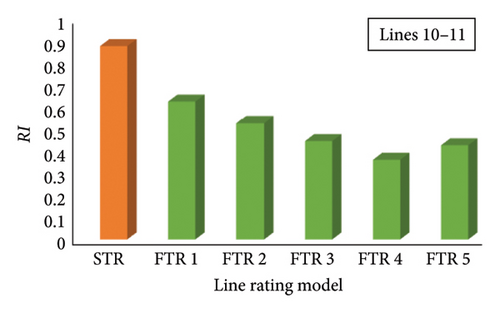
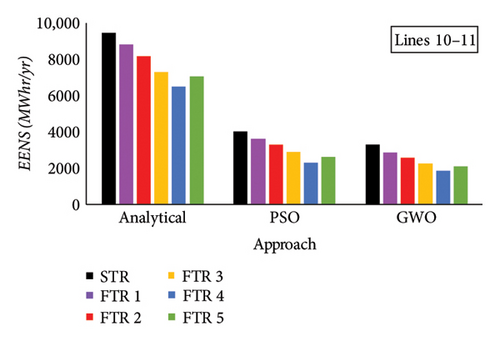
Tie lines of Area 2 to Area 3—Lines 10–11 and Lines 10–12 possess higher risk to the multiarea system when their outage occurs on the system. Due to this, FTRs are employed on these lines, and RBCA is implemented. Severity functions for tie Lines 10–11 are generated on performing AC-OPF at different FTRs, and a comparison is illustrated in Figure 12(c) with the existing STR system. RI is calculated based on severity functions generated for tie Lines 10–11. RI at different FTRs for Lines 10–11 is shown in Figure 13(c). Results of the RI explicate the role of FTR on risk analysis over the existing STR system. The RI of Lines 10–11 at different FTRs is alleviated significantly as the severity of others available due to its outage being reduced. Candidate load buses are selected based on severity function for each FTR, and reliability analysis is performed. LC is performed with analytical, PSO, and GWO techniques, and EENS is calculated. Variation of EENS for different FTRs and comparison with the existing STR for tie Lines 10–11 is shown in Figure 14(c).
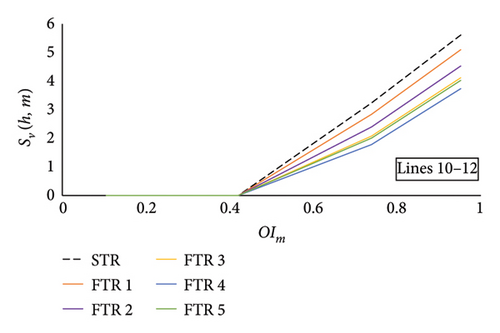
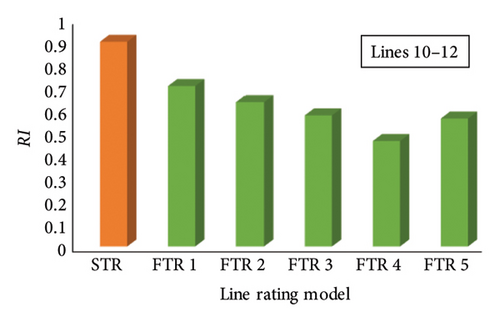
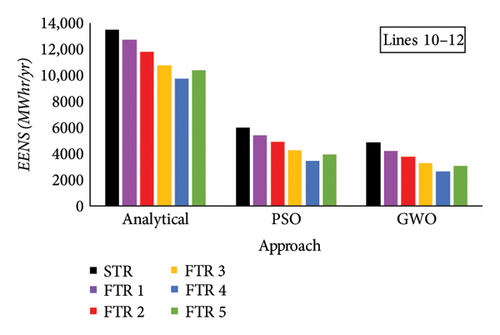
Likewise tie Lines 10–11, FTRs are applied on tie Lines 10–12, and RBCA is performed. Severity functions are generated for each FTR and are illustrated in Figure 12(d). Severity function of Lines 10–12 with the STR system indicates violation of the MVA limit of Lines 7-8 and Lines 11–13 making them insecure (I). Therefore, FTRs are applied on Lines 10–12 to enhance the system security of the multiarea system by transforming the operating state of insecure lines to alert (A) state. Furthermore, RI is calculated for tie Lines 10–12 based on severity functions shown in Figure 12(d). Variation of RI with different FTRs and a comparison with the existing STR system is shown in Figure 13(d). LC is performed using the proposed three approaches on candidate load buses based on severity functions. EENS is calculated for tie Lines 10–12 with the proposed FTRs. Comparison of EENS for FTRs is conducted with the existing STR system and is shown in Figure 14(d).
6.5. Comparison of LCij and Reliability Indices From Proposed Approaches
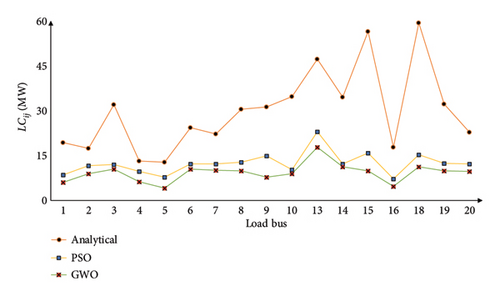
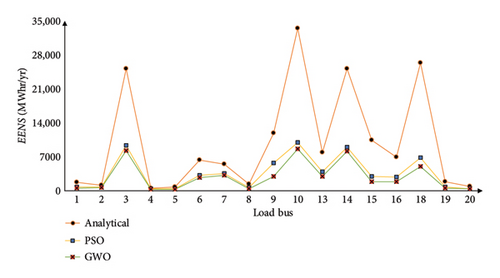
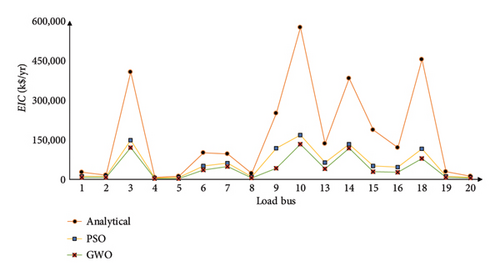
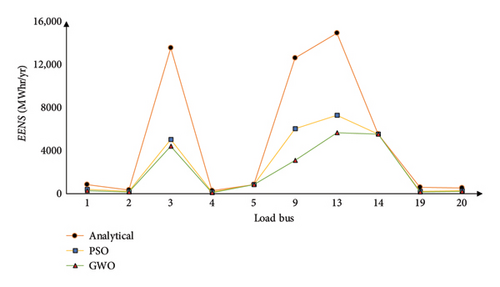
Analytical proportional LC is the method that is used to calculate reliability indices while considering the possibility of a single line being out of service. PSO and GWO are the methods that are used to acquire the minimum amount of LC. Comparative analysis of the whole system (IEEE 24 RTS) is illustrated graphically in Figure 15, based on Tables 6, 8, 9, 10, and 11. Similarly, comparative representations of the reliability indices are shown in Figures 16 and 17 for multiarea and single-area systems, respectively. When the PSO and GWO algorithms are utilized, the LCij value shows a discernible decrease, and reliability indices also indicate a significant reduction during this time. This is due to the algorithm’s high convergence level.
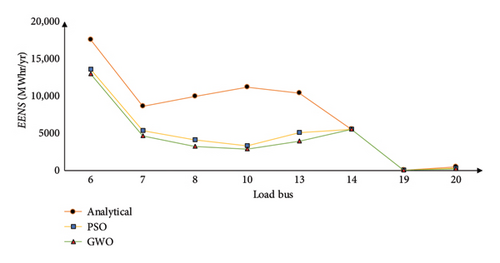
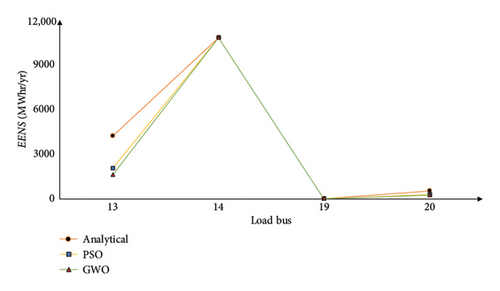
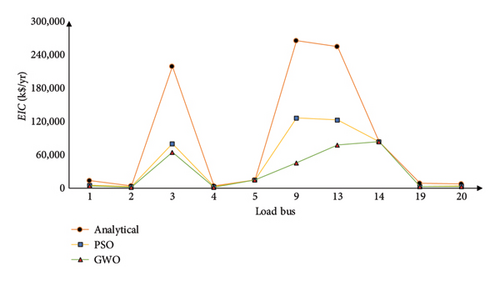
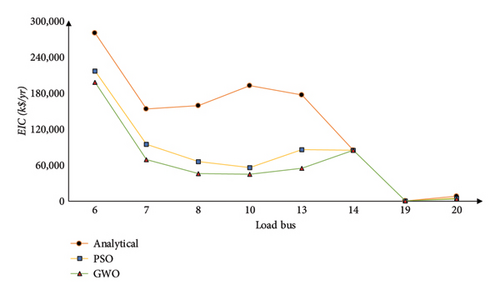

Furthermore, for calculation of LCij using analytical approach, AC-OPF is performed using well-known solvers such as MIPS, FMINCON, and IPOPT in the MATLAB environment. The results of a comparison between analytical, PSO, and GWO approaches based on %LCij are presented in Table 15. It has been demonstrated that utilizing the GWO algorithm results in a reduction of LCij to 5.50%, which represents a significant improvement in comparison to other approaches. Additionally, when comparing the results acquired from the PSO and GWO as discussed in Tables 8, 9, 10, and 11, the GWO algorithm is clearly more efficient than the PSO approach. The GWO algorithm avoids local best solution (minima), and the alterations are required only in control parameters (B and C), resulting in superior robustness and stability. On comparison to other meta heuristic techniques and traditional optimization solvers, both PSO and GWO balance global exploration and local exploitation well. They efficiently scan the search space for potential solutions and converge with optimal or near-optimal solutions. Furthermore, PSO and GWO can tackle constrained and multiobjective optimization functions. This versatility makes them relevant in many fields and problem scenarios. The computational complexity of each optimization technique, represented as O, for 200 iterations is presented in Table 16. While both PSO and GWO exhibit the same time complexity, the additional velocity computations in the PSO result in slightly higher computational time. Furthermore, PSO is less memory-efficient compared to GWO, as it requires storing velocity and personal best positions, increasing its overall space complexity.
| Approach/algorithm | %LCij | |
|---|---|---|
| Solver | ||
| Analytical approach | MIPS | 17.832 |
| FMINCON | 17.812 | |
| IPOPT | 17.650 | |
| PSO algorithm | 7.350 | |
| GWO algorithm | 5.501 | |
| Optimization technique | Time complexity | Space complexity | Memory usage | Mean CPU time (s) | ||
|---|---|---|---|---|---|---|
| PSO | Initialization of particles | O(Pt × Di) | Storing positions of particles | O(Pt × Di) | Higher | 205.3 |
| Objective function evaluation | O(Pt) | Storing velocities of particles | O(Pt × Di) | |||
| Updating velocities | O(Pt × Di) | Storing best positions | O(Pt × Di) | |||
| Compute new positions | O(Pt × Di) | Total space complexity O(3 × Pt × Di) ≈ O(Pt × Di) | ||||
| Total time complexity O(Pt × Di × kmax) | ||||||
| GWO | Initialization of wolves | O(Pt × Di) | Storing positions of all wolves | O(Pt × Di) | Lower | 185.5 |
| Evaluation of objective function | O(Pt) | Storing positions of leader wolves | O(3Di) | |||
| Compute new positions | O(Pt × Di) | Total space complexity O(Pt × Di) | ||||
| Total time complexity O(Pt × Di × kmax) | ||||||
- Note: Pt: population Size, Di: number of decision variables, and kmax: number of iterations.
In addition, a comparison with [11, 18] is shown in Table 17 based on reliability indices. The approaches utilized in the existing literature and the proposed approach are compared with the analytical (traditional) approach, and the results indicate considerable improvement in reliability indices compared to the analytical approach. Furthermore, indices obtained with optimal LC using the proposed approach yield better results than the studies in [11, 18].
| Reliability indices | [11] | [18] | Proposed approach | |
|---|---|---|---|---|
| PSO | GWO | |||
| EENS (MWhr/yr) | 28% (−) | 13% (−) | 31.8% (−) | 35.7% (−) |
| EIC (k$/yr) | 73% (−) | — | 54.8% (−) | 74.5% (−) |
| EDNS (MW) | 28.23% (−) | 13.03% (−) | 31.2% (−) | 35.5% (−) |
| BPECI | 28% (−) | 13% (−) | 31.8% (−) | 35.7% (−) |
| MBPCI | 28.25% (−) | 13.03% (−) | 31.2% (−) | 35.5% (−) |
- Note: (−) = % reduction in comparison to the analytical (traditional) approach.
Figure 15 shows that for Buses 3, 10, 13, 14, 15, 18, and 19, the LCij computed using the analytical proportional LC approach is significantly greater than the LCij computed using the PSO and GWO algorithms. Additionally, Figure 15 indicates that reliability indices are noticeably elevated at Bus 3, Bus 14, and Bus 18. This analysis suggests that Buses 3, 10, 14, and 18 are crucial because their LCij is significantly higher than the norm, and they are also least reliable. In addition, Table 5 shows that the only suitable load bus for LC during line Outage 7-8 is Bus 7, which accounts for its total LC and causes the connected generator to be islanded. As seen from Tables 12 and 13, for multiarea systems, Area 1–Area 3, LC is higher at Buses 3, 9, and 13, for Area 2–Area 3, critical load buses are Buses 6, 8, 10, and 13. Also, for the multiarea system Area 1–Area 3, Bus 5 and Bus 14’s entire load is curtailed when Lines 1–5 and Lines 11–14 outage takes place, respectively. Similarly, for Area 2–Area 3, the load at Buses 6, 7, and 14 load is completely curtailed with outage of Lines 6–10, 7–8, and 11–14, respectively. For single Area 3, Bus 14 is the most critical bus where higher impact is noticed and the load at Bus 14 is curtailed entirely when Lines 11–13 and Lines 11–14 outage takes place.
Line outages contributing to entire LC of the load buses are the most critical as the unreliability cost for the associated customers is high. Due to line outages, it was found that the candidate load buses were more important because they were connected to other load buses and carried a larger portion or percentage of the load. Also, the severity functions obtained for the test system show that the lines linked with these critical buses fall in the HR category. In the event of a line outage, customers linked to these load buses will incur higher unreliability costs because of the service interruption. This means that utility system operators need to take appropriate preventative and corrective measures to avoid or minimize the adverse effects on their customers and the system.
7. Conclusions
System operators frequently prefer LC when power balance is interrupted. N − 1 line failures is implemented to the bulk power system in this paper, and optimal LC using PSO and GWO is proposed. PSO and GWO possess major advantages over other metaheuristic techniques such as ease of implementation, fewer parameter tuning, robustness for wide range of optimization problems, and versatility to handle multiple problems. When applied to high-dimensional and complicated optimization problems, these techniques have shown to have fast convergence rates. On applying these techniques and comparing it with the analytical approach, the reliability indices (EENS, EDNS, BPECI, MBPCI, EIC) are significantly improved, and %LC is reduced from 17.83% to 7.3% (PSO) and 5.5% (GWO). Least reliable buses are also identified in this paper, as evidenced by high LC values and higher reliability index values. Also, single-area and multiarea reliability analyses are carried out considering N − 1 contingency. The performance of interconnected tie lines is also evaluated. RBCA is performed in order to assess the severity of transmission lines’ outage and their impact on the system. Furthermore, the role of FTRs on HR transmission lines is analyzed, and a comparison is performed with the existing STR system on the multiarea system. The severity of transmission lines with FTRs is reduced significantly, and the risk associated with their outage is also alleviated. Therefore, LC associated to line outages can be reduced substantially and reliability of the system at the N-1 contingency level can be enhanced considering FTRs. Customers’ monetary losses due to component failures can be assessed through reliability cost evaluation by factoring in customer interruption costs. For the proper planning and operation of the electric power system, it is crucial to conduct such research to comprehend the actual system reliability status. Moreover, upgrading the capacities and operations of the existing grids and making them more flexible are both necessary in order to meet the fluctuating load demand under different operating conditions. The FTR concept can be greatly applied under changing weather conditions to possess reliability improvement of the existing grid under line outage conditions. The proposed RBCA model adaptability ensures long-term relevance, making it a valuable tool for managing and improving reliability in dynamic and evolving power grids.
The proposed approach focuses on the N − 1 criterion; however, modern power systems often face multiple contingencies (N − k failures), which require more complex risk assessment models to account for interdependencies and cascading effects in multiarea systems. Such scenarios significantly increase computational complexity, necessitating advanced optimization techniques to prioritize LC effectively while maintaining system reliability. Additionally, the stochastic nature of operating conditions poses challenges for optimization techniques, highlighting the need for hybrid meta-heuristic methods, such as PSO and GWO, integrated with adaptive parameter tuning to enhance the performance of the proposed RBCA model. Furthermore, the increasing reliance on renewable energy sources introduces uncertainty and variability in generation, adding to the complexity of contingency analysis and optimal LC. The proposed model’s computational efforts, especially for multiple iterations and high-dimensional multiarea networks, can be substantial, warranting further enhancements for improved scalability and efficiency.
Nomenclature
-
- LC
-
- Load curtailment
-
- RBCA
-
- Risk-based contingency analysis
-
- RI
-
- Risk index
-
- STR
-
- Static thermal rating
-
- FTR
-
- Flexible thermal rating
-
- PSO
-
- Particle swarm optimization
-
- GWO
-
- Gray wolf optimization
-
- EENS
-
- Expected energy not supplied
-
- EDNS
-
- Expected demand not served
-
- BPECI
-
- Bulk power/energy curtailment index
-
- MBPCI
-
- Modified bulk power curtailment index
-
- EIC
-
- Expected interruption cost
-
- LDF
-
- Load damage function
-
- RTS
-
- Reliability test system
Conflicts of Interest
The authors declare no conflicts of interest.
Funding
No funding was received for this manuscript.
Open Research
Data Availability Statement
The data that support the findings of this study are available from the corresponding author upon reasonable request.


