A Hybrid PV/Fuel Cell–Fed Multiport DC-DC Converter for Water Irrigation Application
Abstract
This paper introduces a novel hybrid multiport converter (MPC) for water irrigation systems. The proposed MPC is characterized by its simplicity and the ability to maintain a consistent DC-link voltage. A power management technique has been developed to ensure the maximum power utilization sources even if either one of the sources is absent and simultaneously manages power demanded by the load. This technique facilitates active power sharing, rapid output voltage control, and handling the load disturbances. The proposed converter’s performance is assessed through simulation tools and experimental validation for a 1-kW system, considering three different scenarios. Thus, the proposed converter achieves high gain, high efficiency of 96%, and faster dynamic response.
1. Introduction
The fast phase of industrialization and population explosion in a country such as India requires huge electricity demand. The minimum availability of conventional sources, frequent increases in energy tariffs, the increase in energy demand, and global warming force the nation toward renewable energy (RE) sources [1]. However, RE sources are uncertain, and the widely preferred RES are wind, photovoltaic, and fuel cell (FC) [2]. The rising importance and awareness of the RE sources are driving independence in energy and security. Among RE, the photovoltaic source has low maintenance and a high yield of power for 20 years resulting in high reliability [3]. This feature is best suited for the agriculture sector, especially for water irrigation systems. Wheat production generally needs water for 4 months. One kg of wheat requires 500–4000 L of water throughout its growth period. For example, one acre of wheat land produces 9.18 quintals equivalent to 918 kg. Therefore, 36,72,000 L of water are needed for the whole wheat growth period. So, on average, 30,600 L of water are needed per day [4]. The motor running 10 hours daily, resulting in 3000 liters per hour, serves as the design constraint for the proposed topology.
At first, direct connection of a PV array with a DC motor is quite popular for irrigation systems [5]. However, the load line of the motor pump does not match the maximum power point of the PV array. So, the DC converter is inevitable for the solar PV irrigation system because it extracts the maximum power from the solar system. In [6], the comparison between direct connection and the voltage source controlled based water pumping system is given. The article concluded that voltage source controlled conventional boost converter [CBC]–based water pumping system has low DC-link ripple, less torque ripple, and maximum power extraction from the RE source. In [7], the PV with CBC and 3φ voltage source inverter IM drive is given. This system has a less reliable power supply because the source is not the same all the time. It is fluctuating in nature. Also, the induction motor has a maximum efficiency of 90%, and a high weight-to-torque ratio is the drawback of this system. In [8], PV with CBC and 3φ NPC inverter fed IM drive is explained. The single inductor on the input side has high current stress. Failure to the switch in the CBC makes the system shut down. The five-level NPC inverter has more number of switches to control. So, the overall circuit is complex. In [9], two inductors are used instead of a single inductor, thus less current stress. However, the drawback is that the transformer is included, which increases the size and cost of the system. In [10], PV with the CBC and voltage source inverter-fed induction motor-based water pumping application is given. In this article, the main drawback is a single source, and all the required power to the load is delivered by the PV alone; thus, the current stress in the switch and the inductor is high [11]. The grid-tied DFIM drive system for the water pumping system is explained. Here, the control of all the switches is extremely complex, and the system is based on grid ties and DFIM which is not possible in remote areas. In [12], single source PV with Zeta converter and 3φ voltage source inverter fed BLDC drive is explained. The main drawback of the system is less reliable in PV power. The motor has a high torque ripple because of power fluctuation. In [13], single source PV with the Sepic converter fed SRM motor drive system is given. The proposed converter has a coupled inductor and is less reliable to the PV system, which are the main drawbacks of the system. Thus, multiport input is needed for PV-based water pumping applications. In [14], PV with a grid-fed BLDC motor-fed water pumping system is given. Dependent on the grid when PV is unable is the main drawback of the system. Because, in remote areas, if one switch fails, the system comes to a halt. In [15], PV and grid fed SyRM-based water pumping system are explained. However, the motor has back emf issues and complex control, and a high-power grid is not possible in remote areas. In [16], the complex DC-DC converter with a VSI-fed BLDC motor for water pumping application is given. The single source Luo converter and BLDC motor drive are given in [17]. The single source is the main drawback of the system. In [18], PV with battery is the source for the IM drive-based water pumping system. The system has a fast dynamic response and reliable motor operation throughout the day.
Various multiport DC-DC converters are presented in [19–21]. All these converters are high gain dual input single output DC-DC converters. The advantage is continuous power delivered to the load. Less current stress in the inductor and the switches are the advantages of this converter. In [22], various types of the DC-DC converter are reviewed. Integrated energy management features in multiport converters (MPCs) are one of the key features proposed in [23]. If one of the inputs is considered a battery, then the cost, its life, and recycling problem drive us to a combination of PV/wind or PV/FC or PV/wind/FC RE source. PV along with FCs is the best possible solution for water pumping applications when compared to all other RE sources because FC has very high energy density (W/kg) as shown in Figure 1. Also, this combination provides zero carbon at the output, giving us the way towards sustainable development in the green technology.
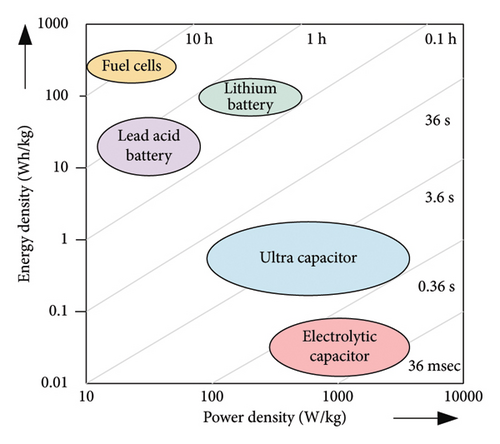
Thus, by reviewing the kinds of literature, multiple RE sources such as PV and FC are needed for a continuous power system. Also, BLDC motor drive is especially suitable for the water pumping application because of its high efficiency and low weight-to-torque ratio. Thus, implementing energy management techniques for solar PV and FC for water pumping applications for BLDC motors is presented in this article.
- i.
Two independent RE sources’ (PV and FC) power extracted using a single converter.
- ii.
The proposed converter has high efficiency and fast dynamic performance during variation of either load or source or both.
- iii.
Coordinating and transitioning between the different modes is crucial to the system design.
- iv.
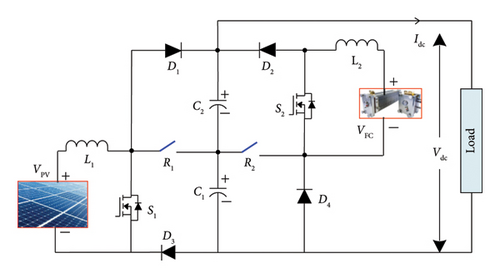
In DISOC, it uses fewer components, and the use of relays with DISOC is unique in the structure, and it performs three different cases with six modes of operation.
- v.
The analysis of power loss and efficiency of DISOC are calculated and compared with conventional MPCs.
- vi.
Operates in the continuous conduction mode (CCM).
Section 2 introduces novel DISOC for solar water pumping applications. Section 3 proposes the modes of operation of DISOC during different types of cases. Section 4 proposes the EMT with its flowchart for transition between cases. Section 5 discusses the selection of the BLDC motor for water pumping application. Section 6 discusses the implementation of the 1 kW prototype using simulation and experimental results. It also includes a comparative analysis of the DISOC system conventional MPCs. Finally, Section 7 concludes the research, outlining potential future directions for this work.
2. Proposed Topology and Various Cases
-
Case I: PV source available (R1 − R2 = OFF).
-
Case II: FC available (R1 − R2 = OFF).
-
Case III: Both PV and FC available (R1 − R2 = ON).
-
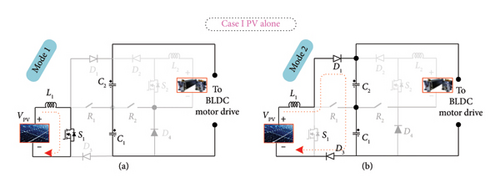
Case I: PV sources are available, and R1 − R2 are opened. Furthermore, the S1 regulates the DC link voltage (C1 + C2) w.r.t load requirement, and S1 will be turned on and off during modes 1 and 2, respectively, as shown in Figure 3. The output load current Idc is equal to the IL1 (avg).
-
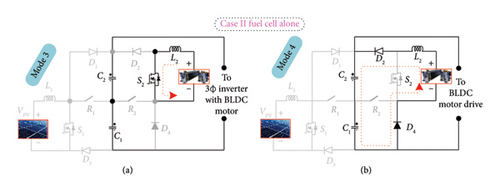
Case II: FC sources are available, and R1 − R2 are opened. Further, the S2 regulates the DC link voltage (C1 + C2) w.r.t load requirement, and S2 will be turned on and off during modes 3 and 4, respectively, as shown in Figure 4. The output load current Idc is equal to the IL2(avg).
-
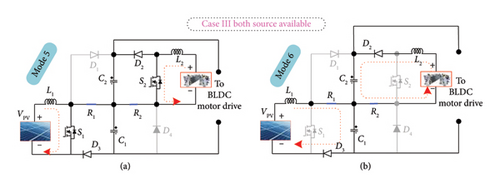
Case III: Both sources are available, and R1 − R2 are closed. Further, the S1 and S2 regulate the DC link voltage (C1 + C2) w.r.t load requirement, and S1 and S2 will be turned on and off during modes 5 and 6, respectively, as shown in Figure 5. The output load current Idc is equal to the IL1(avg) and IL2(avg).
3. Modes of Operation
-
Case I: S1 operates in Mode 1. The voltage and current expression during Case I for the waveform shown in Figure 6 are as follows.
()() -
By solving (2) using volt-sec and current-sec balance equations, the voltage gain is obtained in the following equation.
() -
where D1 is the duty cycle of S1.
-
The inductor ripple current ∆IL1 is derived from (1).
()() -
The inductor current IL2 is zero during the case I.
-
Average and RMS switch current:
() -
The switch current IS1 wave form is shown in Figure 6.
-
The output ripple voltage ∆Vdc = ∆VC is derived from (1).
() -
On integrating (7),
() -
Critical inductance LC1 and critical capacitance CC1:
-
The value of LC1 at which the inductor current is zero is called critical inductance.
() -
On solving (9), critical inductance (LC1) is
() -
The L1 and L2 are chosen greater than the LC1. The CC1 at which the capacitor voltage is zero is called critical value of capacitance.
() -
On solving (11), critical capacitance is
() -
The values of capacitor C1 and C2 are chosen greater than the CC1.
-
Case II: During this case, the FC alone is available, and Relays 1 and 2 are open. The S2 is used to control the DC link voltage Vdc. The converter follows the same equation as that of case I. The switch current IS2, diode current ID2, and capacitor current IC2 waveforms are shown in Figure 6.
-
Case III: During this case, both sources are active. Both S1 and S2 are operating as shown in Figure 6.
()()() -
By solving the above equation using volt-sec balance and current sec balance equations,
-
Output DC link voltage is
()() -
where D2 is the duty cycle of S2.
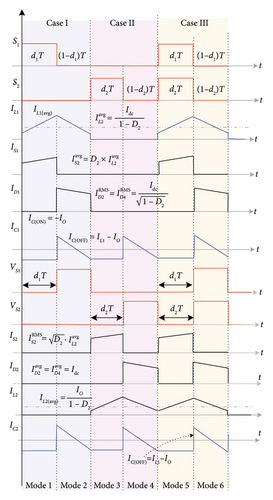
Table 1 shows the consolidated RMS and average current and voltage equations of the inductor, the diode, and switches during all the cases.
| Equation | Case I | Case II | Case III |
|---|---|---|---|
| Output voltage, Vdc | VPV/(1 − D1) | VFC/(1 − D2) | VPV/(1 − D1) + VFC/(1 − D2) |
| Inductor current, IL | |||
| Ripple in inductor current, ΔIL | ΔIL1 = (VPVD1/fL1) | ΔIL2 = (VFCD2/fL2) | ΔIL1 = (VPVD1/fL1) & ΔIL2 = (VFCD2/fL2) |
| Average switch current, | |||
| RMS switch current, | |||
| Average diode current, | |||
| RMS diode current, |
4. Proposed EMT
The algorithm of EMT for DISOC is based on the case which we are operating. Initially set the minimum and maximum voltage for the PV array and also set the minimum and maximum voltage for the FC. Measure the actual from the solar array and from the FC. Use the MPPT algorithm to decide the maximum power point voltage.
Since the proposed converter is used for constant load water pumping application, the energy management strategy is implemented for load of 1000 W. The water pump is operated in the daytime for 4 h to pump the ground water to overhead tank for irrigation (Algorithm 1).
-
Algorithm 1: Energy management strategy for a water pumping system.
-
Start- > Monitor PV Output
-
If PV > 1000 W (case I)
-
PV delivery 1000 W power to water pump (1000 W)
-
Else if 100 < PV < 1000 W (case III)
-
PV deliver its Maximum power (PPV) at that time.
-
Remaining power (Pload − PPV) is delivering power to the water pumping application.
-
Else if PV < 100 W (case II)
-
FC deliver 1000 W power to water pump (1000 W)
-
End of algorithm
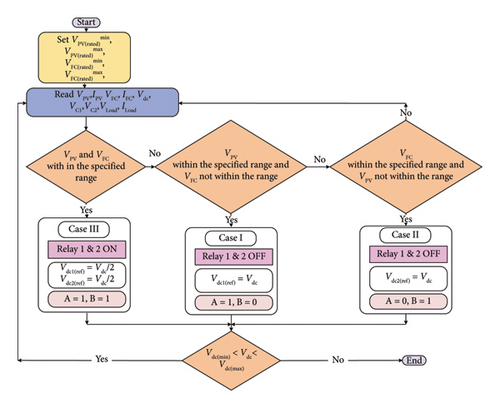
Use the logic comparator to find the different cases. Once the case is determined, relays R1 and R2 are operated based on the flow chart of proposed EMT shown in Figure 7. Fix the reference voltage for each case. Output voltage of DC link capacitors and results in identification of D1 and D2 for switches S1 and S2. As shown in Table 2 selection of source, if AB = 00, then no change in case; if AB = 01, then choose FC only; if AB = 10, then chose PV only; if AB = 11, then choose both PV and FC.
| A | B | Case |
|---|---|---|
| 0 | 0 | — |
| 0 | 1 | FC alone |
| 1 | 0 | PV alone |
| 1 | 1 | Both PV and FC |
5. BLDC Motor for Water Pumping Application
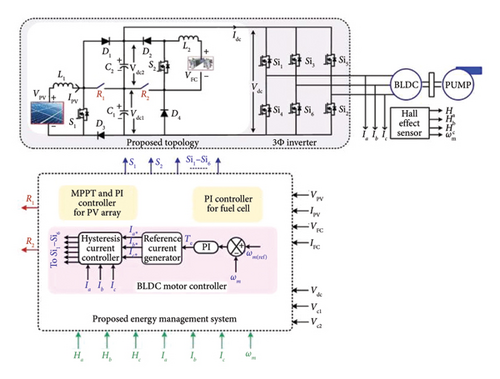
BLDC motors have witnessed remarkable growth in recent years owing to their versatility, efficiency, and low maintenance requirements. This section aims to provide a BLDC motor for water pumping application. The detailed schematic diagram of the PV/FC-fed BLDC motor drive system is shown in Figure 8.
5.1. BLDC Motor for the Submersible Pump
5.2. Design of Solar PV
Each solar cell typically produces voltage of (0.46–2) V and current of 0.833 A. So, the solar module of 120 W consists of 12 series solar cells and 6 parallel solar cells to produce a voltage of 24 V and power (213.15 W) = 29 V∗7.35 A.
Number of cells in the module = 60.
For 1200 W of solar power = (Ns∗Vmpp)∗(Np∗Impp).
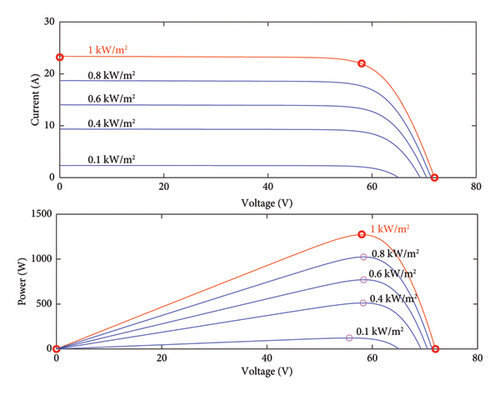
A total of 6 number of 213.15 W solar modules is used. Table 3 shows the specification of the PV array used for designing the topology for water pumping application.
| Quantity | Symbol | Value | |
|---|---|---|---|
| Open circuit voltage | Voc | 72 V | |
| Short circuit current | Isc | 23.2 A | |
| MPP voltage | Vmpp | 58 V | |
| MPP current | Impp | 22 A | |
| Number of modules | Series | Ns | 2 |
| Parallel | Np | 3 | |
Again, we need the solar array for 1.2 times greater than the actual BLDC motor rating. So required solar array power = 1.2∗1000 W = 1200 W. The solar array generating power for different irradiations is shown in Figure 9.
5.3. Design of FC
Each FC produces a voltage of about 0.6–0.8 V under normal operating conditions. However, the theoretical voltage for a hydrogen FC should be 1.23 V. The voltage drops as the current flows. PEMFCs are built out of electrodes, catalyst, electrolytes, and gas diffusion layers.
5.4. PI Controller Design
As derived in (32) and (33), similarly, the steady state output equation, input current , the small signal model, and the transfer function can be found for case II also.
5.5. Electronic Circuits
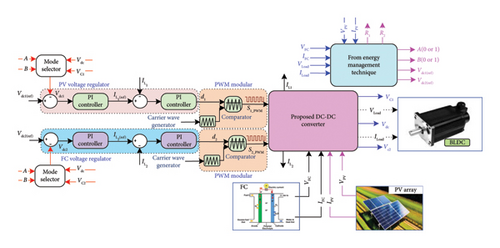
The detailed voltage and current controller with energy management technique is shown in Figure 10. During case I, the sensed capacitor voltage VC1 and Vdc is given as feedback to the comparator, which is compared with Vdc1(ref). The error signal is taken as input to the compensation circuit. The control reference inductor current is generated from the compensation circuit and given to the PWM circuit to generate the gate signal. The generated gate signal from the PWM controller has the magnitude of 3.3 V, which is not enough to drive the MOSFET switch. So, further amplification is performed in the gate driver circuit and fed to the MOSFET switches S1 and S2. Figure 11 shows the time response of the transfer function of (39); from the figure, the peak overshoot of the converter is 66.67% and the steady state error of 2% of its final value. The response of the transfer function is without compensation. The poles and zeros of DISOC are shown in Figure 12.

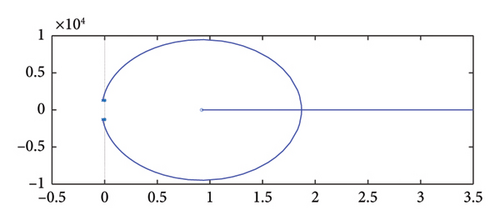
The figure shows the zeros in the right half of the s-plane, so we need to include the compensation circuit.
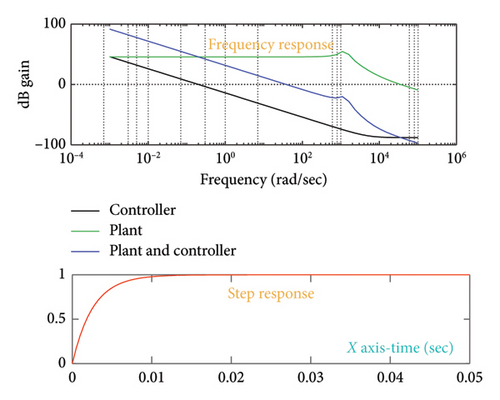
Figure 13 shows the frequency response of the plant and the controller and the step response of the proposed converter. It shows that the peak overshoot without the PI controller is 66.67%, and it is reduced to almost 0%. Similarly, the steady state error without the PI controller is given as 2%, and it is reduced to almost 0%.
6. Results and Discussion
6.1. Simulation Results
6.1.1. Steady State Response
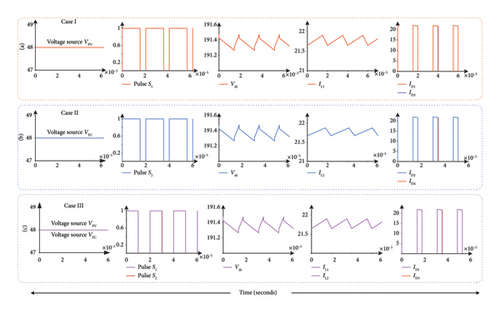
The PV/FC-combined MPC is simulated in MATLAB, and the current and voltage waveforms of all the components have been analyzed. DISOC consists of a 1 kW solar PV array that is fed by an 800 W BLDC motor that runs at a speed of 125 rad/sec. Various simulated waveforms during different cases are shown in Figure 14.
6.1.1.1. Simulation Waveform of Case I
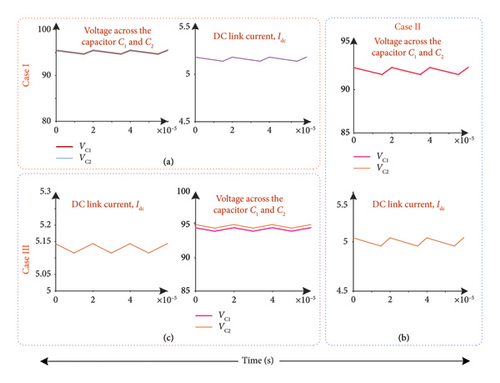
The simulation waveform shown here is operated at 1000 W/m2 irradiance and 25°C temperature. Throughout the simulation, the solar irradiance of 1000 W/m2 is assumed, so the voltage across the PV source is constant with the voltage value of 48 V. During this case, the pulse to S1 with D1 = 0.75 T and also the Vdc across the C1 and C2 is equal to 191.2 V with 1% of ripple. The current through the inductor is increasing for the time period 0.75 T and decreasing for the remaining time period. The diodes D1 and D3 are turned on only when the switch S1 is off. The simulated waveform of Case I is shown in Figure 14(a). The voltages and are 96 V for case I, as shown in Figure 15(a).
6.1.1.2. Simulation Waveform of Case II
During case II, the source PV is not available, whereas FC is delivering the power to the BLDC motor. At starting, the FC takes 0.3 s to deliver its rated voltage of 48 V. The simulation is carried out by considering the FC that delivers constant voltage of 48 V. During this case, the pulse to S2 D2 is equal to 0.75 and also the Vdc across C1 and C2 is equal to 191.2 V. The current through the inductor is increasing for the time period 0.75 T and decreasing for the remaining time period. The diodes D2 and D4 are turned on only when the switch S2 is off. The simulated waveform of Case II is shown in Figure 14(b). The and are 96 V for case I, as shown in Figure 15(b).
6.1.1.3. Simulation Waveforms of Case III
Both sources PV and FC are available, during case III. The simulation is carried out by considering PV that receives the constant irradiation of 1000 W/m2 and the FC delivering the rated voltage of 48 V. Both D1 and D2 are equal to 0.5, and the DC link voltage across the capacitor C1 and C2 is equal to 191.2 V with 1% of ripple. The current through the inductor increases for the time period 0.5 T and decreases for the remaining time period. The diodes D2 and D3 are turned on only when the switches S1 and S2 are off. The simulated waveform of Case III is shown in Figure 14(c). The voltage across the capacitor is 96 V for case I, as shown in Figure 15(c).
6.1.2. Dynamic Response
In Figure 16, various parameters on the PV side are shown. Figure 16(a) shows the power deliver by the FC. Figure 16(b) shows the inductor current IL1 of 20.8 A up to 0.02 s and after 0.02 s the inductor current IL1 of 16.67 A. PV alone operates to deliver the power to the load. After 0.02 s, the PV can able to deliver the power of 800 W, so D1 = 0.5, and the remaining 200 W of power is delivered by the FC. Figure 16(c) shows the power delivered to load from the PV side. Figure 16(d) shows the PWM pulse given to switch S1. Figure 16(e) shows the output voltage from the PV side. Upto 0.02 s, the PV side maintains 192 V, and after 0.02 s, the capacitor C1 is maintained as 96 V by PV since the converter operates in case III. Figure 16(f) shows the output current delivered from the PV side. Up to 0.02 s, the output current of 5.083 A is maintained, and after 0.02 s, the output current of 8.9 A is maintained.
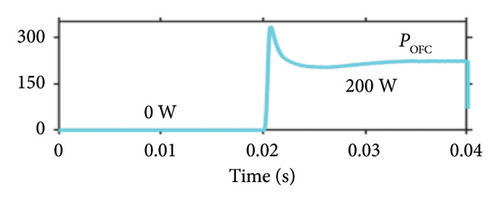
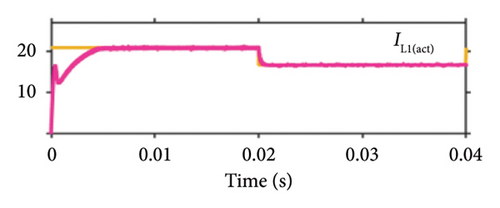
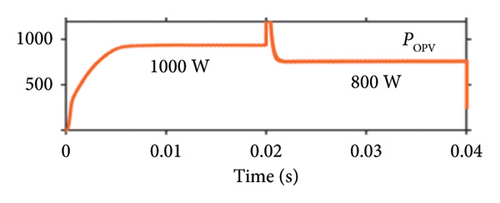
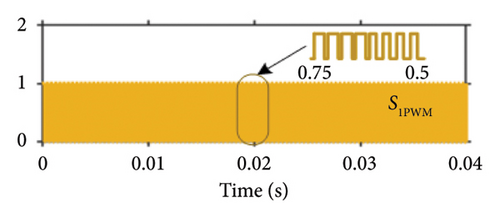
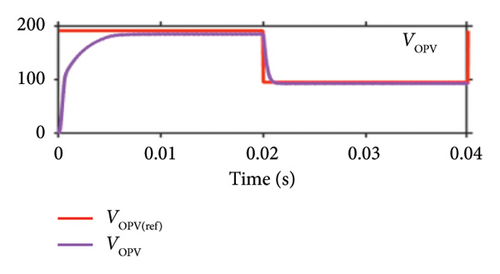
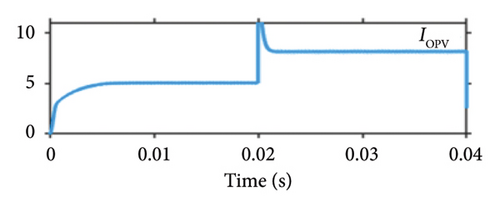
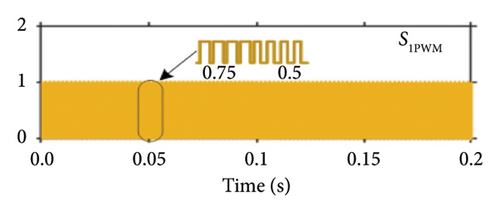
Figure 17 shows the dynamic response with respect to energy management in the PV side. At time t = 0 s, the solar irradiation is 1000 W/m2; thus, the energy management system decides that the converter operates in case I by turn of both relay and providing 1000 W to the BLDC motor. Thus, the PV operates at 50 V as shown in Figure 17(a) and provides 1000 W to the load as shown in Figure 17(f). The voltage across the capacitors C1 and C2 is 192 V as shown in Figure 17(b). During case (I), the inductor L1 operates at the current of 20.8 A as shown in Figure 17(e). The PWM pulse of switch S1 is shown in Figure 17(c). Up to 0.02 s, the duty cycle of 0.75 is maintained, and after 0.02 s, the duty cycle of 0.5 is maintained as shown in Figure 17(d).
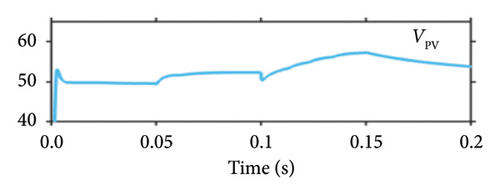
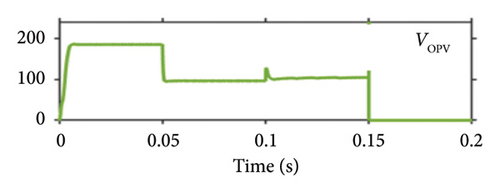
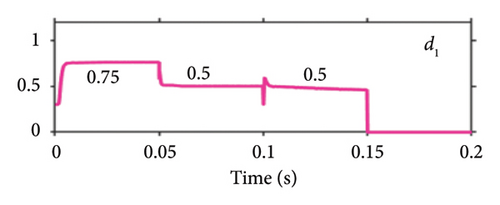
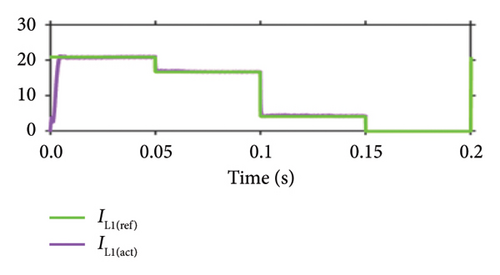
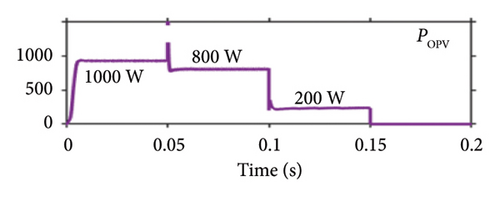
At time t = 0.05 s, the solar irradiation is reduced to 800 W/m2. Now, the maximum energy delivered by PV is 800 W. Thus, the energy management system decides which converter to operate in case (III). Now, the maximum power of 800 W is delivered by PV, as shown in Figure 17(f). Now, the relays R1 and R2 are turned on. The voltage across the capacitor C1 is maintained by PV as 96 V as shown in Figure 17(b). The voltage across the capacitor C2 is maintained by the FC as 96 V. Thus, the total voltage across the capacitors C1 and C2 will be 192 V. At time t = 0.1 s, the solar irradiation is further reduced to 200 W/m2. Now, the solar PV can deliver 200 W, and the remaining 800 W is delivered by the FC, and the converter operates in case (III). Now, at time t = 0.15 s, the solar irradiation is zero. Now, the converter operates in case (II), and the FC delivers all the required power to the load.
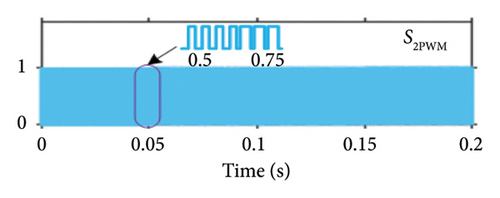
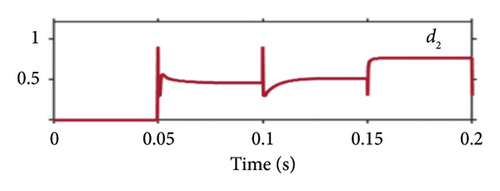
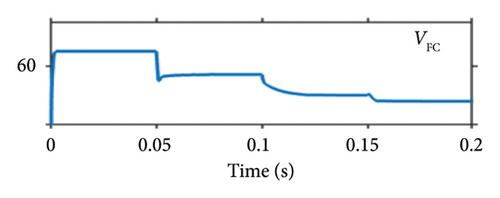
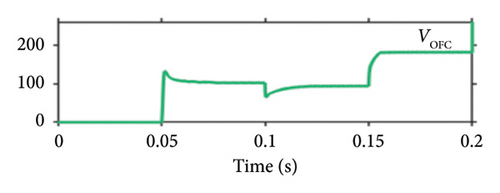
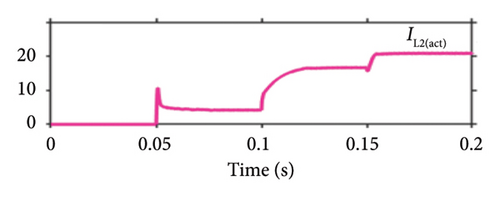
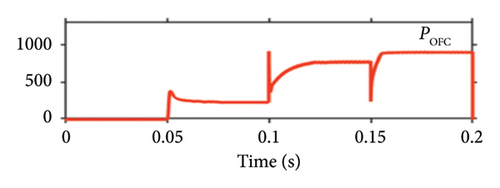
Figure 18 shows the dynamic response with respect to energy management in the FC side. At time t = 0 s, the solar irradiation is 1000 W/m2; thus, the energy management system decides that the converter operates in case I. Thus, the FC operates at 64 V as shown in Figure 18(c) and provides 0 W to the load as shown in Figure 18(f). At time t = 0.05 s, the solar irradiation is 800 W/m2, and the converter operates in case (III). The PV side can able to provide 800 W, and 200 W is provided by the FC as shown in Figure 18(f). The duty cycle of 0.5 is maintained as shown in Figure 18(b). The voltage across the capacitor C2 is 96 V, which is maintained by the FC as shown in Figure 18(d), and the inductor current of 4.13 A is delivered as shown in Figure 18(e). At time t = 0.15 s, the converter operates in case (ii), and the FC delivers the required power to load as shown in Figure 18. The PWM pulse of switch S2 is shown in Figure 18(a).
6.2. Experimental Results
The solar emulator ITECH solar array SAS1000L is used as one input for the PV array, which is shown in Figure 19. The FC is used to provide a second input to the converter, and the DISOC prototype is constructed in a lab to assess the performance. The controller TMS320 F2837D, C2000 Launch Pad XL generates the switch and relay signal based on the availability of the source. Table 4 shows the hardware prototype parameter.

| Component | Parameter |
|---|---|
| Switching frequency, Fsw | 50 kHz |
| Inductor L1/L2 | 250 μH |
| Capacitor C1/C2 | 300 μF |
| Power MOSFET, S1, S2 | IRFP4137PbF |
| Power diode (D1 − D4) | LQA30T300 |
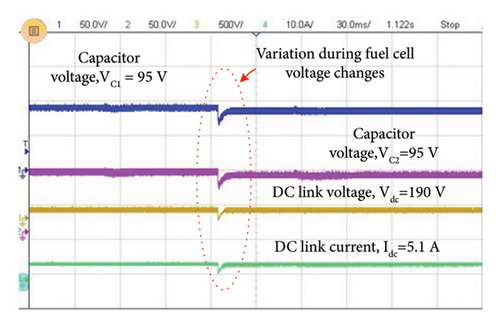
Figure 20(a) shows the experimental waveforms for VC1, VC2, Vdc and current Idc for the constant irradiation of 1000 W/m2. Figure 20(b) shows the VC1 and VC2 during the change in solar irradiation. The maximum capacitor voltages VC1 and VC2 during this case are 95.9 and 96.3 V, respectively. Vdc = 190.9 V, and the DC link current is 5.24 A during normal operation. During transient operation, the capacitor voltages VC1 and VC2 are 95 and 95 V, respectively. Figure 20(c) shows the waveforms of the S1, having D1 with 0.75, capacitor current IC1, and diode current during case I.
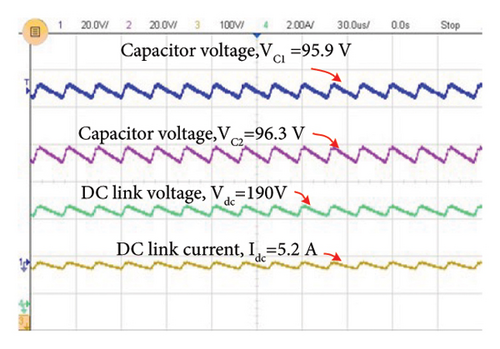
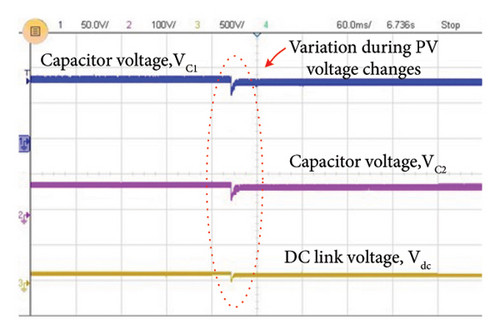
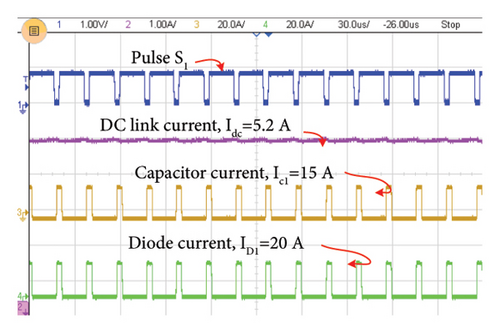
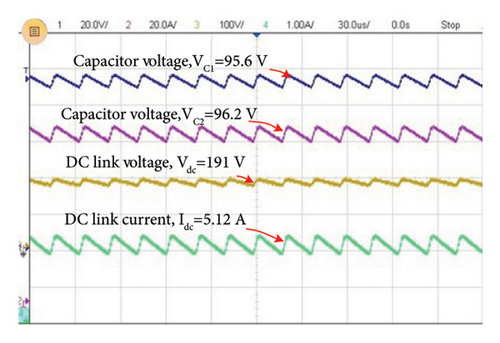
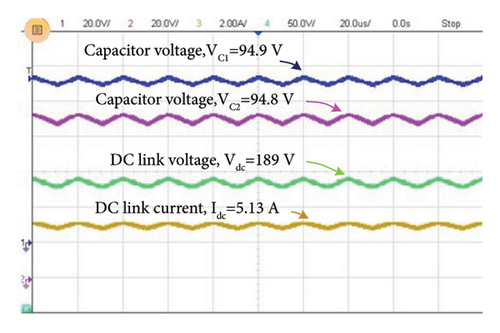
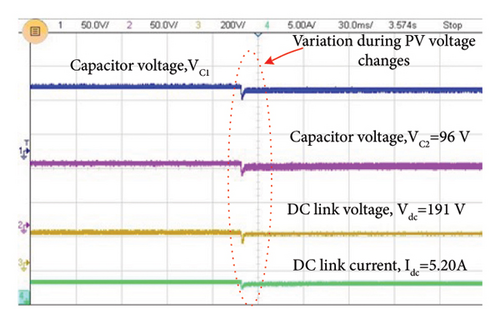
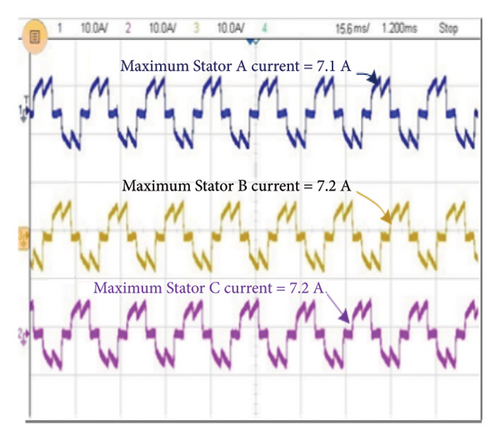
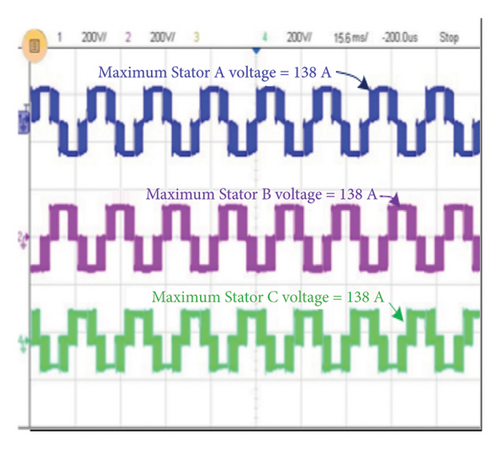
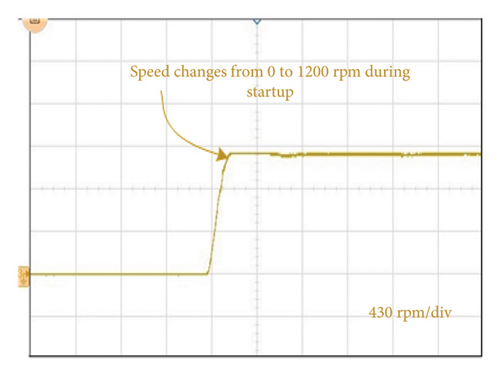
Figure 21(a) shows the experimental waveforms of the VC1, VC2, Vdc, and current Idc of proposed converter topology during case II. Figure 21(b) shows the capacitor voltage VC1 and VC2 during the transient operation of input to the FC. The maximum capacitor voltages VC1 and VC2 during this case are 95.6 and 96.2 V, respectively. The Vdc = 191 V, and the Idc is 5.12 A during normal operation. During transient operation, the capacitor voltages VC1 and VC2 both are maintained at 95 V, respectively. During case III, when both sources are available, the voltage across the capacitors C1 and C2 is shown in Figure 22(a). Also, Figure 22(b) shows the change in the capacitor voltages VC1 and VC2 during change in irradiation. Figures 23(a) and 23(b) show the stator voltage and stator current of the BLDC Motor. Figure 23(c) shows the change in speed from 0 to 1200 rpm during starting.
6.3. Power Loss Analysis
So, the total power loss of the diode D1 = 4.5488 W.
So, total power loss PTLoss1 = 41.1141 W.
Similarly, the power loss of the individual component and efficiency of all other cases are calculated and tabled in Table 5.
| Components’ power loss (W) | Case I | Case II | Case III |
|---|---|---|---|
| PS1 | 29.08 | — | 5.96 |
| PS2 | — | 28.54 | 5.86 |
| PD1 | 4.5488 | — | — |
| PD2 | — | 4.612 | 2.46295 |
| PD3 | 4.742 | — | 2.3426 |
| PD4 | — | 4.452 | — |
| PL1 | 0.6922 | — | 0.62 |
| PL2 | — | 0.6913 | 0.59 |
| PC1 | 0.181 | 0.1946 | 0.066 |
| PC2 | 0.2423 | 0.1766 | 0.072 |
| TPLoss | 41.1141 | 40.4052 | 17.97 |
| Efficiency | 94.2% | 95.1% | 96.29% |
- Note: PS1 − PS2: power loss in the switches S1 − S2; PD1 − PD4: power loss in the diodes D1 − D4; PL1 − PL2: power loss in the inductors L1 − L2; and PC1 − PC2: power loss in the capacitors C1 − C2. TPLoss: total power loss during the operating case. C: no conduction of the device during the operating case.
Efficiency for various load power for three different scenarios is shown in Figure 24. The efficiency of the proposed converter when PV alone delivers the power to the load is measured as 95.1% at 1000 W. When the FC alone delivers, the power to the load is given as 95.3% at 1000 W. Similarly, the efficiency plot for various load power starting from 200 to 1400 W is measured.
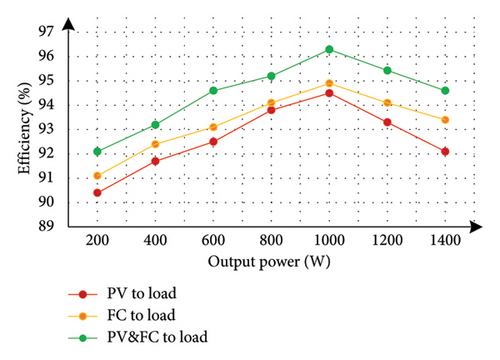
Figure 25 shows the duty cycle versus efficiency. During Case I, PV alone is operating, and its duty cycle varies from 0.6 to 0.85. During Case II, the FC alone is operating, and its duty cycle varies from 0.7 to 0.8. During case III, both PV and FC are operating, and its duty cycle varies from 0.35 to 0.75. Figure 26 shows the efficiency versus inductor value. The efficiency is maximum at the inductor value of 250 μH for all the cases.
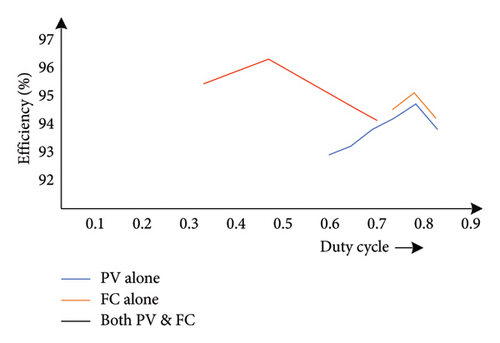
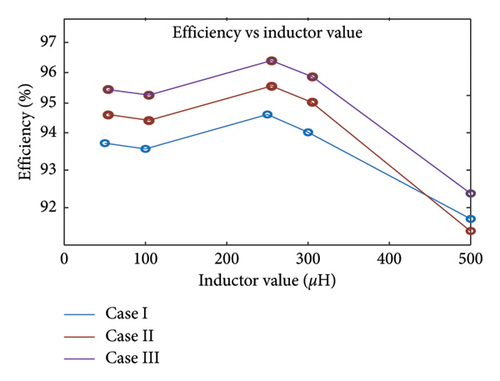
Table 6 shows the comparative analysis of the presented structure with the other previously existing topologies. The proposed converter topology has high efficiency and high gain when compared to other topologies and is operated with a BLDC motor. But voltage and current controller is implemented, and it has faster dynamic response of 0.01 s for every change in input. The nature of control is complex for [8, 11, 15], whereas the proposed converter is less complex. The article [8–10, 18] operates with an induction motor which is heavier, low power factor. In [18], battery is one of the inputs, which is less reliable because of battery life when compared to the proposed converter.
| Ref | A | B | C | D | E | F | G | H | I | J | K | L | M | N | O |
|---|---|---|---|---|---|---|---|---|---|---|---|---|---|---|---|
| [6] | 1 | 1 | 91% | Low | 1 | PMDC | Voltage | 1000 | ✓ | ✓ | ✗ | ✗ | ✗ | ✓ | Medium |
| [8] | 1 | 1 | NA | Low | 1/(1 − d) | IM | Voltage | 7500 | ✓ | ✓ | ✗ | ✗ | ✗ | ✓ | Complex |
| [9] | 1 | 1 | 93.6% | Low | (2(Ns/Np) + 1)/(1 − D) | IM | Hysteresis and voltage control | 210 | ✓ | ✗ | ✗ | ✗ | ✗ | ✓ | Medium |
| [10] | 1 | 1 | 84.6% | Low | 1/(1 − d) | IM | Null | 2200 | ✓ | ✓ | ✗ | ✗ | ✗ | ✓ | Medium |
| [11] | 1 | 1 | 89.8% | High | NA | DFIM | Voltage and current | 2200 | ✗ | ✗ | ✓ | ✗ | ✗ | ✓ | Complex |
| [12] | 1 | 1 | 83% | Low | 1/(1 − d) | BLDC | Null | 2890 | ✓ | ✓ | ✗ | ✗ | ✗ | ✓ | Medium |
| [13] | 1 | 1 | 92.7% | Low | (1 + D)/(1 − D) | SRM | Null | 1390 | ✓ | ✓ | ✗ | ✗ | ✗ | ✓ | Medium |
| [14] | 2 | 1 | NA | Low | 1/(1 − d) | BLDC | Voltage and current | 1300 | ✓ | ✓ | ✗ | ✗ | ✗ | ✓ | Medium |
| [15] | 2 | 1 | NA | Low | 1/(1 − d) | SyRM | Voltage and speed | 4000 | ✓ | ✓ | ✓ | ✗ | ✗ | ✓ | Complex |
| [16] | 1 | 1 | NA | Low | (1 + D)/(1 − D)2 | BLDC | Null | 600 | ✓ | ✓ | ✗ | ✗ | ✗ | ✓ | Medium |
| [17] | 1 | 1 | NA | Low | D/(1 − D) | BLDC | Null | NA | ✓ | ✓ | ✗ | ✓ | ✗ | ✓ | Medium |
| [18] | 2 | 1 | 89% | High | 1/(1 − d) | IM | Voltage | 7500 | ✓ | ✓ | ✓ | ✓ | ✓ | ✗ | Medium |
| Pro. | 2 | 1 | 96% | High | 2/(1 − d) | BLDC | Voltage and current | 1000 | ✓ | ✓ | ✓ | ✗ | ✗ | ✓ | Medium |
- Note: A: number of input port, B: number of output port, C: efficiency, D: initial cost, E: voltage gain, F: type of motor, G: controller, H: power rating(watt), I: solar panel, J: MPPT, K: continuous power flow, L: bidirectional, M: battery, N: null environmental waste, O: nature of control, and NA: not available.
The comparative analysis based on features is shown in Table 7. Induction motor-based water pumping with a single source is given in [8–11, 18]. There is a high current stress in the inductor of the CBC because of a single power source. The CBC-based water pumping system and single source are given in [8] and [10]. In [9], the transformer is used for voltage control. Thus, the overall size of the system increases. On comparison of all the dimensions, one can conclude that a multiinput renewable power supply fed CBC for a BLDC motor drive is most suitable for water pumping applications.
| Ref | Topology | Remarks | ||
|---|---|---|---|---|
| Source | DC/DC | DC/AC | ||
| [8] | PV | CBC |
|
✓ Renewable PV source |
| ✗ High current stress in the single inductor | ||||
| ✗ Single source so it is not possible to deliver continuous power to the load throughout the day | ||||
| ✗ Complex control because of a greater number of switches and diodes | ||||
| ✗ IM is rugged but less efficiency than the BLDC motor | ||||
| [9] | PV | TIBC |
|
✓ Renewable PV source |
| ✗ Transformer is included, so converter cost and size are high | ||||
| ✗ Induction motor has less efficiency than the BLDC motor and a high weight to torque ratio | ||||
| ✗ Single source so it is not possible to deliver continuous power to the load throughout the day | ||||
| [10] | PV | CBC |
|
✓ Renewable PV source |
| ✗ Induction motor has less efficiency and high weight to torque ratio. | ||||
| ✗ Single source so it is not possible to deliver continuous power to the load throughout the day | ||||
| [11] | Grid | NA |
|
✗ Huge number of switches, so extreme complex control |
| ✗ DFIM is large in size and has less efficiency | ||||
| ✗ No renewable source | ||||
| ✗ Unit transformer is used, so overall complex, less efficiency, and bulky | ||||
| [12] | PV | Zeta |
|
✓ BLDC motor, high efficiency |
| ✓ Smooth operation | ||||
| ✓ Occupy less space | ||||
| ✓ Less acoustic, easy control, and fast dynamic response | ||||
| ✗ Single source, less reliable in input source | ||||
| [13] | PV | Sepic |
|
✗ SRM motor has high torque ripple and complex control circuitry |
| ✗ Coupled inductor | ||||
| ✗ Overall size is high | ||||
| ✗Single source, less reliable in input source | ||||
| [14] | PV and grid | CBC |
|
✓ BLDC motor, high efficiency |
| ✓ Bidirectional | ||||
| ✓ Smooth operation | ||||
| ✓ Occupy less space | ||||
| ✓ Less acoustic, easy control, and fast dynamic response | ||||
| ✗ Dependent on the grid when PV is not available | ||||
| [15] | PV and grid | CBC |
|
✓ Renewable PV source |
| ✓ Continuous power to load | ||||
| ✗ Complex control and back emf complexity in SyRM | ||||
| ✗ Not suitable for the remote area | ||||
| [18] | PV and battery | CBC |
|
✓ Multiport input, high reliable source |
| ✓ Fast dynamic response when PV fluctuates | ||||
| ✗ Induction motor has a high weight to torque ratio | ||||
| ✗ Less efficiency | ||||
| ✗ Life of battery is 2–5 years | ||||
| Pro. | PV and FC | CBC |
|
✓ Multiport input, high reliable source |
| ✓ Fast dynamic response when PV fluctuates | ||||
| ✓ Continuous power to load | ||||
| ✓ Less acoustic, easy control | ||||
| ✓ Suitable for the remote area | ||||
| ✗ Maintenance of the FC | ||||
- Abbreviations: CBC, conventional boost converter; NA, not available; TIBC, two inductor boost converter.
7. Conclusion
This article presented a DISOC with high efficiency, high gain, and fast dynamic response. The proposed configuration is distinct, enabling it to operate in three different cases and achieve an effective transition between them. This proposed converter discusses the power losses and the converter’s efficiency. The structure proves to work efficiently, even if one source is unavailable. The DISO converter has superior performance for low- to high-power applications. Further, the DISOC is suitable for water pumping systems due to its lower power losses and simple topology. The proposed converter achieves 96.5% efficiency and faster dynamic response of 0.01 s for every step change input. The DISOC is compared with similar converters working for water pumping application, which shows that the DISOC is superior to the converter taken for comparison. However, wide bandgap semiconductors are a key focus for future improvements in the proposed topology. Finally, the simulation results are validated with the experimental lab result energy storage integration, and microgrid and smart grid integration applications are some of the future research.
Conflicts of Interest
The authors declare no conflicts of interest.
Funding
No funding was received for this manuscript.
Open Research
Data Availability Statement
The data used to support the findings of this study are available from the corresponding author upon request.


