A Bilevel Dynamic Pricing Methodology for Electric Vehicle Charging Stations Considering the Drivers’ Charging Willingness
Abstract
The increasing penetration of electric vehicles (EVs) presents both challenges and opportunities for integrated transportation and power systems. This paper addresses the pricing issues of distribution networks and charging stations (CSs) simultaneously, proposing a bilevel noncooperative pricing methodology that considers traffic flow, power flow, and renewable energy integration. Key stakeholders—including distribution networks, CSs, and EVs—are thoroughly analyzed, with EV charging behavior modeled through a combination of charging probability, pricing, detour distance, and charging level. The upper-level model focuses on optimal economic scheduling and calculates locational marginal prices using a power flow trace method. Meanwhile, the lower-level model represents CS price adjustments as a noncooperative game, solved via a greedy algorithm. To validate this pricing methodology, an integrated traffic and power distribution network testbed based on the Dublin area was established. Results demonstrate that the proposed dynamic price of the game (DPG) significantly enhances the EV charging market environment compared to traditional time-of-use tariffs or flat rates. Notably, the DPG improves the profitability and service ratio of CSs located near wind farms, with daily profits for these stations increasing by an average of 17.55% and 17.03% compared to the other pricing mechanisms. Furthermore, the average daily utilization rate of these CSs rose by 7.08% and 6.42%. In terms of promoting renewable energy use and alleviating traffic congestion, the DPG also outperforms the other pricing strategies by effectively adjusting charging prices to influence EV drivers’ charging behavior. This dynamic pricing strategy is poised to be widely applicable in future integrated transportation and power systems with high levels of renewable energy penetration.
1. Introduction
1.1. Motivation
Transportation electrification has received policy support from various countries to decrease the dependence on depleted fossil fuels and reduce greenhouse gas emissions, and become a research hotspot in recent years [1, 2]. In 2017, the UK government announced that new petrol and diesel car sales would be banned by 2040 [3]. Norway has seen the highest electric vehicle (EV) penetration in recent years, with EVs accounting for 48% of new car sales in the first quarter of 2019 [4]. The United States, particularly California, is actively developing incentives to promote EV growth and investment in charging infrastructure [5]. Several Asian countries, such as China and Japan, have also set ambitious market share targets for EVs [6, 7].
Unlike traditional vehicles, EVs have more diversified electricity sources, especially renewable energy generation, and their internal electrical systems are swifter and more controllable [8]. Furthermore, advanced communication technologies (e.g. 5G cellular networks) [9], GPS facilities, and intelligent metering infrastructures [10] make it possible for bidirectional data exchange between the power network, transportation network, and EV drivers. In this context, as dynamic loads and potential energy buffers, EVs enhance the coupling between power and transportation networks. Large numbers of EVs may reduce the stability of the grid, but if managed properly, they can actually increase the grid’s flexibility and boost renewable energy consumption [11]. By adopting reasonable charging strategies for EVs, the power network and transportation network are expected to make perfect cooperation, thereby achieving a win–win situation for the system operators, charging stations (CSs), and EV owners.
1.2. Literature Review
Various studies have explored practical and effective charging strategies for EVs. Among them, centralized strategies make scheduling decisions to coordinate the charging behavior of EVs from the system perspective [12]. The authors in [13] developed a centralized charging strategy for battery swapping stations (BSSs) using an improved population-based heuristic algorithm. It took into account the optimal charging priority and locations of EVs based on spot pricing and minimized the total charging cost and impacts on power quality. A centralized bilevel charging strategy for plug-in electric vehicles (PEVs) was presented in [14], aiming to coordinate the charging behavior from both spatial and temporal viewpoints. This strategy considered the benefits for the grid and EV users simultaneously. DeForest et al. studied the day-ahead centralized scheduling of an EV fleet participating in the wholesale electricity frequency regulation market, which involved optimizing EVs’ charging behavior, market bidding, and response to the grid system operator [15]. By contrast, decentralized strategies that allow individual EV owners to determine their charging patterns are also investigated [16]. Although decentralized approaches are inferior to centralized ones regarding uncertainty about system-level optimality and grid stability, they preserve individual privacy and authority and reduce computational and communication costs [17]. To evenly utilize available charging resources and avoid the excessive waiting time of EVs, a decentralized scheduling algorithm and a cooperative control policy were proposed in [18]. Zhou et al. developed an equilibrium model for coupled power and transportation networks, in which the spatial and temporal varied network flow solutions were obtained by a decentralized approach [19]. The authors in [20] established a decentralized control strategy for high penetration of PEVs, through which considerable charging load could be transferred to the night-time demand valley. In addition, the convergence of the adopted noncooperative games was proven under sufficient conditions. In [21], the EV aggregators and EV drivers considered two agent modes, namely the centralized protocol management mode and the decentralized one, were considered in the EV aggregator’s day-ahead bidding. The case study based on the Guangdong electricity market showed that EVs with the centralized agent mode were more sensitive to the electricity price.
Charging price can guide the charging behavior of EVs, which is one of the most critical factors affecting the efficiency of CSs and EVs [22]. However, in [12–21], the influence of charging price on EVs is not fully discussed.
In terms of the interaction between charging pricing and EV charging decision, Yang et al. presented an optimal EV route model and compared the impact of three time-of-use (TOU) electricity price profiles on the performance of EV charging [23]. The authors in [11] investigated the impacts of three kinds of charging strategies on the stability of distribution systems and the efficiency of electrified transportation systems. Although the charging price adopted in the price-based strategy was referred to as “dynamic price”, it is a fixed TOU price. To further explore the role of electricity price, research on charging prices has transferred to dynamic pricing methodologies in recent years. A dynamic charging price demand function was proposed in [24] to guide EV users to strategically choose the fast-charging stations while considering multiple demands of EVs, CSs, and the distribution network. The authors in [25] built a hierarchical game model to jointly settle the problem of CSs pricing and EV charging decisions. In this work, a concept of time-based billing was proposed to avoid possible low utilization caused by a usage-based billing scheme. Dynamic pricing algorithm was also studied in [26] to simultaneously determine charging price and schedule EVs and energy storage, which was solved by applying Lyapunov optimization. The authors in [27] proposed a two-stage Stackelberg game model to handle the problem of CS pricing, as well as PEVs station selection. However, only two competing CSs were considered in this model, which was still far from practical application. Ding et al. assumed CSs and an EV aggregator as two noncooperative stakeholders, seeking the coordination of charging pricing and EV travel-route scheduling [28]. EVs in [28] are all price-responsive and subject to centralized regulation by the EV aggregator. To avoid the unacceptable queue waiting time during the peak load period, the authors in [29] proposed a scheduled pricing policy. Compared with the most general flat pricing policy, this method also improved the profit margins for the CS operators.
Several technical, environmental, and economic factors have been considered in previous studies in terms of charging behavior modeling [30]. The authors in [31] systematically investigated and analyzed the main factors that influence the charging behavior and driving pattern of EVs from three domains of transport, vehicle technology, and power system, among which charging infrastructure and battery performance were identified as two core factors. Xiong et al. designed a behavior model based on the Quantal Response Equilibrium model and the level-k thinking model to simulate the bounded rationality of EV drivers when they select CSs to charge [32]. The authors in [33] proposed an EV behavior simulator to simulate the EV driver behavior aspects, including the importance of charging price, the importance of each trip, the sensibility of the battery’s state, and other parameters. In [34], the charging mode selection of EVs was determined by both service fee and battery lifetime–related cost, and whether an EV left the CS before charging was influenced by waiting time. Sun et al. focused on the detour distance that affects the fast-charging station choice behavior of EV users [35]. The estimation results demonstrated that private and commercial users have heterogeneous detour willingness when they have charging needs on weekdays or weekends. Charging willingness can also be characterized by expenses that EV drivers should pay, including travel costs, waiting time, and charging costs [27].
In [23–29, 31–35], the relationship between charging pricing and EVs charging decision-making and the influence of EV charging behavior modeling on its own charging decision-making are discussed respectively. However, in real life, as a separate interest subject, there is also an interest interaction relationship between the power system and the charging pile. The adjustment of electric energy in the power system will also affect the charging pricing and the charging decision of EVs.
When EVs are connected to the power system, the planning and scheduling of EV become a multistakeholder problem, commonly modeled by game theory [9]. A bilevel optimization model was proposed for determining the optimal allocation of CSs in [36]. The upper level sought the least social cost, while the lower level established a complete information game by considering the charging behavior of EV drivers. The authors in [37] established a real-time dispatching framework for EV navigation, which considered both the reliability of the power grid and the profitability of CSs. Moreover, different CSs were regarded as noncooperative players who adjusted the electricity price to maximize their profits. Authors of [38] presented a rolling horizon scheduling method considering the uncertainty of EV charging behavior and electricity price, and the two stakeholders, distribution network operators and EV drivers, could benefit from this method simultaneously. In [39], information from power systems and intelligent-transport systems was combined to optimize the charging strategy for massive EVs. This method can not only relieve traffic congestion but also improve the safety and economy of the power grid. The authors in [40] developed a bilevel programming model to address the planning of CSs and the spatial and temporal coordination of EVs. The test in [40] revealed the interdependency between the distribution network and transportation network on CS issues. Li et al. proposed a bilevel scheduling approach for real-time pricing of EV BSSs, in which the dynamic supply–demand relationship between the isolated micro-grid and BSSs was considered [41]. A hybrid method combining the heuristic with analytical optimization was also designed to effectively coordinate BSSs to participate in the economic operation of micro-grid.
In addition to EVs, the installed capacity of renewable energy, such as PV and wind turbines, has experienced rapid growth worldwide in recent years. Distributed energy resources (DERs) are gradually becoming a rising force in the power market [42]. The CSs are expected to obtain economic and clean electricity from DERs, while EVs can obtain more flexible charging time and price. As for DERs, EVs’ charging and discharging behaviors can promote their consumption and help realize mobile energy storage [43]. Therefore, considering the DERs in the synergetic planning and scheduling among distribution networks, EVs and CSs can benefit multiple stakeholders. The authors in [44] proposed a framework for peer-to-peer energy trading between CSs and a business entity equipped with PV panels. Compared with the energy trading directly with the grid, this framework significantly reduced the cost of prosumers and increased the self-consumption rate of PV power. Luo et al. regarded the transportation agency, city manager, and power agency as stakeholders and carried out the joint optimization of the locating and sizing of the CSs and the PV stations as well as the time-varying charging price of the CSs [45]. This work can guide the planning and scheduling of the integrated transportation and power system. A bilevel planning model for CSs considering wind, solar power, and energy storage is established in [46], which comprehensively considers the energy cost and environmental benefits. The result of the case study revealed that the access of renewable energy is profitable to the whole system.
The research results in [42–46] show that the access of renewable energy is beneficial to the whole power system. Considering DERs, EVs and CSs in collaborative planning and scheduling between distribution networks can benefit multiple stakeholders. Therefore, it is of great significance to study the interaction between EVs and active distribution networks.
1.3. Contribution
However, most of the existing studies have neglected various factors affecting charging behavior, especially in centralized scheduling, which fails to preserve the decision-making authority of EV individuals. In addition, more research is needed on the interaction of pricing strategies between power and transportation systems, as well as the impact of pricing strategies on renewable energy consumption. Otherwise, it is difficult to provide practical guidance in planning and scheduling scenarios where power and transportation systems are more closely coupled in the future.
- 1.
A bilevel noncooperative pricing framework for the integrated transportation and power network is proposed, in which the tight coupling of multistakeholders and the penetration of renewable energy are fully considered.
- 2.
The upper power network determines its LMP by tracing the cost results of optimal power flow, and the lower transportation network adopts a noncooperative game strategy to optimize the charging price of CSs. An equivalent definition is proposed to find the generalized Nash equilibrium, and the greedy algorithm is adopted as the solution method.
- 3.
The charging willingness of EV drivers is modeled, considering EVs’ battery state and EV drivers’ preference for detour distance, charging price, and charging level that can describe the charging behavior more accurately.
- 4.
Based on the transportation and power network of the Dublin area, a testbed is established to validate the effectiveness of the proposed methodology in promoting a harmonious EV charging market, facilitating renewable energy, and alleviating traffic congestion. The results show that the proposed pricing strategy can notably improve the performance of CSs near wind farms but in poor locations.
1.4. Organization
The remainder of this paper is organized as follows. Section 2 introduces the modeling of the traffic network, and Section 3 describes the bilevel pricing methodology for power distribution and transportation networks. The solving methods of the upper and lower models are presented in Section 4. Section 5 verifies the proposed methodology through the Dublin area–based testbed. In Sections 6 and 7, the discussion and conclusion are given, respectively.
2. Modeling of Traffic Network
2.1. System Construction
Highway traffic flow can be predicted by machine learning methods based on collected historical data. In this paper, an artificial neural network (ANN) model is adopted to forecast the hourly traffic flow [49]. The hourly data of EVs on the road can then be calculated by multiplying the market share of EVs. At the beginning of time t, the initial position, destination, and battery state of each EV are randomly generated on the road segments.
2.2. EV Characteristics
2.2.1. Charging Probability
2.2.2. Charging Willingness
In addition to charging probability, it is necessary to consider the different charging preferences of EV owners when modeling their charging behavior [35]. Some EV owners value the cost of time so that the nearest CS will be their primary concern, while some are willing to detour to cheaper CSs. In addition, EV owners have different preferences for charging levels. Without loss of generality, this paper combines these factors and argues that the charging willingness of EV owners is affected by detour distance in spatial attributes and by both charging price and charging level in nonspatial attributes.
Before calculating the charging willingness of an EV driver to choose a certain CS, it should be judged whether the distance constraints (6)–(8) are satisfied.
According to the standard SAE J1772, several EV charging levels are standardized based on power distribution type and maximum power, including AC charging and DC fast charging [52]. Considering the influence of charging levels on charging duration and battery health, different EV drivers will have their preferences. In this paper, we denote the loyalty level of EV m to choose CS k as . When the charging level of CS k matches the EV driver’s preference, equals 1, otherwise, equals 0.
In general, the more refined modeling of charging willingness in this paper will enable the pricing strategies in the lower level to better guide the charging behavior of EV drivers. It should also be noted that, for the sake of simplicity, the subscript t of related parameters and variables is omitted in the modeling of EV characteristics.
2.3. CS Operation
To evaluate the performance of the proposed methodology in promoting renewable energy consumption, CSs are divided into three categories: CSs located near wind farms, CSs located near PV stations, and ordinary ones with neither wind farm nor PV station nearby. The power output of wind farms and PV stations is also predicted using ANN.
The relationship between CSs is a noncooperative game. When their pricing reaches a Nash equilibrium, they will uniformly broadcast their charging price to all EVs on the road at each period t. EV drivers can then book charging services to the CSs with high willingness value, and CSs will receive the booking requests from the EV drivers if they have free charging slots.
3. Problem Formulation
The increasing penetration of EVs makes EV CSs become large electricity consumers. Appropriate charging pricing mechanisms are necessary to guide the charging behavior of EV owners, thereby promoting renewable energy consumption, balancing the profitability of CSs, and diverting the traffic flow. This paper explores a dynamic pricing mechanism based on the topology of regional transportation and power networks, which can meet these practical needs.
3.1. Bilevel Dynamic Pricing Methodology
Figure 1 demonstrates the detailed workflow of the proposed pricing mechanism.
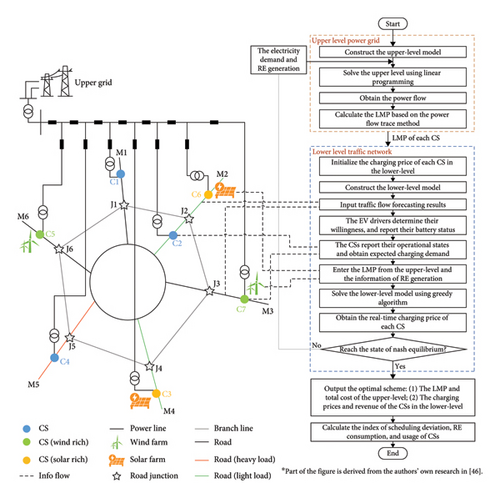
The upper power grid aims to minimize the total cost of power generation and transmission. The optimal economic dispatch strategy is determined based on the electricity demand fed back by the lower CSs and power generation information of their nearby wind farms or PV stations. Each CS’s LMP is determined by a power flow trace method and then passed to the lower level as input.
Each CS at the lower level broadcasts its charging price and operating status in real time. Thus, the EVs to be charged on the road determine their charging willingness based on the charging price, detour distance, charging level, and operational status of each CS, and book charging service to the intended CS. The charging demands of each CS can then be calculated. Based on this charging willingness determination method, a noncooperative game model is established at the lower level solved by the greedy algorithm: each CS aims to maximize its own profit and adjusts its own charging price to seek Nash equilibrium.
The upper power grid updates the optimal economic dispatch strategy according to the charging demand of each CS fed back by the lower traffic network. The iteration is repeated until the iteration termination condition is met.
According to the above procedure, the LMP of the distribution network and the charging price of the CSs (hereinafter referred to as the dynamic price of the game, DPG) are obtained hour by hour.
- •
Assumption 1: The data exchange between EV drivers and CSs is realized through advanced wireless communication and GPS facilities.
- •
Assumption 2: It is assumed that historical information on renewable energy and traffic flows can be collected from the Weather Bureau and the Transport Department, respectively. The data will be processed and used for prediction in a high-level data aggregator implemented using cloud computing servers.
- •
Assumption 3: Based on real-time vehicle data on the road and the operation state of CSs, the data aggregator processes traffic information and broadcasts road-blocking signals to all EVs on the road, namely bse,t in (1).
- •
Assumption 4: All CSs and EVs are assumed to be rational and selfish players aiming to maximize their own profits or utilities.
- •
Assumption 5: Given the intermittency of renewable energy and the lack of flexibility of the existing power grid, some renewable energy cannot be fed into the grid. This paper assumes that the surplus renewable power from PV stations or wind farms is supplied to their nearest CSs free or at a meager price. Compared with other CSs, each neighbor CS can access surplus power through power cables built by itself rather than through the local power grid.
- •
Assumption 6: EVs’ queing time after reaching the CSs is neglected in this paper because the CSs will charge overtime fees to discourage the EV drivers from occupying charging facilities after their charge is finished.
3.2. Upper Level Subproblem
3.2.1. Objective Function
3.2.2. Constraints
For simplicity, we assume that the peak load constraints of the CS nodes have been considered during the planning stage of the CSs.
3.2.3. LMP Calculation
Based on the power flow obtained from the optimal economic dispatch, the LMP of each CS node is calculated by the power flow trace method proposed in [56].
3.3. Lower Level Subproblem
3.3.1. Noncooperative Game Formulation
In the lower level, each CS seeks to maximize its own profit by adjusting its charging price, while there is no subordination relationship between various CSs, and their profits are in conflict. Therefore, we establish the price adjustment of each CS in the lower level as a noncooperative game ₲, which is constructed as follows.
3.3.1.1. Players
The set of all k CSs participating in the EV charging market.
3.3.1.2. Strategies
3.3.1.3. Payoffs
The first term in the payoff function represents the income of the kth CS from charging service fees to EVs, whilst the second term refers to the cost of electricity purchased from the upper grid. For CSs with nearby wind farms or PV stations, the electricity purchased from the grid needs to be subtracted from renewable energy generation.
3.3.2. Charging Demand Calculation
The charging demand of the kth CS is not only determined by its charging price but also influenced by the charging prices of other CSs. The algorithm calculates the charging demand dominated by EV drivers’ charging willingness of each CS k at time tDk,t in (32) as:
-
Algorithm 1: Calculating the charging demand of CSs.
-
Input: Capm,t, SOCm,k,t, dm,k,t, pk,t, k ∈ k, m ∈ M, t ∈ T
-
Output: Dk,t, k ∈ k, t ∈ T
- 1.
for 1 ≤ t ≤ Tdo
- 2.
Initialize
- 3.
for each EV m, 1 ≤ m ≤ Mdo
- 4.
for each CS k, 1 ≤ k ≤ kdo
- 5.
Calculate{wm,k,t}according to{dm,k,t} and {pk,t}
- 6.
end for
- 7.
- 8.
- 9.
end for
- 10.
end for
The parameter Capm,t in Algorithm 1 denotes the battery capacity of EV m at time t. As shown in step 8, at time t, the charging requirement of those EVs with the strongest willingness to charge at CS k will be added to the charging demand of CS k, referred to as Dk,t.
4. Solving Methods of Bilevel Model
4.1. Upper-Level Power Grid
4.2. Lower-Level Traffic Network
The Nash equilibrium is often used to describe the market state, but the network constraints will induce market separation and greatly influence the Nash equilibrium [59, 60]. Since the noncooperative game in this paper has high complexity to formulate a more realistic environment and is an NP-Hard problem, the existence and uniqueness of the Nash equilibrium are difficult to be mathematically proved [61, 62].
To find the approximate Nash equilibrium, we propose an equivalent definition of the generalized Nash equilibrium, which serves as a termination condition in the iterative solution process of Algorithm 2.
4.2.1. Definition
If F(pt) equals zero, pt is also the generalized Nash equilibrium of the noncooperative game ₲.
F(pt) is a nested function that contains solving optimization problems, finding the maximum value, and summing.
Specifically, when the generalized Nash equilibrium of ₲ is reached, the corresponding pricing strategies are denoted as . The necessity and sufficiency demonstration of the equivalent definition is as follows.
4.2.2. Necessity Demonstration
If is the generalized Nash equilibrium of the noncooperative game ₲, equals for any k in the set K. Thus, equals zero.
4.2.3. Sufficiency Demonstration
For any k in the set K, it is obvious that is equal to or greater than . In this case, if equals zero, must equal for any k in the set K. Therefore, is also the generalized Nash equilibrium of the noncooperative game ₲.
Accordingly, when F(pt) converges to a positive value very close to 0, a set of sub-optimal pricing decisions can be obtained. Although the globally optimal solution is difficult to guarantee due to the model’s high complexity, it also makes sense to efficiently obtain a solution very close to the globally optimal solution from the viewpoint of science and engineering.
For problems with the greedy-choice property and optimal substructure, the greedy algorithm can obtain locally optimal choices with high computational efficiency [63]. Therefore, the greedy algorithm and its improved forms have been widely used in decentralized, large-scale, and complex research on EV scheduling and pricing [64, 65].
The generalized Nash equilibrium problem in the lower level has the greedy-choice property. Specifically, the CSs iteratively make one greedy decision after another without considering future charging information, and finally, a sub-optimal solution can be assembled. In addition, each sub-decision of the generalized Nash equilibrium is the optimal decision when other sub-decisions are fixed, so the generalized Nash equilibrium problem also has the property of optimal substructure. Accordingly, this paper adopts the greedy algorithm to solve the pricing problem.
The main idea of the greedy algorithm is as follows. Initially, input parameters include surplus renewable energy, EVs’ battery status, and detour distance for each time period. After initializing the charging price of each CS, the algorithm runs in multiple rounds. Each round consists of multiple steps: calculate the charging demand of each CS considering the charging willingness of each EV, feed the calculation results to the upper level and update the LMP, then optimize the subproblems in the lower level in turn and update CSs’ charging price. This process repeats until the termination condition is met. Finally, output the LMP in the power network and charging price in the traffic network. The structure of the greedy CS pricing in this paper is shown in Algorithm 2.
-
Algorithm 2: Greedy CS pricing.
-
Input: REk,t, Capm,t, SOCm,t, dm,k,t, k ∈ K, m ∈ M, t ∈ T
-
Output: LMPk,t, pk,t, k ∈ K, m ∈ M, t ∈ T
- 1.
for 1 ≤ t ≤ Tdo
- 2.
Initialize {p0}, ii = 0
- 3.
whiledo
- 4.
ii = ii + 1
- 5.
Calculate according to , see Algorithm 1
- 6.
Calculate and in the upper level according to
- 7.
for each CS k, 1 ≤ k ≤ Kdo
- 8.
Solve its own optimization problem:
-
- 9.
end for
- 10.
Obtain according to (36)
- 11.
end while
- 12.
end for
The residual error ε in step 3 must be a value greater than 0 and much less than 1. When F(pt) is less than ε, the iteration is terminated. This situation is equivalent to problem min F(pt) finding its sub-optimal solution and equals zero. In this case, according to the previous necessity and sufficiency demonstration for the proposed equivalent definition, the noncooperative game in the lower level is believed to have obtained a set of optimal pricing decisions.
The following case study was developed on a computer with one Intel Core i7-9700KF processor and 32 GB of RAM. The programs were developed using MATLAB R2016b and solved by YALMIP + GUROBI (Version 8.1.1).
5. Case Study
5.1. Testbed Establishment
To verify the effectiveness of the proposed bilevel pricing model, an integrated traffic and power distribution network testbed is established based on the actual traffic network topology in Dublin. The topology of the studied distribution network is based on the IEEE 33-node test system. The specific topology of the integrated testbed is shown in Figure 2.
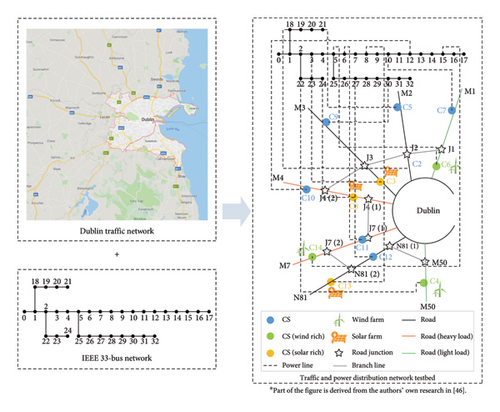
Based on our previous research on pricing strategy in this area [47], 13 CSs are assumed to be located in the Dublin area. Their charging patterns and available charging slots are given in Table 1.
| Name | Charging type | Total slots | Slots in use at the last minute of the previous weekday |
|---|---|---|---|
| C2 | DC Level 2 | 18 | 1 |
| C3 | DC Level 2 | 18 | 0 |
| C4 | DC Level 2 | 15 | 5 |
| C5 | DC Level 1 | 15 | 3 |
| C6 | DC Level 2 | 18 | 8 |
| C7 | DC Level 1 | 12 | 6 |
| C8 | DC Level 2 | 25 | 9 |
| C9 | DC Level 1 | 20 | 4 |
| C10 | DC Level 2 | 22 | 2 |
| C11 | DC Level 2 | 18 | 4 |
| C12 | DC Level 2 | 18 | 1 |
| C13 | DC Level 1 | 21 | 0 |
| C14 | DC Level 2 | 15 | 2 |
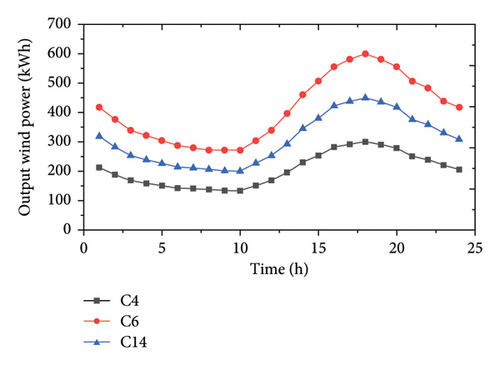
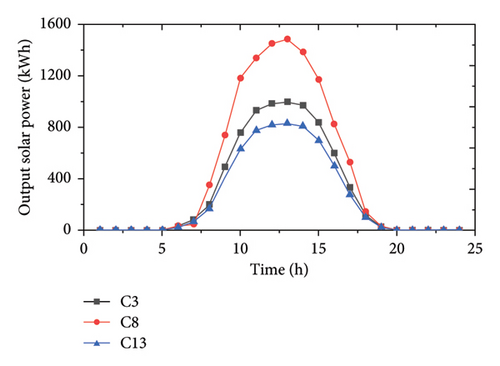
It is assumed that C4 and C6 are located near offshore wind farms, C14 is also within an onshore wind-rich area, and C3, C8, and C14 are located near PV stations. The other CSs are considered ordinary ones. Based on historical data collected from a wind and solar power generation project in Ireland, the predicted hourly output curves of surplus wind and solar power in a typical day are shown in Figure 3. And the following analysis on the renewable energy consumption only focuses on the surplus renewable energy.
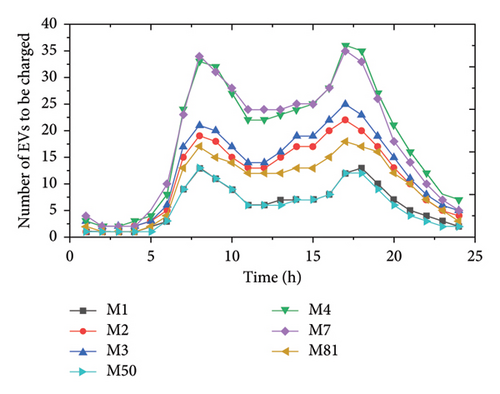
The traffic flow information is predicted based on historical traffic data of the Dublin Traffic Agency, and the charging demands of EVs are generated following Inverse Gaussian distribution [66]. Figure 4 presents the hourly traffic flow data on the seven highways in Dublin.
In addition to the DPG proposed in this paper, two comparative pricing mechanisms are set up, namely TOU tariff and flat rate, as shown in Table 2.
| Pricing mechanism | Electricity price (¢/kWh) |
|---|---|
| Dynamic price of the game (DPG) | |
| TOU tariff | Electricity peak times (08:00–24:00): 22.58; electricity off-peak times (0:00–8:00): 15.05 |
| Flat rate | 20.06 |
5.2. Algorithm Performance
The bilevel pricing model judges whether the problem’s solution reaches the generalized Nash equilibrium according to the equivalent function F(pt) defined above.
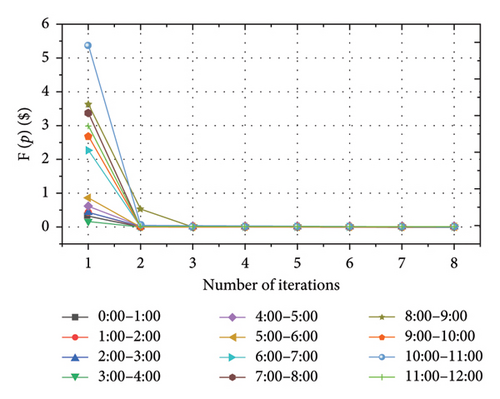
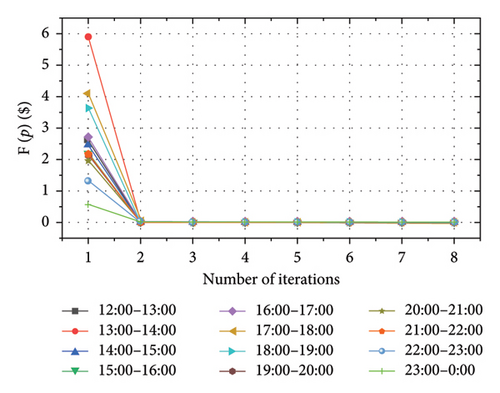
According to the MATLAB memory profiler tool, the execution time of the Case study is 292.15 s, and the highest computer resource value is 127,792 kB, which is lightweight and could run with low computational resource demand. As demonstrated in Figure 5, all 24 time periods in a day can reach the generalized Nash equilibrium within 4 iterations.
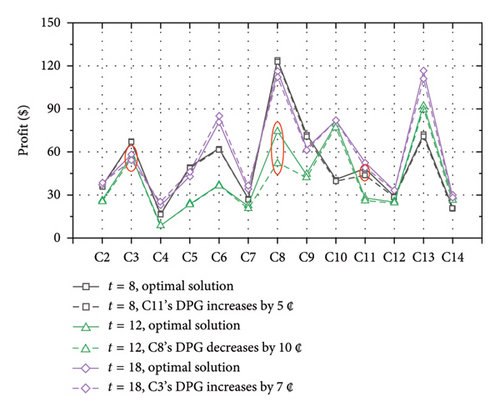
To verify the pure strategy Nash equilibrium, 100 groups of test are carried out. For different time periods, the DPG of different CSs is adjusted respectively, and the results obtained are compared with those of the DPG. Three groups of results are shown in Figure 6. It can be seen that no CS can increase its profits by raising or lowering its own DPG in these cases.
5.3. LMP Analysis
Figure 7 shows the LMP of each CS obtained by the upper-level decision under the Nash equilibrium at 5 typical time slots.
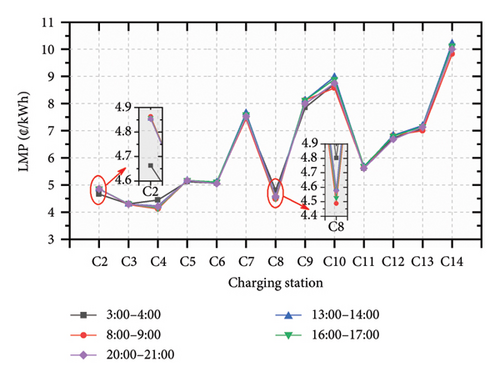
It can be found that no matter the morning rush hour (8:00–9:00), evening rush hour (16:00–17:00), or other time slots (13:00–14:00, 20:00–21:00), the value of the LMP is mainly related to the power loss. The LMP of CSs near the head point of the distribution network is low, such as the nearest C2, C3, and C4, while the LMP of CSs far from the head point is high, such as the most far C14.
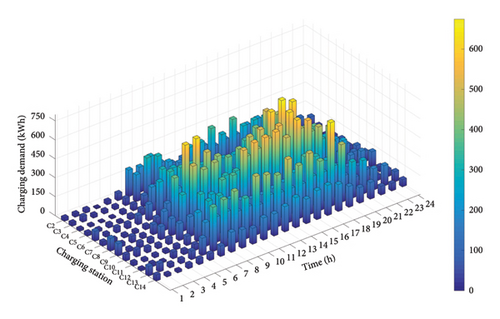
As known in Figure 2, the power loss from C2 to head point is relatively less than that from C8 to head point, and the LMP of C2 is slightly lower than that of C8 from 3:00 to 4:00. However, in the other three time slots, the LMP of C2 is greater than that of C8, which is marked in red circle in Figure 7. This is owing to the allocation of transmission cost considered in the power flow trace method. The charging demand of C2 is lower than that of C8 from 3:00 to 4:00, but the situation is the opposite in the other three time slots, which can be seen in Figure 8 in Section 5.4.2.
5.4. Economic Analysis of CSs
5.4.1. DPG
The temporal and spatial distribution of the DPG of the CSs in the lower level is shown in Figure 9, and the DPG of different CSs at different periods is distinguished by the color depth of the color blocks. It can be seen that the DPG varies between 9.42 and 24.23 ¢/kWh. For reference, the charging fees of local CSs in Ireland vary depending on the type of charger. According to the ESB Networks Ireland, the charging price of standard AC chargers (up to 22 kW) varies between 12 and 43 ¢/kWh, while that of DC fast chargers is about 43 ¢/kWh [67].
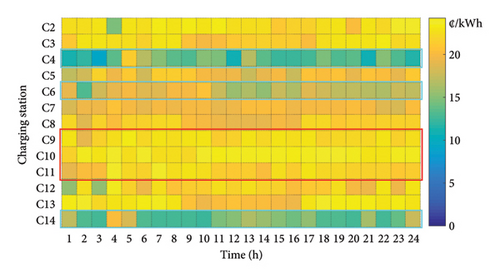
Compared with other CSs, C4, C6, and C14 in wind-rich areas have more blue color blocks, which means that their charging prices are generally lower, while C9, C10, and C11 have brighter yellow color blocks, which represents that their charging prices are generally higher. The specific reasons will be analyzed later.
5.4.2. Charging Demand and Profit Distribution
Considering the detour distance and charging price, each EV owner will subscribe to the CS with the highest charging willingness. Then, the spatial and temporal distribution of the charging demand of all CSs is generated, as shown in Figure 8.
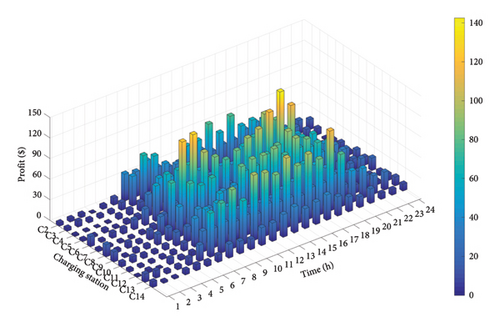
Figure 10 presents the spatial and temporal distribution of the profits of all CSs, which are calculated according to the optimization results of LMP in the upper level and DPG in the lower level.
Since the daily profits of the CSs under the TOU or flat rate are greatly affected by the set charging price, only the trends of daily profits under the three pricing mechanisms are compared in this paper, which can be seen in Figure 11.
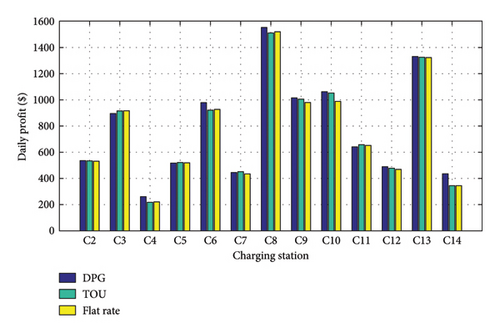
The profitability of each CS is influenced by its geological location, the presence of renewable energy nearby, and the output of renewable energy. Apart from the two well-located ordinary CSs, C9 and C10, the daily profits of renewable energy-rich C3, C6, C8, and C13 are significantly higher than other ordinary ones under the three pricing mechanisms. Since these CSs have priority to use nearby free wind or solar power, their cost of purchasing electricity from the upper grid can be reduced. However, the daily profits of C4 and C14, located near wind farms, are lower than others. On the one hand, the installed capacities of the wind power near these two CSs are relatively small, and the morning rush hour coincides with the valley of the wind turbine output, which results in the limited utilization of wind power. On the other hand, C4 sits on a road with sparse traffic, while C14 is far from the center of Dublin. Their poor geographical location is not attractive for EV drivers regarding detour distance.
A horizontal comparison shows that when the proposed DPG is adopted, daily profits of C4, C6, and C14 in wind-rich areas are distinctly improved compared to the other two pricing mechanisms. When a fixed charging price is adopted, EV owners’ charging willingness will only be affected by the detour distance, and the CSs located on light roads have no advantage in attracting EV owners. In particular, C14 is located at the end of the distribution network, resulting in higher power transmission costs, so its daily profit will be even less than other CSs. By contrast, the DPG balances the profits of all CSs to a certain extent by allowing them to adjust their charging price, especially to improve the profits of CSs with poor locations near wind farms. Consistent with Figure 9, C4, C6, and C14 all reduce their charging price to increase EV owners’ charging willingness to them, and then their daily profits can be improved. It can also be seen from Figure 11 that, compared to TOU and flat rate, the profit of C4 has increased by 19.72% and 18.77%, C6 has increased by 6.17% and 5.45%, and C14 has increased by 26.75% and 26.88%, respectively. Meanwhile, the fluctuation of the daily profits of other CSs is within the acceptable range, which shows that the DPG can improve the profits of these CSs without excessively reducing that of the others.
5.5. Renewable Energy Consumption
Figure 12 presents the hourly wind and solar power consumption of CSs in renewable energy-rich areas.
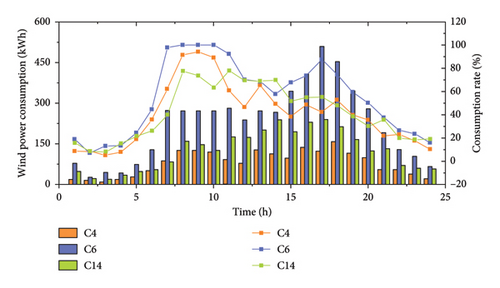
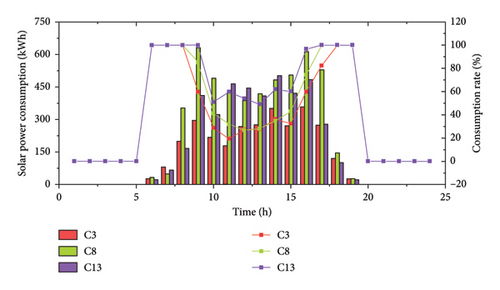
According to Figure 12(a), from 0:00 to 7:00, the wind power output is in a valley period, and there are few EVs to be charged on the road, so the wind power consumption rates of C4, C6, and C14 are low. When the morning rush period (7:00 to 9:00) comes, the wind power consumption rates all rise and sometimes even reach 100%. Subsequently, as the wind power output increases and traffic flow decreases, the consumption rates decline. Wind power consumption slightly increases during the evening rush hours (16:00 to 18:00). After that, the traffic flow rapidly decreases, and the wind power output shows a downward trend, so the wind power consumption rates further decrease.
Figure 12(b) shows no solar consumption after sunset. In the morning and evening rush hours, the solar power consumption of C3, C8, and C13 can all reach 100%. Although 9:00 to 16:00 is the peak period of solar power output, the consumption rates are limited due to the small number of EVs to be charged on the road. Among them, C13 shows an overall higher consumption rate than the other two CSs for its relatively small installed capacity of wind turbines.
As can be seen in Table 3, under the proposed DPG, the overall consumption of renewable energy is better than the other two pricing mechanisms. CSs in wind-rich or solar-rich areas can exploit free renewable energy generation to attract more EV owners by adjusting their charging prices, and then renewable energy consumption can be promoted.
| Average consumption rate (%) | CSs in wind-rich areas | CSs in solar-rich areas | ||||
|---|---|---|---|---|---|---|
| C4 | C6 | C14 | C3 | C8 | C13 | |
| DPG | 40.59 | 55.21 | 41.46 | 62.35 | 68.96 | 80.92 |
| TOU | 23.06 | 46.12 | 22.12 | 61.75 | 65.98 | 78.47 |
| Flat rate | 23.79 | 47.40 | 23.17 | 64.23 | 68.18 | 81.38 |
| Whether DPG is optimal | Yes | Yes | Yes | No | Yes | No |
5.6. Usage of Charging Facilities
Table 4 presents the average utilization rate of charging facilities in renewable energy-rich CSs under the three pricing mechanisms. It can be seen that under the DPG, the utilization rate of CSs in wind-rich areas has increased overall, while that of CSs in solar-rich areas has declined. Under the other two pricing mechanisms, the solar power-related CSs have better performance in charging facilities usage for their location advantages, while the utilization rates of wind power-related ones are much lower. By adjusting charging prices, the DPG can promote renewable energy consumption and balance the utilization rate of CSs in wind-rich and solar-rich areas.
| Average utilization rate (%) | CSs in wind-rich areas | CSs in solar-rich areas | ||||
|---|---|---|---|---|---|---|
| C4 | C6 | C14 | C3 | C8 | C13 | |
| DPG | 16.67 | 34.72 | 24.44 | 28.24 | 35.83 | 37.90 |
| TOU | 11.11 | 28.47 | 15.00 | 29.63 | 34.83 | 39.88 |
| Flat rate | 11.39 | 29.63 | 15.56 | 31.48 | 36.50 | 41.67 |
| Whether DPG is optimal | Yes | Yes | Yes | No | No | No |
It should be pointed out that the comparison of the utilization rates of all CSs in this region is meaningless because the total charging demand is determined. When more EVs are attracted to the CSs near wind farms or PV stations, the number of EVs to be charged at other CSs will decrease, resulting in a reduction in the utilization rate of their charging facilities.
5.6.1. Influence on Traffic Flow
Figure 13 takes the typical time periods of morning peak (8:00–9:00), evening peak (16:00–17:00), and other time periods (5:00–6:00, 20:00–21:00) as examples to intuitively show the selection results of EV owners under three pricing mechanisms.
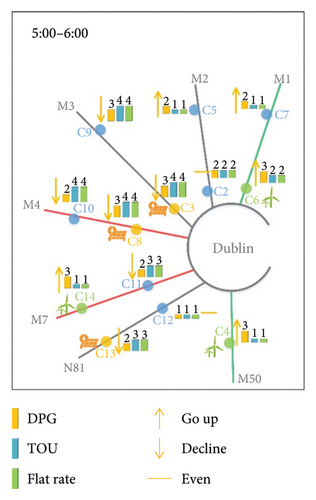
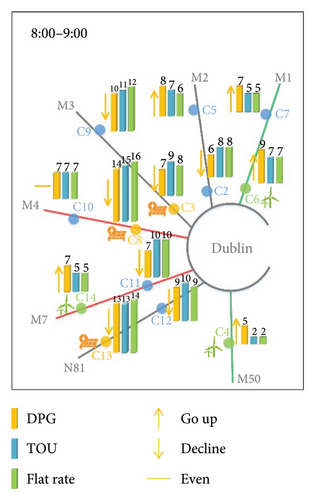
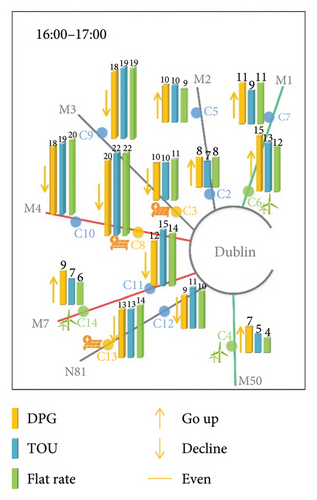
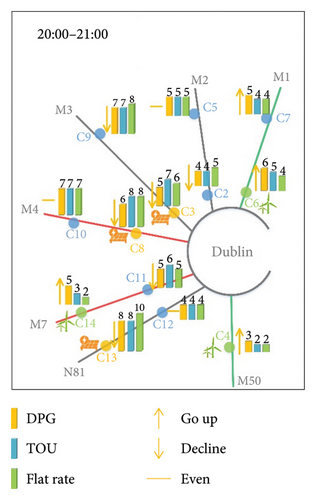
When fixed pricing mechanisms for CSs are adopted, the lower-level model is no longer an optimization problem, and the charging willingness of EV owners will be determined by the fixed charging price and detour distance. Therefore, EVs on heavy roads tend to choose the nearest CSs, which will intensify the busyness of these CSs and degree of road congestion, and result in poor usage and profits of CSs on light roads. As can be seen from Figure 13, regardless of the morning and evening peak hours or other periods, under the two fixed pricing mechanisms, C3, C8, C9, C10, and C11 have become the choice of the majority of EVs for their location advantages. Although the solar power consumption of PV stations near C3 and C8 is promoted to a certain extent, the congestion of heavy roads such as M3, M4, and M7 is also increased.
However, when the DPG is adopted, the price adjustment of each CS can balance not only the daily profits but also the charging demand of EVs. It can be seen that under the DPG, wind power consumption near C4, C6, and C14 is promoted, and the utilization rates of CSs in remote areas such as C5 and C7 are all increased. The result reflects that the proposed DPG can disperse the traffic flow to some extent by influencing the charging willingness of EV drivers. Compared with Figures 13(a) and 13(d), the dispersion effect of DPG in Figures 13(b) and 13(c) is more prominent because the charging demand of EVs during off-peak hours is much less than that in rush hours.
6. Discussion
In order to reflect the tight coupling between the power grid and traffic network, a bilevel noncooperative pricing framework is proposed to promote a harmonious EV charging market. We have validated the effectiveness of the proposed methodology by applying it to the actual traffic network in the Dublin area.
Through the analysis in Section 5, the rationality of the proposed DPG in balancing the profitability and utilization rate of CSs has been demonstrated. Especially for CSs with poor location near wind farms, their performance can be significantly improved when the bidirectional effect between the power network and transportation network converges to an equilibrium state. As for C4, C6, and C14 in this paper, compared with TOU tariff and flat rate, their daily profitability can be increased by 17.55% and 17.03% on average. Regarding the utilization rate of charging facilities, the average increase level is 7.08% and 6.42%, respectively. The results also show the potential of the proposed methodology in promoting renewable energy consumption and diverting traffic flow. The adjustable charging price can make use of the surplus renewable energy generation in the Dublin area, which is considered free. Consequently, the renewable energy consumption of CSs in poor locations is significantly increased, and the traffic flow on heavy roads can partly be diverted to relatively light ones. Taking C14 as an example, the consumption rate of its nearby wind power is increased by around 20% compared to the other two pricing mechanisms. Combined with the economic analysis of CSs and renewable energy consumption, the pricing methodology can take advantage of the complementarity between wind and solar power and make more balanced use of them.
The proposed bilevel pricing methodology widely applies to the integrated traffic and power distribution network with renewable energy penetration. The essence of the DPG is to guide the charging behavior of EV drivers by allowing all CSs to adjust their charging prices. For scenarios where renewable energy-related CSs are set near light load roads, the DPG can play the dual effects of promoting renewable energy consumption and facilitating traffic flow, which can be considered in the planning stage of CSs. In terms of computational efficiency, the solution time of the case study in this paper is less than 10 s for each time slot. Therefore, the proposed strategy applies to the dispatch interval of 1 h or shorter and larger-scale integrated systems.
It should be pointed out that the proposed pricing strategy relies on data processing and communication technology and requires participating CSs to be rational and selfish players.
7. Conclusion
This paper proposes a bilevel pricing framework for integrated transportation and power distribution networks, demonstrating its effectiveness through a case study in the Dublin area. The results show that the proposed framework successfully balances the profitability and usage of CSs, enhances renewable energy utilization, and optimizes traffic flow. Notably, the performance of CSs located near wind farms but in less favorable areas improves significantly. Compared to TOU tariffs and flat rates, the daily profitability of these CSs increases by an average of 17.55% and 17.03%, respectively, while their utilization rates rise by 7.08% and 6.42%, on average. Furthermore, the wind power consumption rate near C14 in a remote area improves by approximately 20% under the proposed mechanism.
With the growing adoption of renewable energy and EVs, the integration of power and transportation networks is expected to tighten, further highlighting the advantages of this pricing framework. The proposed mechanism exhibits strong adaptability to real-world integrated systems. Future research will focus on multistakeholder dynamics in EV charging, aiming to develop a fair and efficient market model leveraging advanced communication technologies.
Nomenclature
Indices and Sets
-
- T
-
- Index of dispatch periods in set, T
-
- m
-
- Index of EVs on the road in set, M
-
- k
-
- Index of roadside CSs in set, K
-
- i, j, n
-
- Index of power nodes in set, N
-
- ij
-
- Index of power lines in set, Γ
-
- iu
-
- Index of upstream nodes of node i in set, ϑu
-
- id
-
- Index of downstream nodes of node i in set, ϑd
-
- δk
-
- Set of price strategies of CS k
Parameters
-
- lre
-
- Length of road segment e
-
- SOCm
-
- State of charge of EV m
-
-
- Minimum value of SOCm
-
- Am
-
- Charging probability of EV m
-
- τ
-
- Charging probability parameter when SOC is larger than and smaller than 100%
-
- dm,k
-
- Detour distance of EV m to CS k, km
-
- dSPm,k
-
- Distance of EV m from its starting point to CS k, km
-
- dk,TPm
-
- Distance of EV m from CS k to its terminal point, km
-
- dSPm,TPm
-
- Distance of EV m from its starting point to its terminal point, km
-
- γm
-
- Electricity consumption of EV m, kWh/km
-
- Capm
-
- Battery capacity of EV m, kWh
-
- lm
-
- Loyalty level of EV m
-
- Sm,k
-
- 1 if EV m has previously used CS k
-
- α0, α1, α2, α3
-
- Constants related to
-
- od
-
- Offset related to
-
- α4, α5
-
- Constant related to
-
- op
-
- Offset related to
-
- ω1, ω2, ω3
-
- Weight coefficient attributed to detour distance, charging price, and charging level, respectively
-
- CGk
-
- Unit power generation cost, ¢/kWh
-
- CTij
-
- Unit power transmission cost, ¢/kWh
-
- Rij
-
- Resistance of line ij
-
- Xij
-
- Reactance of line ij
-
- Ui, min
-
- Minimum voltage amplitude of node i
-
- Ui, max
-
- Maximum voltage amplitude of node i
-
- Iij, max
-
- Maximum current value of line ij
-
-
- Minimum charging price of CS k
-
-
- Maximum charging price of CS k
-
- REk,t
-
- Available renewable energy generation near CS k at time t, kW
-
- ε
-
- Residual error in Algorithm 2
Variables
-
- bse,t
-
- Blocking signal of road segment e at time t
-
- weighte,t
-
- Weight of road segment e at time t
-
-
- Willingness of EV m to choose CS k considering the detour distance
-
-
- Willingness of EV m to choose CS k considering the charging price
-
-
- Willingness of EV m to choose CS k considering the charging level
-
- wm,k
-
- Charging willingness of EV m to choose CS k
-
- pk,t
-
- Charging price of CS k at time t
-
-
- Regional average charging price at time t
-
- Pij,t
-
- Active power flow of line ij at time t
-
- Qij,t
-
- Reactive power flow of line ij at time t
-
- Ui,t
-
- Voltage amplitude of node i at time t
-
- Iij,t
-
- Current of line ij at time t
-
- PLj,t
-
- Net active power outflow of node j at time t
-
- QLj,t
-
- Net reactive power outflow of node j at time t
-
- LMPk,t
-
- Locational marginal price of CS k at time t
-
- PGn,t
-
- Power generation of node n at time t
-
- Pk,t
-
- Active power injection of CS k connected power node at time t
-
-
- Profit of CS k at time t
-
- Dk,t
-
- Charging demand of CS k at time t
-
- αij,t
-
- Iij,t related linearized variable
-
- βi,t
-
- Ui,t related linearized variable
Conflicts of Interest
The authors declare no conflicts of interest.
Funding
This work was supported by the Humanities and Social Sciences Project of the Ministry of Education of China (21YJAZH083).
Open Research
Data Availability Statement
The data that support the findings of this study are available on request from the corresponding author. The data are not publicly available due to privacy or ethical restrictions.


