Time-Series Load Online Prediction of Wind Turbine Based on Adaptive Multisource Operational Data Fusion
Abstract
Aiming at the problem that the stochastic change of wind turbine generator (WTG) working conditions and the complex nonlinear relationship between load and operation data make it difficult to predict the short-term load online, this paper proposes an adaptive multi-information source data fusion online prediction method for WTG load. Random forest (RF) and WaveNet time series (WTS) are established as subinformation source models, and the influence of input features and historical data on load prediction is considered from horizontal and vertical dimensions. In order to reduce the influence of original data completeness on load prediction, the deviation degree of load prediction of RF and WTS is analyzed. The deviation degree of the subinformation source model is used as the basis for judgment, and it is fused into a multi-information source load model with adaptive deviation degree analysis to predict the loads on the blades, tower top, and tower bottom of the wind turbine. According to the 15 MW semisubmersible offshore WTG load prediction example, the prediction error of this method is about 4% under normal data conditions and 6% under abnormal data conditions, and the calculation time of 200 sets of test data is 0.053 s, which meets the needs of pitch control and has the potential to be applied in the optimization of pitch control strategy.
1. Introduction
Large-scale wind turbine has become the mainstream development trend of cost reduction and efficiency in the wind power industry [1]. Accurate wind prediction method is also helpful for the maximizing the revenues of wind power producers [2] and microgrids with wind energy resources [3] in electricity markets. Large wind turbines will lead to larger structural loads while increasing power generation capacity. The goal of pitch control for large wind turbines is not only to achieve stable regulation of power but also to minimize structural loads [4]. Wind turbine generator (WTG) is a highly nonlinear system with aerodynamic-servo-elastic mutual coupling, and its wide range of pitch operating conditions, which is greatly affected by external wind speed fluctuations, has brought great challenges to the design of WTG pitch control [5]. WTGs are load calculated before they are put into service and are put into service after meeting the field requirements; however, there is no process of calculating the loads again for subsequent operations [6, 7]. Moreover, the main challenges in estimating WTG loads are the effect of rotating blades on wind speed and the interaction between multiple components such as the wind and the structure, which make the environmental loads more complex and variable.
At present, one of the relatively prominent problems is the inaccuracy of load calculation due to missing data that may lead to inaccurate load calculation [8]. It makes it difficult to analyze the loading situation of each part of the wind turbine during operation, which leads to possible damage of the wind turbine during operation [9, 10]. Wind and waves, as the two main environmental factors of offshore WTGs, have obvious random distribution characteristics, and the mutual coupling between the two will increase the complexity of the long-term limit response of offshore WTGs, coupled with the high operation and maintenance costs, the design reliability of offshore WTGs puts forward higher requirements [11]. In order to ensure the normal operation of offshore WTGs under the loads of complex wind and waves environments, it is necessary to analyze the effects of wind and waves environments on the limit loads and evaluate the loads of critical parts of offshore WTGs.
As the measurement accuracy is limited by data completeness when using a single source of information for modeling measurements, there may be a problem of increased error in the output of the subsource; for instance, the machine learning subsource requires a high quality dataset, and if the offshore WTGs are not able to provide high-quality modeling data, the accuracy of modeling for this subsource will not be guaranteed [12, 13]. The time-series load modeling results are also affected by the dataset, leading to possible fluctuations in the prediction of longer series. However, given the validity of time series, there is usually a large discrepancy between data with a large time span, which may negatively affect the measurements if they are directly applied to the task at hand [14]. When using a single source of information such as time series or machine learning to model measurements, the measurement accuracy is limited by the impact of data completeness and may have the problem of increasing output error of subsources of information. Literature [15–17] proposed D-S theory, Stacking, and Bagging methods for calculating fusion weights, respectively, but the abovementioned methods need to learn and train the data to be used based on the training set. Literature [18] proposed a short-term shock load prediction model based on multiobjective ant colony optimization, which utilizes a comprehensive empirical modal decomposition method to decompose the raw data into a set of sublayers to reduce the impact of faults on the shock load data and to solve the problem of a single global model limitation. Literature [19] proposed an online depth prediction model based on feature extraction using the Kendall correlation coefficient and Bayesian optimization algorithm to transfer the domain model parameters to the target domain model and solved the problem of insufficient historical data through the transfer prediction method. Literature [20] proposed a fusion weight calculation method based on the test set, and the biggest disadvantage of this method is that when calculating the weights, it is necessary to obtain the real value; at the same time, there are also directly based on the measured value of the weight calculation method such as the average weighting method, but the fusion method has high requirements on the completeness of the modeling data, and when the quality of the modeling data is poor, it will lead to the increase in the output error of the subinformation sources, resulting in the decline in the accuracy of the fusion results.
Load is an important target and feedback quantity for the optimization of wind turbine control strategy, but the traditional load calculation method based on dynamic simulation is no longer applicable, and fast and accurate load prediction based on operation data is of great significance for the optimization of wind turbine pitch control strategy. Therefore, a multi-information source fusion assessment method based on adaptive deviation analysis is proposed to address the problem of low accuracy of WTG load prediction due to poor data completeness. The method analyzes the degree of deviation of the subinformation sources according to the established subinformation source model and establishes a load prediction model for the fusion of multi-information source data according to the degree of deviation of the load prediction data points, which makes up for the drawbacks of the machine learning algorithm and the time-series algorithm. When some of the input data are abnormal, the data points with high prediction accuracy are selected by analyzing the degree of deviation of the subinformation sources, which weakens the influence of abnormal data caused by environmental factors on the prediction accuracy. This reduces the dependence of the load prediction model on the original data, improves the impact of data anomalies on the assessment of WTG loads, reduces the impact of uncertainty factors on WTGs caused by environmental factors, and improves the accuracy of WTG load prediction. The method proposed in this paper meets the needs of pitch control under the premise of guaranteeing the accuracy of load prediction and effectively improves the potential of online prediction and application potential of WTG loads.
2. Ultimate Load Modeling of Floating Wind Turbine Under Combined Wind and Wave Action
2.1. Analysis of Wind Turbine Operation Data and Load Correlation
In this paper, the 10 min data of six kinds of time-range data, namely, wind speed at hub height, pitch angle, wave, yaw error, generator speed, and power, are selected to analyze the load correlation of these correlation variables with the key parts of the external moments at the root surface of the blade of the wind turbine, the rotating moments at the top of the tower, and the bending moments before and after the tower base. Figure 1 gives the ordering of the load correlation of the key parts of the external moment of the root surface of the blade of the wind turbine, the rotating moment of the top of the tower, and the tower base front and rear bending moments.
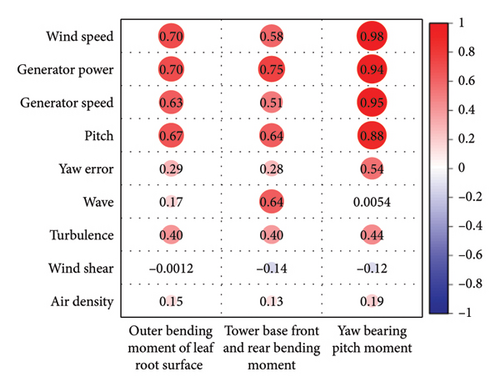
As can be seen from Figure 1, there are large differences in the relevant variables and their ordering for different load characteristics, the influencing variables of different load characteristics, and their degree of influence are different. This should be taken into account when establishing the load prediction model so as to establish a load prediction model with higher accuracy. In addition, it can be found that wind speed, generator power, generator rotational speed, and pitch angle have higher correlation on the tower base front and rear bending moments, the external moments on the root surface of the blades, and the yaw-bearing pitch moment. Yaw error is moderately correlated to the tower top rotational moment, wave is moderately correlated to the tower fore and aft bending moments, and turbulence is moderately correlated to the tower fore and aft bending moments, leaf root surface external moments, and yaw-bearing pitch moment. Wind shear and air density are weakly correlated to tower base front and rear bending moments, outer bending moment of leaf root surface, and yaw-bearing pitch moment.
2.2. Impact of Environmental Conditions on WTG Loads
According to the analysis in Section 2.1, the wind speed is strongly correlated to the external moments on the leaf root surface and the rotational moments at the top of the tower, and the waves are moderately correlated to the bending moments in front of and behind the tower base. The turbulence degree is a moderately correlated variable for tower base front and rear bending moments, leaf root surface external moments, and yaw-bearing pitch moment, respectively. The moderately correlated variables have a large effect on the WTG loads. It is necessary to consider the effects of wind speed, waves, and turbulence degree on WTG loads. This section focuses on analyzing the effects of wind speed, waves, and turbulence degree on the ultimate loads generated at different locations of the WTGs.
In order to analyze the effects of wind speed, waves, and turbulence on the tower bottom, tower top, and leaf root loads of the wind turbine, the environmental conditions with average wind speeds of 7, 9, 11, 13, and 15 m/s and turbulence of 8%, 10%, 12%, 14%, and 16% are set up to analyze the effects of wind speed and turbulence on the leaf root loads and tower top. The same wind speed, turbulence degree of 16%, and meaningful waves height of 4 and 0.1 m are set to analyze the effects of wind speed and waves on the blade root load and tower bottom. The mean, maximum, and standard deviation of the short-term dynamic response of each structure of the floating wind turbine are calculated using the floating wind turbine system dynamics model. Figures 2 and 3 show the effects of turbulence degree and meaningful waves’ height on the limiting response of offshore WTGs at different wind speeds, respectively.
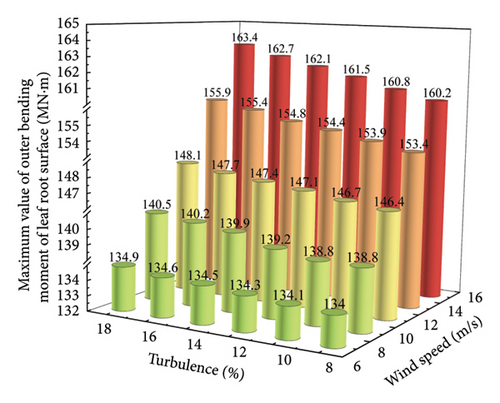
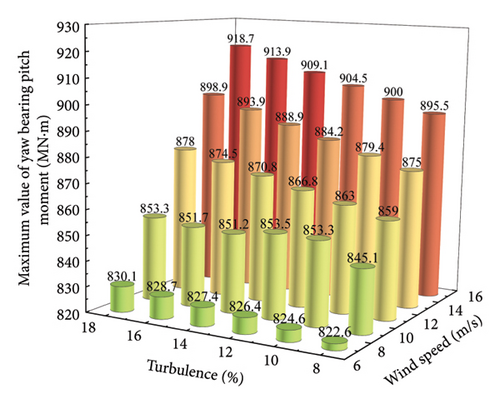
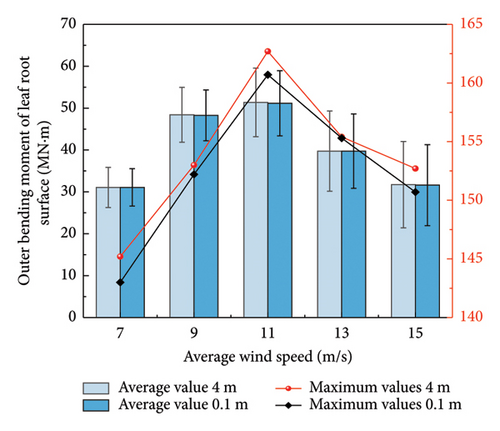
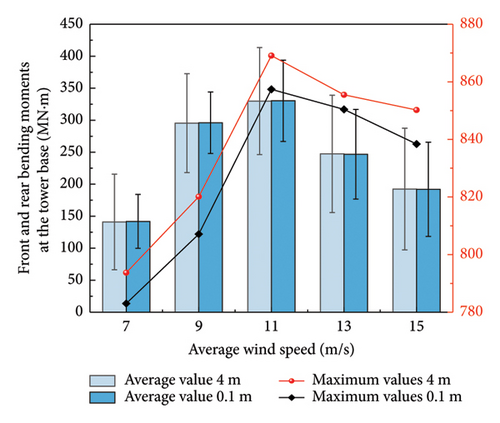
From Figure 2, it can be seen that the change of wind speed has a greater effect on the leaf root and tower top loads, and the change of turbulence degree has a smaller effect on the leaf root out-of-face bending moment and yaw bearing pitch moment. From Figures 3(a) and 3(b), it can be seen that with the increase of the average wind speed, the outer bending moment of leaf root surface and the tower base anterior and posterior bending moments appear to increase and then decrease and the response of each structure is the largest when the average wind speed is 11 m/s. At the same average wind speed, the meaningful waves height significantly affects the maximum value of the external bending moment of the leaf root surface and the bending moment in front and behind the tower base and has less effect on the average value of the outer bending moment of the leaf root surface and the bending moment in front and behind the tower base. At an average wind speed of 11 m/s, the maximum value of the outer bending moment of the leaf root surface with a meaningful waves height of 4 m increases by 1.25% and the maximum value of the bending moment in front and back of the tower base increases by 1.36% compared with that with a meaningful waves height of 0.1 m. The maximum value of the bending moment in front and back of the tower base increases by 1.36%. According to the analysis in Figures 2 and 3, it can be seen that the turbulence degree and the maximum value of the meaningful waves affect the change of the ultimate load of the wind turbine. Therefore, this paper investigates the WTG load assessment method under the consideration of wind speed and waves.
3. Online Prediction Method of WTG Load Based on Data Fusion of Multiple Information Sources
3.1. Random Forest (RF) Algorithm-Based Load Offset Degree of Deviation Analysis
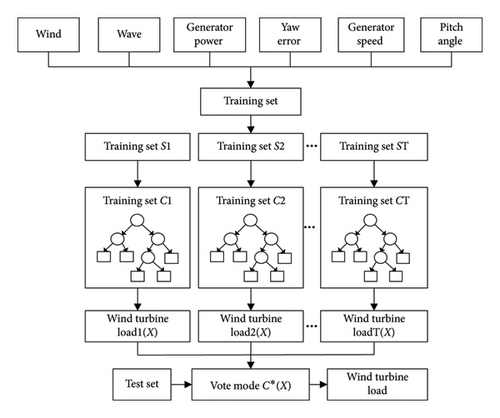
However, the RF algorithm requires high quality datasets, and if the WTGs cannot provide high-quality modeling data, the modeling accuracy of this information source will not be guaranteed. In order to judge the modeling accuracy of the information source, this paper analyzes the modeling effect of the RF algorithm through the degree of deviation. The degree of RF deviation is analyzed through the input variables, and if the input variables of the test set are closer to the modeling data center, it means that the output value at that moment has high accuracy. In order to improve the accuracy of WTG load calculation, according to the correlation analysis of WTG loads in Section 2.1, it is known that the correlation degree of wind speed, wave, power, yaw error, rotational speed, and pitch angle is higher, so wind speed, wave, power, yaw error, rotational speed, and pitch angle are selected as the input variables for the prediction of the WTG front and rear bending moments at the base of the tower the external moments at the root surface of the blades and the yaw-bearing pitch moment.
3.2. WaveNet Time Series (WTS) Algorithm Based Load Offset Degree of Deviation Analysis
Wind turbine belongs to the nonlinear power system, the load of the turbine is affected by many factors such as environmental factors, turbine characteristics, control strategies, etc., and the load and many factors present a complex nonlinear state. However, the WTS method is able to effectively establish complex nonlinear relationships and is suitable for dealing with highly nonlinear time series. Therefore, in order to reduce the impact of linearization on WTG load prediction, this paper uses WTS method to achieve WTG load prediction. The modeling process of the WTS algorithm is shown in Figure 5.
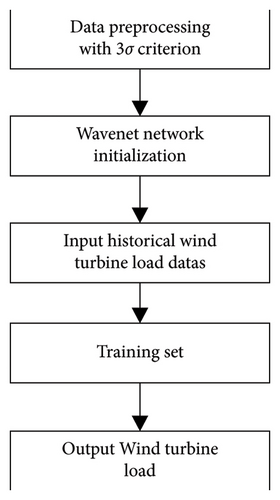
Time-series analysis methods can be used to conduct load measurement studies directly from the perspective of historical time series of WTG loads. Compared with traditional WTG load measurement methods, time-series modeling can use mathematical statistics to predict the predicted value of loads for a future period of time simply by analyzing the correlation between historical load time-series data [24, 25]. Because time-series modeling analyzes the impact of load forecasts directly from historical data of WTG load forecasts, it has a higher prediction accuracy than simple statistical methods. The method focuses only on the characteristics of the data itself and does not take into account the influence of external potential characteristics on the data, so it has a strong usability and operability.
3.3. Data Fusion Load Prediction Method Based on the Degree of Deviation Analysis
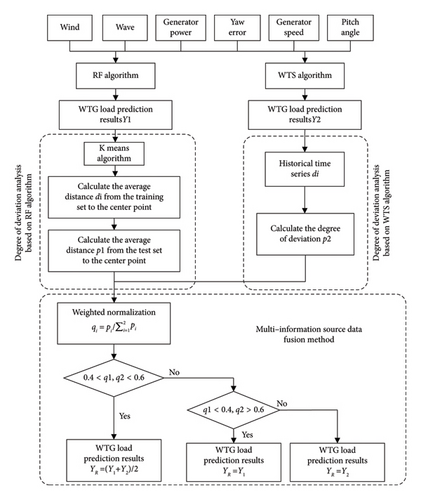
When modeling with the RF algorithm or WTS algorithm, the measurement accuracy is limited by the influence of data completeness, and there may be the problem of increasing output error of subinformation sources. In order to reduce the impact of data completeness on the modeling of WTG load prediction, this paper proposes a WTG load prediction modeling method based on adaptive multi-information source data fusion. The method takes the RF algorithm and WTS algorithm as the subinformation sources and uses the offset degree analysis of the RF algorithm and WTS algorithm as the judgment basis.
- 1.
If the two information sources q1 and q2 satisfy 0.4 ≤ qi ≤ 0.6 at the same time, it means that their respective degrees of deviation are more similar, and at this time, the fused output value is calculated using the following equation.
() - 2.
If q1 < 0.4 and q2 > 0.6 are satisfied in the two information sources, it means that the degree of deviation of each is large, and it is necessary to select the value with smaller degree of deviation as the output value, and at this time, the fused output value is calculated using the following equation.
()
In equations (6) and (7), q1 and q2 denote the degree of RF deviation and the degree of WTS deviation, respectively; Y1 and Y2 denote the output values selected by the RF algorithm and the WTS algorithm, respectively, according to the degree of deviation of each data point; and YR denotes the output value of fusion of multiple information sources.
4. Load Prediction Algorithm Process Based on Data Fusion of Multiple Information Sources
- 1.
First, two information sources RF and WTS were established as subinformation sources, and the effects of auxiliary variables (input data such as wind speed, wave, rotational speed, and power) of load prediction and load historical data on load prediction were considered in both horizontal and vertical dimensions. Next, the data deviation of the load prediction data from the real load data based on the subinformation source RF and WTS methods are analyzed. The multi-information source fusion algorithm is dynamically weighted according to the deviation of each test data from the WTG load modeling data, which makes the multi-information source fusion more flexible, gets rid of the constraints of the fixed-value limitation, and reduces the impact of the increased error of the output values of the information sources of the RF algorithm and the WTS algorithm on the overall fusion results.
- 2.
Finally, with the degree of deviation of the subinformation sources as the basis for judgment, the fusion method proposed in this paper is fused into a multi-information source wind turbine load prediction model with adaptive deviation analysis, which reduces the impact of incomplete modeling data on the fusion results, achieves the advantages of each information complement each other, and meets the needs of pitch control of wind turbines by guaranteeing the accuracy of load prediction and at the same time, its load prediction computation time. It can guarantee the load prediction accuracy while the load prediction calculation time meets the needs of wind turbine pitch control, which effectively enhances the potential of online prediction and application of wind turbine loads.
5. Simulation
5.1. Performance for Simulation Environment
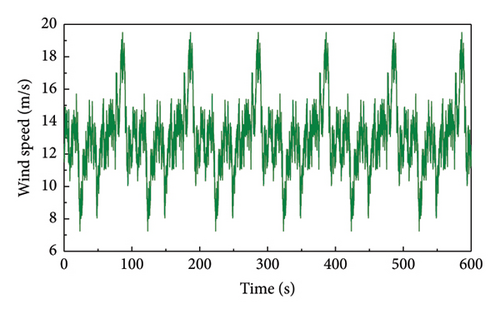
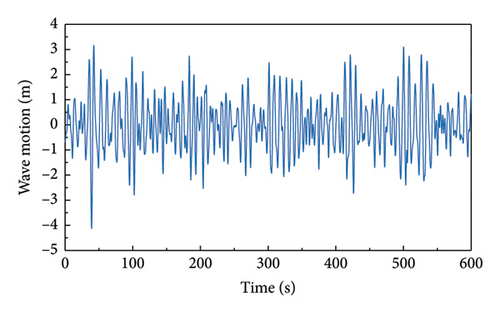
In this paper, Open Fast software is utilized to perform load simulation calculations on Nreal 15-MW semisubmersible offshore wind turbine, and the feasibility of the data fusion algorithm of multiple information sources is verified through Python. The hardware configuration of the simulation environment is a Windows 11 system PC with single core CPU, processor AMD Ryzen 7 5800H with Radeon Graphics, 3.20 GHz, and 16 GB RAM computer. The main parameters of the offshore wind turbine and the environmental working condition parameters are set as shown in Tables 1 and 2. In order to show the environmental conditions more graphically, Figure 7 shows the wind speed waveform with a mean wind of 13 m/s and a turbulence of 16% and the waveform with a meaningful wave height of 4 m, respectively.
| Parameter name | Parameter value |
|---|---|
| Rated power of wind turbines | 15 MW |
| Impeller diameter | 126 m |
| Cut-in wind speed | 3 m/s |
| Rated wind speed | 9 m/s |
| Cut-out wind speed | 25 m/s |
| Gearbox speed ratio | 105 |
| Wind turbine moment of inertia | 65 kgm2 |
| Minimum generator speed | 100 rad/s |
| Rated speed of generator | 122.91 rad/s |
| Tower first-order frequency | 0.219 Hz |
| Tower first-order modal weight | 269,640 kg |
| Tower first-order modal damping | 144% |
| Wheel height | 105 m |
| Optimum pitch angle | 0 deg |
| Maximum pitch rate | 6 deg/s |
| Minimum pitch rate | −3 deg/s |
| Rated torque | 1.003 × 10⁶ Nm |
| Air density | 1.225 kg/m3 |
| Maximum torque | 1.103 × 10⁶ Nm |
| Top of tower | 3.87 m |
| Tower base diameter | 6.5 m |
| Parameter name | Parameter value |
|---|---|
| Simulation time | 600 s, step size: 0.1 s |
| Wind speed | 13 m/s |
| Turbulent wind model | TURBSIM |
| Wind load modeling | NTM |
| Turbulent wind spectrum | IECKAI, step size: 0.05 s |
| Turbulence intensity | 16% |
| Range of turbulent wind fields | 300 × 298 m |
| Waves spectrum type | JONSWAP, step size: 0.25 s |
5.2. Evaluation Indicators
5.3. Simulation Validation of Offshore WTG Load Prediction Based on Multi-Information Source Data Fusion Approach
5.3.1. Average Weighted Method-Based Load Offset Degree of Deviation Analysis
5.3.2. Validation of Algorithms for Fusion of Multiple Information Sources in Case of Data Health
In order to verify the accuracy of the multi-information fusion algorithm for wind turbine load prediction, the load prediction accuracy of Nreal 15-MW semisubmersible offshore wind turbine is simulated and verified by Python. The accuracy of the proposed method is verified by comparing the RF algorithm, WTS algorithm, and average weighting method. The simulation environment is shown in 5.1, and a total of 3000 data are obtained. The wind speed, wave, rotational speed, and pitch angle are taken as inputs, and the external moments on the leaf root surface, rotational moments at the tower top, and bending moments at the tower base front and rear are taken as outputs, and the first 2000 data are used for the training set, and 200 data are randomly selected for testing.
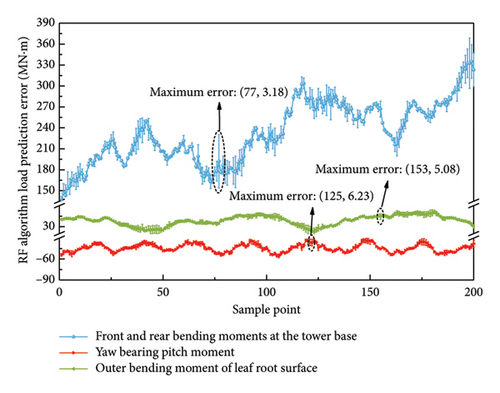
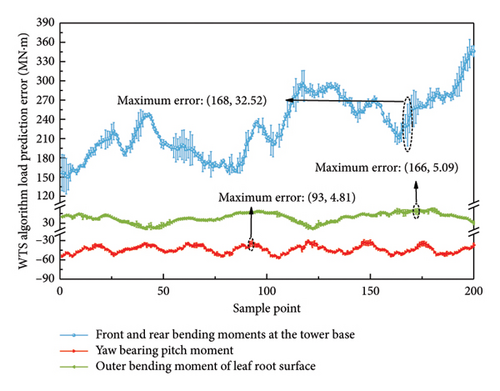
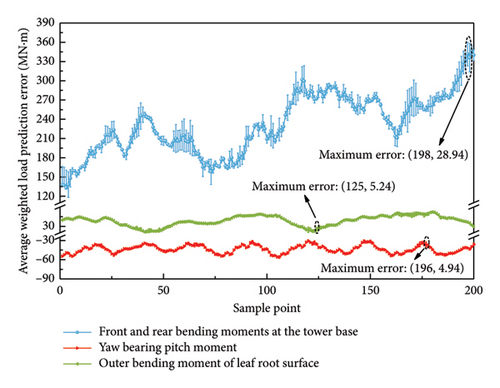
Figure 8 shows the results of blade, tower top, and tower bottom load prediction and error analysis under RF, WTS, average weighted method, and multiple information source data fusion algorithm. The length of the error bars represents the magnitude of the load prediction error. Longer error bars represent larger errors and shorter error bars represent smaller errors. The results of the model measurement effectiveness evaluation metrics RMSE, MAE, and R2 for different algorithms at data health are shown in Table 3.

| Offshore wind turbine critical loads | Outer bending moment of leaf root surface | Yaw-bearing pitch moment | Front and rear bending moments at the tower base | ||||||
|---|---|---|---|---|---|---|---|---|---|
| Algorithm name | RMSE | MAE | R2 | RMSE | MAE | R2 | RMSE | MAE | R2 |
| RF algorithm | 0.12 | 0.10 | 0.91 | 0.15 | 0.04 | 0.89 | 0.39 | 0.35 | 0.88 |
| WTS algorithm | 0.36 | 0.25 | 0.92 | 0.40 | 0.32 | 0.90 | 0.37 | 0.29 | 0.91 |
| Average weighted fusion methods | 0.25 | 0.14 | 0.93 | 0.31 | 0.19 | 0.94 | 0.27 | 0.24 | 0.93 |
| Multi-information source data fusion | 0.12 | 0.07 | 0.98 | 0.13 | 0.11 | 0.97 | 0.21 | 0.15 | 0.95 |
Analyzing Figure 8 and Table 3, it can be seen that both subinformation sources have good measurement accuracy, and the measured values are closer to the real values after weighting the subinformation sources by the average weighting method and the multi-information source fusion algorithm. However, the prediction accuracy of the average weighting algorithm is still affected by the poor single information source, and the multi-information source fusion algorithm can reduce the influence of the single information source on the prediction accuracy of the WTG load, and the overall prediction error is about 4%.
5.3.3. Validation of Multisource Fusion Algorithms Under Data Anomalies
Since the traditional algorithm cannot screen the data, when missing data or abnormal data occur, the abnormal data will affect the load prediction accuracy and reduce the load prediction accuracy. However, the multi-information source data fusion algorithm proposed in this paper selects RFs and WTS as single information source algorithms, and according to the characteristics of single information source algorithms, it reduces the dependence on the original data by analyzing the degree of deviation of each data point to set the data point weights. The accuracy of WTG load assessment is improved without data screening and data cleaning.
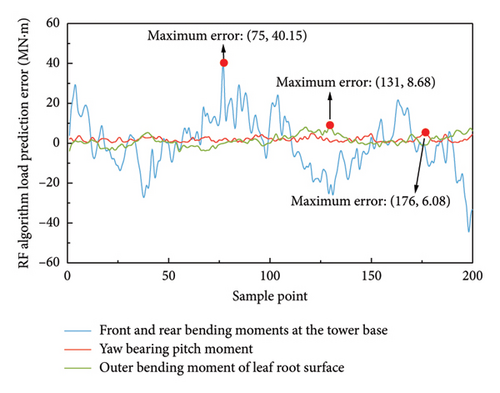
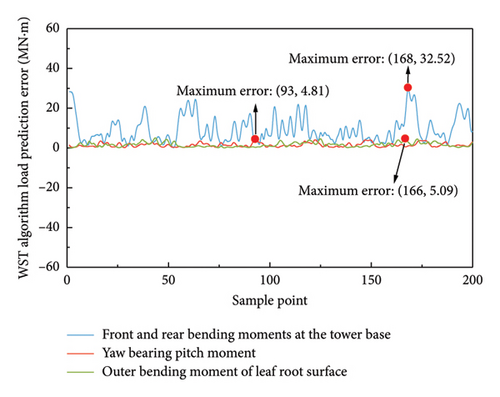
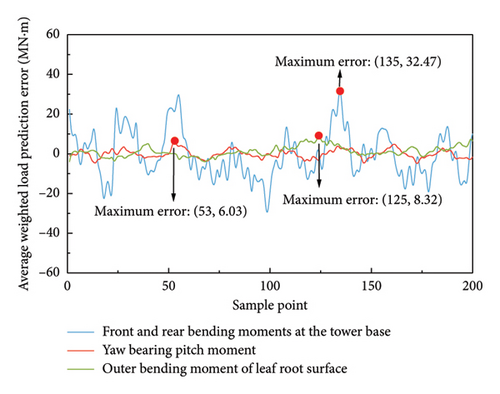
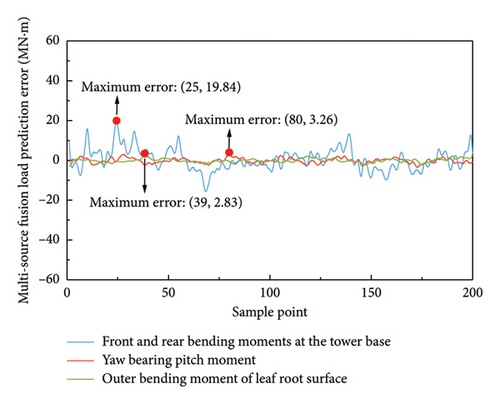
In order to verify that the multi-information source data fusion algorithm has a certain degree of fault tolerance for anomalous data, in this paper, 300 wind speed anomalies are added as working conditions when the communication equipment of WTGs operates unstably, and the accuracy of RF algorithm, WTS algorithm, average weighting method, and multi-information source fusion method for offshore WTGs load assessment is compared. Figure 9 shows the comparison results of WTG load assessment when wind speed data are abnormal. The results of RMSE, MAE, and R2, which are the evaluation indices of model measurement effectiveness of different algorithms when wind speed data are abnormal, are shown in Table 4.
| Offshore wind turbine critical loads | Outer bending moment of leaf root surface | Yaw-bearing pitch moment | Front and rear bending moments at the tower base | ||||||
|---|---|---|---|---|---|---|---|---|---|
| Algorithm name | RMSE | MAE | R2 | RMSE | MAE | R2 | RMSE | MAE | R2 |
| RF algorithm | 0.62 | 0.59 | 0.71 | 0.65 | 0.63 | 0.68 | 0.68 | 0.61 | 0.70 |
| WTS algorithm | 0.36 | 0.25 | 0.92 | 0.40 | 0.32 | 0.90 | 0.37 | 0.29 | 0.91 |
| Average weighted fusion methods | 0.49 | 0.47 | 0.79 | 0.58 | 0.58 | 0.77 | 0.56 | 0.52 | 0.78 |
| Multi-information source data fusion | 0.22 | 0.16 | 0.95 | 0.24 | 0.21 | 0.94 | 0.28 | 0.30 | 0.93 |
Analyzing Figure 9, it can be seen that after adding 300 sets of anomalous data, the maximum value of load prediction error of the RF algorithm and average-weighted method is significantly higher than that of Figure 8 (the maximum value of healthy data); Figure 9(b) has the same prediction error as that of Figure 8(b), which indicates that the WTS algorithm is unaffected by the anomalous data on the wind speed; although there are fluctuations in load prediction error of the multi-information source data fusion method, the load prediction error fluctuation is small. From Figure 9, it can be seen that the multi-information source data fusion method is obviously better than the other three methods, and the load prediction error is minimized, which indicates that the load prediction data are closest to the real value.
From Table 4, it can be seen that when the wind speed data are abnormal, the prediction accuracy of the RF algorithm is greatly affected, and the prediction accuracy is much lower than that of the normal dataset. The prediction accuracy of the WTS algorithm is unaffected due to the fact that it only uses the loads as the training set and does not use the wind speed variable as the input variable; the average weighted algorithm is affected by the prediction accuracy of the RF algorithm, which results in a much lower prediction accuracy; the computational accuracy of the multi-information source fusion algorithm is lower than the prediction accuracy when the normal dataset is used, but the overall prediction error is 6%, which is a high prediction accuracy compared with other methods. It proves that the multi-information source fusion algorithm has a certain degree of fault tolerance for abnormal data.
5.3.4. Computational Time Analysis of Data Fusion Methods for Multiple Information Sources
In order to verify the computational speed of the algorithms proposed in this paper, this paper simulates the computational time of the RF algorithm, the WTS algorithm, the average weighting method, and the multisource data fusion algorithm with 200 groups of test data. Figure 10 shows the computation time of 200 groups of test data under different methods.
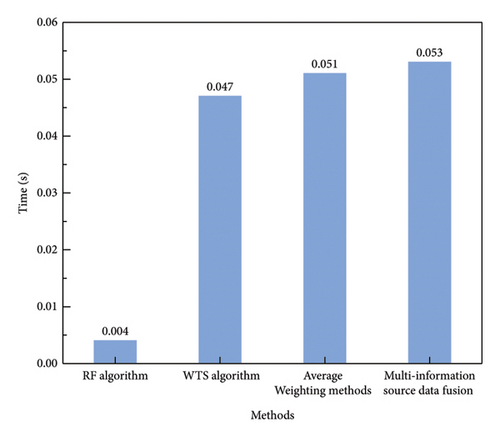
As can be seen in Figure 10, the computation time of the RF algorithm is 0.004 s, the computation time of the WTS algorithm is 0.047 s, the computation time of the average weighting method is 0.051 s, and the computation time of the multi-information source data fusion method is 0.053 s. The multi-information source data fusion method has the longest computation time but meets the needs of wind turbine pitch control under the premise of improving the load prediction accuracy and has the potential for the application of online prediction of wind turbine loads.
6. Conclusion
- 1.
By analyzing the correlation of different input variables on different locations of WTGs, it can be seen that there are obvious differences in the influencing variables and their correlation ordering of the load characteristics at different key locations of WTGs, which should be taken into account when constructing the load prediction model in order to obtain the model with higher prediction accuracy. By analyzing the influence of wind and wave on the limit load of WTGs, it can be seen that wind speed and wave have different influences on the loads at different locations of WTGs, and in order to make the load assessment of WTGs more universally adaptable, the influence of wind and wave on the load prediction model should be taken into account when constructing the load prediction model of WTGs.
- 2.
On the basis of considering the impact of wind and waves on offshore wind turbine loads, the offshore wind turbine load prediction model is constructed by using a multi-information source fusion algorithm with adaptive deviation analysis. When some of the input data are abnormal, the data points with high prediction accuracy are selected by analyzing the degree of deviation of the subinformation sources, which weakens the influence of abnormal wind speed data on the prediction accuracy. The dependence of the load prediction model on the original data is reduced, and the accuracy of the load prediction is improved. Compared with the RF algorithm, the WTS prediction algorithm and average weighted algorithm with a single source of information, the average error of the proposed algorithm is 4% for the load prediction of the key parts under normal data conditions, and 6% for the load prediction of the key parts under abnormal data conditions, and the computation time is 0.053 s for 200 sets of test data, which meets the requirements of the pitch control cycle of wind turbines, and effectively improves the potential of online prediction and application of wind turbine load.
In fact, during the operation of WTGs, there are cases of sudden changes in operating conditions caused by environmental factors. On the basis of this paper, it is necessary to further study the wind turbine load prediction method considering the sudden change of working conditions. Considering sudden changes in operating conditions, it is inevitable to increase the training set of data for different operating conditions. After the increase of the training set data, the training time will be greatly increased, which puts forward higher requirements on the computational performance of the model. Therefore, further research on online optimization of WTG load prediction considering sudden change of working conditions will help to improve the engineering practicability of the model.
Conflicts of Interest
The authors declare no conflicts of interest.
Funding
This work was supported in part by the Science and Technology Project of SGCC (Research on electromechanical coupling mechanism and control method of wind turbine during grid fault considering security constraints) (4000-202355454A-3-2-ZN).
Acknowledgments
This work was supported in part by the Science and Technology Project of SGCC (Research on electromechanical coupling mechanism and control method of wind turbine during grid fault considering security constraints) (4000-202355454A-3-2-ZN).
Open Research
Data Availability Statement
The authors do not have permission to share data.


