Hosting Capacity Enhancement Utilizing Small Pumped-Hydro Storages in Rural Distribution Networks
Abstract
Renewable energy sources (RESs) are growing exponentially due to need for sustainable energy. The hosting capacity (HC) is the amount of RESs that can be installed in a distribution network without exceeding its operational limitations, such as bus voltages and line flows. Energy storage systems (ESSs) have been utilized to enhance the HC in the literature. However, high investment cost of ESSs is the main obstacle to their widespread deployment. This highlights value of multipurpose energy storages (MPESs) that have multiple purposes besides the electrical aspect. Potential in the irrigation of the agriculture sector based on small pumped-hydro storages (PHSs) has been employed in this paper to enhance the HC of rural distribution networks. For this purpose, a new practical model has been proposed for the PHS considering residential and agricultural water consumption management. Also, the HC of the distribution network for photovoltaic is investigated based on a mixed integer nonlinear programming (MINLP) model. Simulation results on the IEEE 33-bus test system in GAMS and the comparison with the ESSs showed that the PHSs in addition to their main application increase the HC by 70 kW and reduce the cost and losses by 36 kWh and $47,562, respectively.
1. Introduction
Environmental concerns, population growth, and the increase in per capita energy demand have highlighted the need for sustainable energy sources in various nations [1]. Nevertheless, the dominant sources of energy worldwide are still fossil fuels, which are finite and one of the main roots for global warming. Renewable energy sources (RESs), particularly photovoltaics (PVs) and wind turbines (WTs), are currently growing quickly in order to handle the aforementioned concerns [2]. As the world confronts climate change and the need for sustainable solutions, it becomes crucial to evaluate the carbon footprint of various electricity generation technologies [3]. However, integration of RESs into the electrical grid is one of the major obstacles on the way of this progress. Traditional power systems are developed based on the concept of centralized and bulk generation, transmitting power over long distances, and passive distribution networks. This is incompatible with the distributed nature of the majority of RESs, which must be connected to the downstream distribution networks [4]. With this mind, the hosting capacity (HC) index [5] is defined as the maximum amount of RES that can be integrated into the distribution networks without exceeding the operational limits.
The HC of a network can be impacted by a wide variety of factors, including the operating limits of the buses voltage [6], the thermal capacity of the lines, harmonics [7], losses, congestion, and so on [8]. In most cases, the increasing penetration of distributed generations (DGs) may lead to the occurrence of reverse power flow in distribution networks, which is against the existing paradigm of these networks and causes an increase in bus voltages, line flows, and network losses [9]. Moreover, the growth of distributed RESs can also impact the distribution networks power quality, especially harmonics [10], and network protection strategies, especially relay coordination [11].
There are various estimation approaches (three categories of conventional, modified, and data-driven) for calculating the HC of specific distribution networks [12, 13]. The most common method is to use an optimization model for calculating the maximum capacity of RESs that can be integrated into the distribution network without causing any violation [14]. Other methods, including machine learning approaches, have also received attention in recent years [15]. Besides, there are various methods for enhancing the HC including the complementary renewable production patterns [16], generation curtailment (GC) in challenging conditions [17, 18], using different demand response (DR) programs [19, 20], network reconfiguration (NR) in traditional [21] and hybrid [11] networks, on-load tap changer (OLTC) [22], reactive power control of convertors [23], and so on that can be used depending on the conditions, potentials, and investment budget [24].
In the last 2 decades, various power system applications such as network loss reduction [25] and voltage profile improvement [26] have been proposed for energy storage systems (ESSs). The optimal allocation (e.g., using different metaheuristic algorithms) of these ESSs along with the DGs is still a hot topic in the literature focusing on the distribution networks [27]. Also, storages, i.e., mostly chemical battery energy storages (BESs), have been used in different ways to improve the RESs’ HC in distribution networks. For example, the PV HC of the Switzerland distribution network is investigated in [28] and the need for storage devices is determined in order to increase this crucial value. In [29], the planning of storages for increasing the HC is formulated based on a trilevel optimization model considering the nondeterministic location of the RESs. The battery management is utilized in [30] along with the PV forecasting (based on deep learning) to alleviate the congestion issue and consequently increase the HC. Such studies highlight the role of modern learning-based method of forecasting (e.g., load prediction based of deep learning [31]) for efficient planning and operation of power systems.
Despite various benefits, the relatively expensive cost of battery storage devices prevents the widespread use of this technology [32]. Therefore, multipurpose energy storages (MPESs) that have other applications besides the electrical energy (e.g., transportation, heat, and irrigation) can justify the use of storages in the power system from the economic viewpoint [33]. The effects of different MPES types, such as multicarrier energy storages [34], electric vehicles [35], and hybrid ESSs [36], on the renewable integration and the distribution network HC are investigated in the literature in recent years along with their other numerous applications and benefits. In [37], some of the advancements in network-connected hybrid storage devices are reviewed, focusing on components, design, control, and applications.
The studies in the literature of pumped-hydro storages (PHSs) are mainly focused on the potential evaluation and utilization of these devices along with RESs in order to supply the required energy and water of hybrid systems. Jurasz et al. [38] studied the potential of small-scale pumped reservoirs located in urban areas using the height of high buildings. In [39], the potential of elevated water storage for supplying building’s water needs is investigated in order to enhance the HC of rooftop PVs in an urban distribution network. Also, a new method to minimize the daily cost of a hybrid system (PV and PHS) with the possibility of grid connection is developed [40].
Some of the studies are focused on the model development aspect of PHSs. Mousavi et al. [41] developed a new model of PHS that can be used for farmhouses with PV systems. The designed system considers PV power, energy and water demand, energy tariff, and PHS losses to determine the pump power and turbine flow rate. Mousavi et al. [42] examined the existing irrigation infrastructure for additional PV energy storage, including a reservoir and a water well, and utilized the depth of water well to store energy in the form of gravitational potential energy. The water planning for domestic and agricultural sector consumption is not differentiated in aforementioned models, and the capacity of the electricity network and its limitations are not included in the model of Pali and Vadhera [43], where the electricity demand of a rural isolated power grid is supplied using a small wind energy system with PHS utilizing an open well as a water source.
All the abovementioned papers have discussed the benefits of this type of energy storage (mainly based on hybrid isolated system), but none of them have examined their impact on distribution network HC. No case study has previously taken at how this storage type can facilitate the integration of RESs. Also, no PHS model is presented, handling the water management across multiple sectors and resolving the issue of electricity and water consumption dependency.
The main goal of this paper is to enhance the distribution network HC by utilizing the potential of MPESs. The present paper focuses on the possibility of using the elevated reservoirs and water well for the agricultural water management as a PHS in order to enhance the HC of the distribution network of rural areas. This is a topic that has not been studied in the literature to the authors’ knowledge. For having a realistic assessment and comparison, distributed and centralized BESs have been investigated in the study. Also, from the restricting factor viewpoint of HC calculations, the paper concentrates on the bus voltages and the thermal capacity of the lines. It must be mentioned that the present paper describes the operation of a distribution network and its technical constraints in a specified period of time (e.g., yearly) based on a mixed integer nonlinear programming (MINLP) model to determine the PV HC in presence of various storages, especially PHSs as a type of MPESs.
To do so, a new extended model of PHSs is proposed considering the agriculture and home water management aspects of this specific type of MPES. It is assumed that the distribution network consists of large rural areas with distributed agricultural centers, some of which (e.g., 10 centers) are equipped with the PHS for their water management. According to this assumption, by storing energy through transporting water to a higher reservoir (either based on natural topography or human-built) during the hours when the most power generation is obtained from PV and hours with low electricity demand, one can increase the network HC. This utilization of the potential from the existing infrastructure in the agriculture sector can justify the economic aspect of using ESSs to improve the behavior of electricity networks.
- 1.
Improving the HC and reducing the network costs and losses of distribution network utilizing the MPES, i.e., PHS, based on MINLP optimization model.
- 2.
Presenting an extended PHS model considering the water management of residential and agricultural sectors and other MPES practical limitations.
The rest of the paper is organized as follows. In Section 2, the formulation of the HC problem is presented. The new PHS model is proposed in Section 3. The numerical results of applying the proposed model on the IEEE 33-bus test system are demonstrated and discussed in Section 4. Finally, the paper is concluded in Section 5.
2. The Extended HC Model
In this section, the objective functions and various constraints related to the extended optimization problem of distribution network HC are presented. As mentioned earlier, the model is presented in the form of a MINLP optimization. Planning-type optimizations (like HC studies) must be executed based on consideration of various conditions. To do so, the problem is formulated in a multiperiod fashion integrating different time slots (often hours). In the literature of HC studies, this is commonly implemented based on a few chosen days throughout the year as representatives.
2.1. Objective Functions
2.2. RES and Load Model
2.3. Storage Model
2.4. AC Power Flow Constraints
2.5. Distribution Network Constraints
3. Proposed PHS Model
A comparison between MPES (PHS as the specific example) and ESS (BES as the specific example) is presented in Table 1. Conceptually, the most important difference is the application of PHS in two different fields (electricity and water management), which can justify the high cost of storage systems and make their utilization more widespread. From the modeling perspective, the most important issue is additional cycles of water consumption, which requires the development of a new formulation.
| ESS emphasizing on BES | MPES emphasizing on PHS | |
|---|---|---|
| Main goal | They are used only for purposes related to electricity and fulfill purposes such as energy arbitrage, peak shaving, and so on. | They are usually developed with additional purposes alongside electricity (e.g., agricultural and residential water supply) which can justify the storage high cost. |
| Energy capacity | They are often small in size. Although they do not have a limit in terms of capacity, making them in larger sizes often increases the cost. | They require a lot of space due to the use of tanks for water storage, and due to the installation at an elevated height, they are usually not designed in very large scale. |
| Power | Usually, their power is about 25% of their energy capacity. | They usually have less power with respect to their energy capacity, compared to BESs. |
| Distribution | They can be used in different types according to the purpose, i.e., distributed (better for losses) or centralized (better for HC). | They are distributed by nature because in the centralized form, they require a larger storage tank and a higher installation height, which may be impractical. |
| Time limitation | There is no limit to the time and amount of charging and discharging and this can be done based on the network needs and opportunities. | Due to being used for water supply as their primary purpose, they may face limitations in terms of water supply for utilization in motor and generator modes. |
| Efficiency | Charging and discharging efficiency is often the same and high (around 90%). | Their efficiency is around 80%, generally different for motor and generator modes. |
| Partial discharge | In the modeling, there is generally no partial discharge coefficient. | Some of the water stored may be lost due to surface evaporation phenomena. |
| Emissions | Various types of BESs release considerable emission mainly related to their construction phase | PHSs have relatively low emissions compared to the BESs, mainly attributed to their clean operational phase |
As presented in Figure 1, the water consumption of the agriculture sector is schedulable based on the required volume and the irrigation period of various products. Besides, the water consumption profile of other sectors, especially residential, can be predicted. The model should also consider other unique characteristics of these storages, including physical and temporal limitations and partial discharge phenomena. Based on this, Figure 2 presents the schematic of proposed model for the PHS in the present paper. Additionally, the developed formulation is presented in (23)–(35).

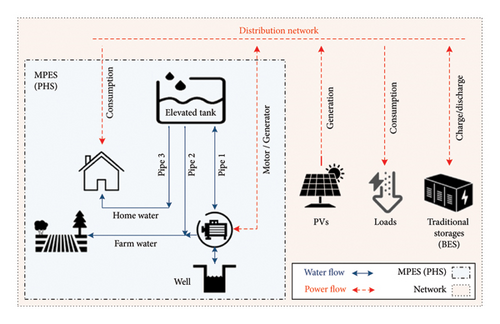
The elevated tank is generally used to store energy in the form of water at a height (e.g., 30 m). The lower tank is assumed to be an underground well with no restrictions in terms of volume (energy) and rate (power). Three major pipes are connected to the elevated tank. Pipe 1 is designed to link to the motor/generator and change the tank stored water while consuming/generating electricity at the same time. Pipes 2 and 3 are designed to directly provide the farm and home water consumptions, respectively.
The existence of these three pipes (as shown in Figure 2) and the consideration of separate paths for supplying water for domestic and agricultural use (dual role) have resulted in the independence of the water supply and electricity generation sectors. In addition, Pipes 1 and 2 are both for the agricultural water consumption, which has made electricity consumption/generation and PHS irrigation independent of each other. Water management for various purposes has been made possible by the proposed design (only one added pipe with negligible cost) solving the limitations of existing schemes regarding the force for water consumption to have electricity generation.
This capability is extremely helpful in the far-located rural areas without a distribution network. Also, where there is a network, it provides the opportunity to lower the cost of purchasing power from the upstream. Besides, the required water for irrigation can also be provided directly from the tank and flowing through the generator. This enables this storage to achieve its two crucial purposes (power consumption/generation and irrigation) independently and without any limitation.
4. Numerical Results
In this section, initially, the simulation data inputs are described. Then the network HC and purchasing cost from the upstream grid and losses are evaluated under various conditions. Moreover, the numerical results of different case studies are summarized and a brief economic analysis is provided. The proposed optimization MINLP model is implemented and solved in GAMS utilizing the Knitro solver. Also, all of the simulations are implemented on a PC with Intel Core i5-3337U CPU @ 1.80 GHz with 4 GB RAM.
The present paper focuses on developing a more complete model for PHS and demonstrating its positive impact on the HC of distribution networks. For this purpose, the implementations are performed on a standard IEEE test network as the benchmark providing straightforward reproducibility of the results for checking the reliability of findings. Consequently, there are no available real results for the comparison, while the validation of optimization (compared to conventional algorithms) is also presented.
4.1. Inputs of the Simulations
The network information and various inputs are provided in this section.
4.1.1. Network Information
The IEEE 33-bus distribution network has been used for the simulations, where Bus 1 is connected to the upstream grid [47]. The base voltage and apparent power of the network are 12.66 kV and 1 MVA, respectively. The total maximum active and reactive loads of the network are 3.7 MW and 2.3 MVar, respectively. The detailed parameters of lines and buses are summarized in Table A1 of Appendix A.
Without loss of generality, the present paper has assumed 24 h of 4 sample days (based on the logic of one day per season) to take into account different operating conditions, especially electricity load and water consumption patterns along with the agricultural irrigation characteristics. Note that the annual total electricity purchasing costs and overall network losses are converted form the 96 h values with a multiplier of 91.25, i.e., 365 divided by 4. The load profile coefficients of various buses are assumed to be similar, as depicted in Figure 3 along with PV generation coefficients. These important coefficients are presented in Table A2 of Appendix B in detail.
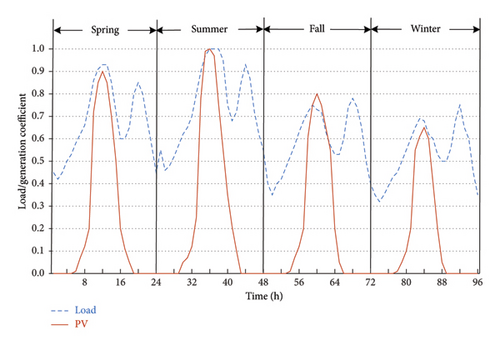
The voltage limitation is assumed to be in the range of [0.9–1.05] p.u. for all of the network buses. Due to the higher capacity of the lines close to the slack bus, the flow limit of lines is assumed to be 4.5 MVA, except for the lines connecting Buses 1 to 7 which have a 5 MVA capacity. The price of purchasing power from the grid is varying based on the ratio of Pgrid/Pmax, where for [0.9–1], [0.6–0.9], and [0.35–0.6], the prices are 260, 210, and 190 $/MWh, respectively [26].
4.1.2. Input Data of Various Enhancement Tools
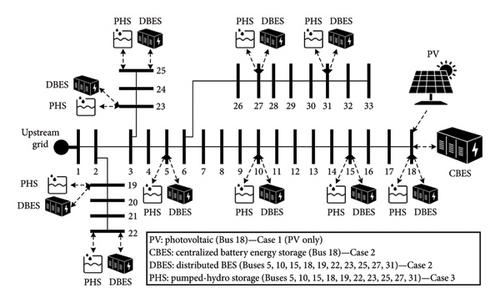
To find the best bus for the installation of PVs, all buses are considered as candidates, and according to the results of simple sensitivity analysis, Bus 18 is identified as the most tenacious bus in terms of bus voltages and line flow limitations. Therefore, without losing the generality, appropriate PV installation location is assumed to be on Bus 18. Centralized BES is also placed on Bus 18 to have the best mitigating (enhancing the HC) effect. Moreover, the power factors of PV are assumed to be 0.95.
Various installation locations including PHSs and distributed BESs are shown in Figure 4. The logic behind choosing these 10 buses (5, 10, 15, 18, 19, 22, 23, 25, 27, and 31) for the PHS is to consider the distributed nature of this storage type according to its utilization in agricultural farms of rural areas for irrigation purposes. The distributed BESs are assumed to be on the same buses for the sake of fair comparison.
As previously mentioned, the residential and agriculture sector consumption water needs can be, respectively, predicted and scheduled, the data of which are presented in Table 2 for each individual PHS. According to the home water, the peak daily water consumption () is presented in this table and the consumption profile coefficients (HWC(i, t)) are detailed in Appendix B dedicated to the forecasted values. A different total daily farm water consumption (WEEQfarm(i, td)) for each season is presented in the third row of Table 2. This total daily amount must be distributed in the specified irrigation hours, as listed in the fourth row of Table 2, based on the water limitation of the PHS pipes directly and indirectly supplying the farm. Other parameters of ESSs, including power and energy capacities, charge/discharge efficiencies, surface evaporation coefficient, and so on, are presented in Table 3.
| Parameter | Spring | Summer | Fall | Winter | Sector |
|---|---|---|---|---|---|
|
33 | 36 | 30 | 27 | Home water (predictable) |
|
250 | 300 | 200 | 200 | Farm water (schedulable) |
| Irrigation hours | 0–2 & 22–24 | 0–3 & 21–24 | 21–24 | 21–24 | |
| ESS | Input parameter | Value | |
|---|---|---|---|
| PHS | Maximum water volume of the tank | 500 m3 | |
| Minimum stored water volume in the tank | 50 m3 | ||
| Maximum stored energy in the tank | 40 kWh | ||
| Motor/generator power | 10 kW | ||
| Efficiency of PHS in motor mode | 85% | ||
| Efficiency of PHS in generator mode | 75% | ||
| Coefficient of surface evaporation | 5% | ||
| BES | Centralized | Maximum storable energy | 400 kWh |
| Minimum storable energy | 40 kWh | ||
| Charge/discharge power | 100 kW | ||
| Distributed | Maximum storable energy | 40 kWh | |
| Minimum storable energy | 4 kWh | ||
| Charge/discharge power | 10 kW | ||
| Charge/discharge efficiency | 85% | ||
4.1.3. Important Assumptions
- •
Distribution network HC
- ✓
From the perspective of HC limiting factors, the model focuses only on static aspects based on power flow (line flow and bus voltage limitations).
- ✓
The initial priority of the model is to improve HC (installed PV or OF1 in (1)) and subsequently reduce the costs (OF2 in (2)) enforcing the optimal HC.
- ✓
The key profiles of load, PV generation, and electricity price are considered as deterministic parameters, i.e., known inputs based on proper forecasting.
- ✓
The placement of equipment (PV, BES, and PHS) has been optimally executed previously or is known according to the physical constraints of their location.
- ✓
The reactive power aspect of storages is ignored and the voltage behavior is only affected by the reactive powers of loads, PV, and upstream network.
- ✓
- •
PHS model
- ✓
The structure of the PHS model (tank and well along with three pipes and a pump/generator) is the same for all PHSs as proposed in Figure 2.
- ✓
Key parameters such as the domestic water consumption profile are known as deterministic inputs (based on forecast) to the planner.
- ✓
The overall required agricultural water consumption parameter in different seasons and its hourly constraints (see Table 2) are known in advance to the planner according to the dominant crop type in the region.
- ✓
The physical characteristics of the PHS technology (such as efficiency, coefficient of surface evaporation, and so on) are known parameters (see Table 3) that have been assumed to be the same for all PHSs.
- ✓
4.2. HC Analysis
To evaluate the HC and the effectiveness of different enhancement methods, three case studies are considered in the simulations as described in Table 4. The two key HC limiting factors (bus voltages and line flow) are included in all the cases. Case 1 is focused on the initial value of PV HC in the network, i.e., without any enhancement methods. Case 2 has simulated the effect of centralized and distributed BESs (ESSs) on HC. Finally, Case 3 has studied the improvement on the network HC in the presence of PHSs, which is the main purpose of present paper.
| Case | HC constraints | RES | BES | PHS | ||
|---|---|---|---|---|---|---|
| Voltage | Flow | PV | Centralized | Distributed | ||
| 1 | ✓ | ✓ | ✓ | ✗ | ✗ | ✗ |
| 2 | ✓ | ✓ | ✓ | ✓ | ✗ | ✗ |
| ✗ | ✓ | |||||
| 3 | ✓ | ✓ | ✓ | ✗ | ✗ | ✓ |
Presenting the detailed results of all variables (either control or dependent) is not possible, especially considering the fact that there are numerous components (e.g., 10 distributed BESs) and some variables have a 96 h nature (e.g., charging power). The most significant outputs of the optimization process are HC (the main objective and control), the total electricity cost (converted to the yearly), and overall network losses (converted to the yearly), which are discussed separately for each case study (Sections 4.2.2 to 4.2.4) along with a comparison in Section 4.2.5. Additionally, specific results of each case study are selected based on its main design purpose.
Case 1 has focused on HC limiting factors like bus voltages (96 h profile of the worst bus in the network) and line flows (all branches in the worst hour). Focusing on the improvement by the BESs in Case 2, the 96 h profile of charge/discharge power (main decisions of batteries) of central BES and the SOC (indicating the overall behavior) of three selected distributed BESs are presented to discuss the issue. Similarly, in Case 3, the WEEQ profile (like SOC) of three selected PHSs is presented along with the 96 h motor and generator power (like charge and discharge) of one selected PHS. Also, the water passing through different pipes and the overall water management in agricultural and domestic sectors are presented for the study period.
4.2.1. Formulation Clarification and Calculation Flow
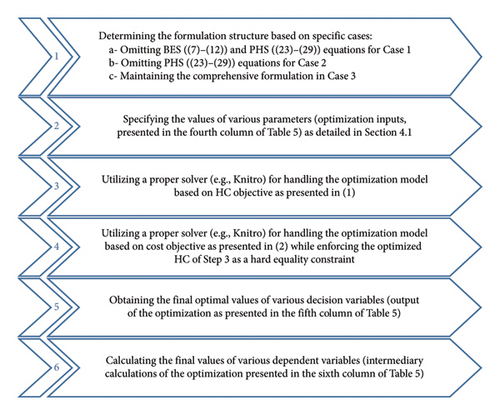
The variables (independent and dependent) and parameters of each section are separated in Table 5, aiming to improve the clarity of the presented formulations. The variables and parameters are discussed based on the general form of the optimization; hence, the presence or absence of different components (e.g., PHS and BES for enhancing the HC) is the distinguishing factor of case studies as previously detailed in Table 4. The calculations are executed through six major steps, as shown in Figure 5 clarifying the computation flow. Every step also outlines how each column of Table 5 must be handled in the calculation process.
| Component | Section | Equations | Parameters (inputs) | Independent variables | Dependent variables |
|---|---|---|---|---|---|
| Objective | 2.1 | (1), (2) | — | ICPV(i) | OF1, OF2, Cost(t) |
| RES | 2.2 | (3), (4) | GFPV(i, t), ΦPV (i) | ICPV(i) | PPV(i, t), QPV(i, t) |
| Load | 2.2 | (5), (6) | — | PD(i, t), QD(i, t) | |
| BES | 2.3 | (7)–(12) | , | PBES(i, t), SOC(i, t) | |
| Power flow | 2.4 | (13)–(17) | Z(i, j), θ(i, j), bgrid(i), Price(t) | — | P/Q(i, t), V/σ(i, t), P/Qgrid(t)P/QPV(i, t), P/QD(i, t)PBES/PHS(i, t), Cost (t) |
| Network | 2.5 | (18)–(22) | Vmin/max, Smax(i, j), Pmin/max, Qmin/max | — | Loss(t), P/Q(i, j, t),P/Qgrid(t) |
| PHS | 3 | (23)–(35) | βPHS(i), | , | WEEQtank(i, t), WEEQpipe1/2(i, t)PPHS(i, t), WEEQhome(i, t), |
4.2.2. Case 1—Initial HC of Network
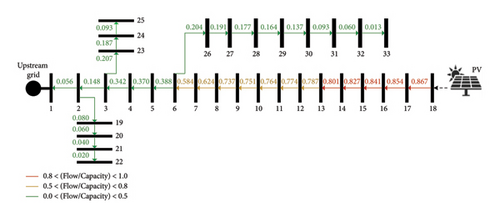
The HC, the total cost of energy purchase from the upstream grid (yearly), and total network energy losses (yearly) of this case are 3.995 MW, 3,068,432 $, and 1456 MWh, respectively. Despite the placement of PV on the end of the network main feeder (Bus 18), the thermal limits of the lines are affected leading to the HC restriction. Figure 6 shows the tension of various lines at 12 a.m. of the representative day of the summer (peak load and highest PV generation) in this scenario. The network lines in this diagram are colored according to the ratio of the aforementioned hour flow to the lines’ maximum capacity. As can be seen, in contrast to the traditional distribution networks, the farthest line (connected to the PV) from the upstream grid is the most tensioned line.
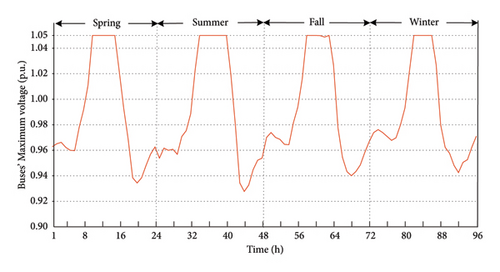
Converse to the traditional distribution networks that mainly deal with the undervoltage concern, overvoltage is one of the most important factors limiting the network HC (allowable size of PV that can be installed). To illustrate the effect of voltage issue on the problem, the maximum voltage of different buses throughout the network is calculated and the resulted 96 h profile is depicted in Figure 7. This is implemented due to the different voltages for various network buses, the detailed 96 h profile of which cannot be presented clearly. The figure indicates that the overvoltage is an important issue in the distribution networks, as at least 1 bus has reached the upper limitation of voltage (1.05 p.u.) in 20 h (from the total of 96). Both of the abovementioned uncommon phenomena are due to the presence of active equipment in the distribution network, i.e., PV, leading to the reverse power flow restricting the HC based on voltage and flow limits.
4.2.3. Case 2—Using BES for the HC Enhancement
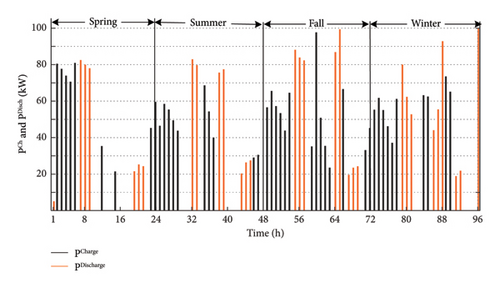
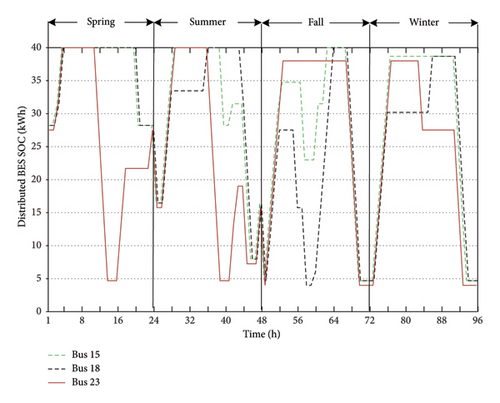
By placing the centralized storage on Bus 18 (based on Case 1), the HC increases by 248 kW and the total yearly cost of electricity purchasing decreases by $79,713. The charge and discharge powers of this battery (as the decision variables of the optimization problem) at different hours can be seen in Figure 8. During the hours when the maximum PV power is available, the centralized BES is often in the charging mode which means that the SOC is increasing. This stored energy is injected into the network usually during the hours with PPV = 0 and low electricity price, i.e., whenever is profitable. Installing distributed BESs on 10 selected buses as depicted in Figure 4 (see Figure 9 for the SOC of 3 distributed BESs as the example of different patterns) results in a 78 kW increase in HC and a $56,549 decrease in the total yearly cost. On the other hand, the centralized BES has caused a 47 MWh rise in yearly network losses, whereas the distributed BES has decreased it by 28 MWh.
4.2.4. Case 3—Using PHS for the HC Enhancement
By integrating 10 PHSs in the network as depicted in Figure 4, the HC (compared to Case 1) is increased by 70 kW and the cost of purchasing electricity from the network is reduced by $47,562. These storage devices also have caused a 36 MWh decrease in the network total losses. As can be seen, the improvement of the HC, total cost, and network losses using this type of MPES is comparable with the distributed BESs. The smaller effects on HC and total cost are not far from expected due to the nature of this storage type, i.e., additional nonelectrical purpose, lower efficiency, and surface evaporation. On the other hand, the PHSs have a more favorable effect on the network losses. The most important aspect of using PHSs is their multiple purposes compared to single purpose BESs, which make their utilization in the network more justifiable. In other words, they can fulfill their main goal, i.e., water management in the agricultural and residential sectors, while having a positive effect on the HC, cost, and losses.
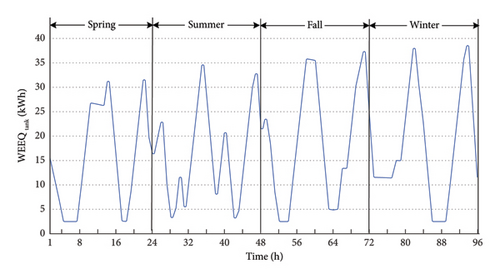
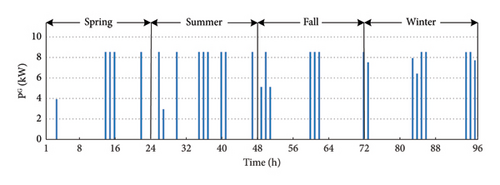
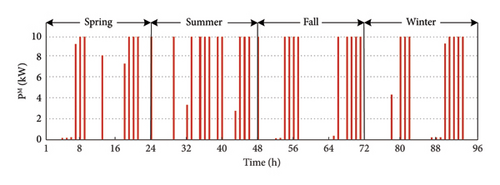
The WEEQ of a selected PHS elevated tanks (Bus 18) is shown in Figure 10 so as to depict the variation pattern of tank WEEQ level in the network. Also, the generator and motor powers of the PHS on Bus 18 (as an example) are shown in Figure 11. As can be seen, usually the tanks are filled in the middle hours of the day when the PV is generating considerable power, and the water is drained from it in the hours when the power or water is needed. Therefore, the PHS is often in the motor mode in the sunny hours, and it is in generator mode when the network needs power or the water level of the tank should be lowered.
In order to understand the water management aspect of the proposed model for the PHSs, the water movement of Pipes 1 and 2 of PHS on Bus 18 (as an example) is presented in Figure 12. In this figure, the positive value indicates the upward flow of the water (motor mode for Pipe 1) and the downward flow of the water from the tank is indicated by negative values (generator mode for Pipe 1). Note that water may go from the tank to the agricultural sector without passing the generator, i.e., through Pipe 2 (see Figure 2). Therefore, it is possible to irrigate the farm without generating power.
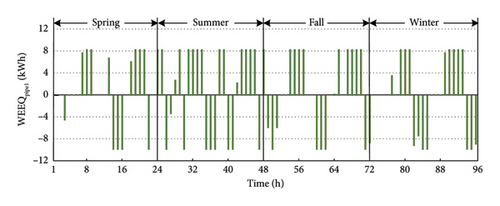

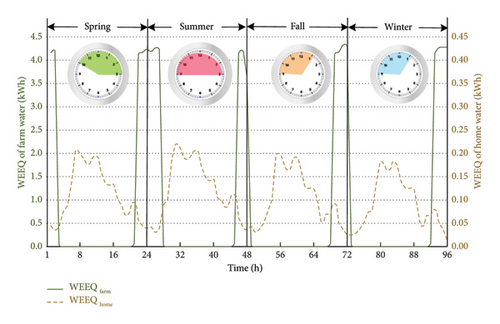
Also, the PHS can be in generator mode with no irrigation. In this case, the water passing the generator (through Pipe 1 in Figure 2) is returned to the underground well. This demonstrates how the proposed new model for the PHS can be used to achieve the electrical and water management purposes independently. Figure 13 shows the WEEQ of the provided respective home and farm water by the installed PHS on Bus 18 (as an example). It can be seen that the specific volume of required water has reached the agricultural sector (farm) at the specified limited irrigation hours. In other words, adding Pipe 2 with only downward water flow has made it possible to provide the agricultural water without any interdependency with the electrical sector. Moreover, the required water for the residential sector (home) is easily provided based on the forecasted profile through the separate designated Pipe 3 (see Figure 2).
4.2.5. Summary of Case Results
Table 6 provides a result summary of the investigated cases using different methods to enhance the HC. It demonstrates that these methods have a positive impact on the HC and purchasing electricity from the upstream network. Using the distributed BESs and PHSs decreases the losses and cost by supplying the required power of each bus at a nearby location, while having a positive effect on the PV HC of the network. On the contrary, centralized BES increases the losses while having a more beneficial impact on HC. It is worth noting that PHS positively affects all three aspects, i.e., HC, total cost, and network losses, while fulfilling its main purpose (water management in agriculture and residential sectors) independently.
| Case | HC or installed PV (MW) | Annual electricity purchasing cost ($) | Annual loss (MWh) | |
|---|---|---|---|---|
| 1. Base (initial) | 3.995 | 3,068,432 | 1456 | |
| 2. BES | Centralized | 4.243 | 2,988,719 | 1504 |
| Distributed | 4.073 | 3,011,883 | 1428 | |
| 3. PHS | 4.065 | 3,020,870 | 1420 | |
4.2.6. Brief Economic and Environmental Analysis
The viewpoint of this paper is that the PHS is an existing infrastructure with the purpose of water management, which can be utilized for the distribution network technical goals such as HC enhancement. Nevertheless, a concise economic and environmental analysis based on yearly (365 days) net present value (NPV) is implemented to further justify the matter. The inputs of Table 7 are assumed for the components, while considering the carbon cost of 100 $/ton with the average emission of 600 g/kWh for the upstream electricity (mainly based on fossil fuels). Also, the inflation rate of 6% per year is assumed and the investment costs are assigned to 1 year based on the capital recovery factor (CRF) considering the component lifetime.
| Component | Installment cost | Lifetime (years) | CRF | O&M cost (per year) | CO2 release (g/kWh) | |
|---|---|---|---|---|---|---|
| PV | 680 ($/kW) | 25 | 0.07823 | 5 ($/kW) | 40 | |
| BES | 480 ($/kWh) | 15 | 0.10296 | 5 ($/kW) | 150 | |
| PHS | Tank and pipes | 300 ($/m3) | 40 | 0.06646 | 0.3 ($/m3) | 10 |
| Generator/motor | 1200 ($/kW) | 15 | 0.10296 | — | ||
The analysis results are summarized in Table 8, where the benefits of various cases are compared to the case where there is no PV and ESS. The results indicate that considering the realistic inputs, the utilization of PV in the network drastically reduces both electricity purchase costs ($1,494,408 on average) and carbon costs ($394,700 on average). This means the investment cost of PV and ESSs ($254,750 on average) is justifiable leading to an average 27.6% benefit compared to Case 0 (traditional network). Comparing the results of various cases also indicates that the added benefit of the increased PV (HC) has justified the investment on both types of the ESSs. Besides, despite differences among ESSs (e.g., more investment costs and less carbon emissions of PHS compared to BES), their provided benefit has remained almost the same.
| Case | Annual electricity purchase cost ($) | Yearly investment cost ($) | Annual carbon cost ($) | Relative benefit to Case 0 | |||||
|---|---|---|---|---|---|---|---|---|---|
| PV | ESS | Upstream electricity | PV | ESS | $ | % | |||
| 0 | No PV and ESS | 4,517,084 | 0 | 0 | 1,279,791 | 0 | 0 | — | — |
| 1 | Only PV | 3,068,432 | 232,486 | 0 | 897,428 | 30,802 | 0 | 1,567,728 | 27.0 |
| 2 | PV + CBES | 2,988,719 | 246,918 | 21,769 | 876,814 | 32,714 | 1224 | 1,628,716 | 28.1 |
| 2 | PV + DBES | 3,011,883 | 237,025 | 21,769 | 882,012 | 31,404 | 1273 | 1,611,510 | 27.8 |
| 3 | PV + PHS | 3,020,870 | 236,559 | 22,475 | 884,208 | 31,342 | 295 | 1,601,126 | 27.6 |
The electricity purchasing cost is decreased in all cases, but concentrated battery with the most HC improvement has the biggest reduction in cost. The decreased electricity cost through PHSs is smaller compared to the distributed BESs, mainly due to their multipurpose nature. Nevertheless, PHSs are cost-effective even considering their nonelectric utilization, i.e., water management. Moreover, despite being a little more expensive compared to BESs (roughly 3%), the PHSs produce way less emission (roughly 200 ton less equivalent CO2 in an average lifetime of 20 years). Of course, other environmental concerns of PHSs, like constructing large reservoirs, requiring underground wells, evaporation losses, and so on, must be taken into consideration. Note that the main benefit of networks with enhanced HC is rooted on the increased utilization of renewable power decreasing the dependency on the upstream electricity, which is both costly and destructive for the environment (based on fossil fuels).
Given the high importance of various parameters on the economic profitability of different cases (role of PV, BES, and PHS) a sensitivity analysis is implemented on the relative benefit (last row of Table 8) of each case compared to the case with no PV and ESS. This analysis is executed by multiplying these important parameters to 0 to 2, where 1 denotes the previously designated realistic values. The results of sensitivity analysis regarding variations of electricity prices, component (PV, BSS, and PHS) investment costs, and carbon costs are shown in Figure 14.
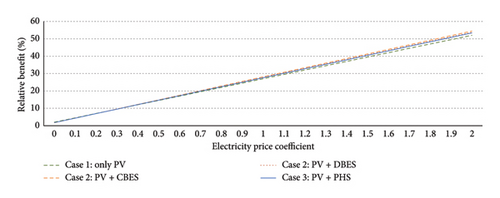
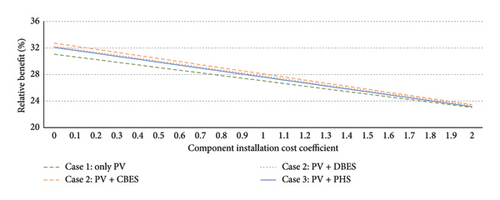
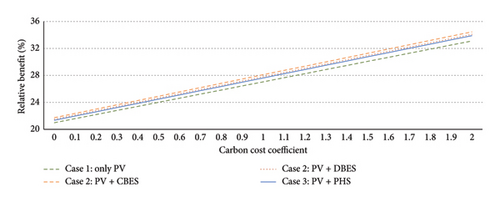
Even with the upstream electricity price of zero, the carbon cost reduction can justify the investment costs leading to a marginal benefit (roughly 4%). Similarly, the relative benefits of all cases are still noticeably large (roughly 21%) even neglecting the carbon costs. Large electricity prices (up to two times larger) due to the volatile nature of markets can increase the benefit from the roughly 27% (for realistic prices) up to roughly 53%. Considering the current decreasing trend for the investment cost of modern components, the relative benefit can be further increased noticeably. Moreover, if the rising issue of deteriorating environmental concerns causes the carbon costs to be increased up to 200 $/kWh, the relative benefit can be increased up to roughly 34%. This sensitivity analysis presents a clear picture of the economic benefits of increasing HC (PV installment) using the ESSs (both BES and PHS), highlighting its robustness against changes of different prices and costs.
4.2.7. Validation of Optimization
As previously presented (see Figure 5 for details), the proposed MINLP optimization model is solved in Steps 3 and 4 of the calculation process, respectively, considering the HC (OF1) and electricity cost (OF2) objectives. All the presented results are calculated based on an appropriate commercial solver, i.e., Knitro. To validate the extracted solutions and further demonstrate the applicability of the proposed formulation, both steps of optimization are solved for various cases, utilizing two other conventional methods. Genetic algorithm (GA) and particle swarm optimization (PSO) are selected as the common metaheuristic algorithms that are both widely available and common generic solvers for various types of problem. Note that the extracted conclusions can be varied for investigations on another distribution network.
The results of this comparison are presented in Table 9. As can be seen, all solvers have reached more or less the same overall results (average difference around 0.14%) indicating the validity of extracted solutions. Knitro has reached the best results handling both objectives in all cases, while being considerably less time-consuming (requiring, respectively, 48% and 57% less computation time for solving the optimization problems of OF1 and OF2). Among the metaheuristic algorithms, PSO has performed relatively better (average difference of 0.10% compared to 0.12% of GA) confronting with the HC problem (OF1), while GA is superior (average difference of 0.15% compared to 0.17% of PSO) in handling the electricity cost objective function. Besides the accuracy, the GA requires less computation time (6% and 14% less for OF1 and OF2, respectively) compared to the PSO.
| Case | OF1: HC (MW) (% of difference) | OF2: electricity cost ($) (% of difference) | ||||
|---|---|---|---|---|---|---|
| Knitro | GA | PSO | Knitro | GA | PSO | |
| Base (initial) | 3.995 (0%) | 3.993 (−0.04%) | 3.994 (−0.03%) | 3,068,432 (0%) | 3,070,868 (+0.08%) | 3,071,485 (+0.10%) |
| Centralized BES | 4.243 (0%) | 4.240 (−0.08%) | 4.238 (−0.10%) | 2,988,719 (0%) | 2,992,574 (+0.13%) | 2,992,886 (+0.14%) |
| Distributed BES | 4.073 (0%) | 4.066 (−0.16%) | 4.068 (−0.13%) | 3,011,883 (0%) | 3,017,625 (+0.19%) | 3,018,236 (+0.21%) |
| PHS | 4.065 (0%) | 4.057 (−0.18%) | 4.060 (−0.15%) | 3,020,870 (0%) | 3,026,895 (+0.20%) | 3,028,115 (+0.24%) |
| Average time (s) | 287 | 580 | 614 | 1325 | 2845 | 3252 |
5. Conclusion
The increasing penetration of RESs into the distribution networks is a growing and inevitable process. Therefore, various methods are essential to facilitate the grid integration of these resources without violating the operational limitations. This paper intends to enhance the distribution network HC through the utilization of an existing potential in the agricultural sector. This goal was pursued by developing the PHS model and its water consumption management cycles in the residential and agricultural sectors. In addition to proposing the extended PHS model and utilizing it for the HC enhancement, BES (centralized and distributed) is also investigated. All of them have enhanced the HC and reduced the cost of purchasing electricity from the upstream network. The PHS and distributed BES have decreased the network losses.
The PHSs were embedded in the network and caused the simultaneous HC enhancement, total cost reduction, network loss, and CO2 emissions decrement. This is done while fulfilling their main purpose, i.e., water management in agriculture and residential sectors, perfectly and independently. Also, a brief analysis shows the relative benefit of around 27% in comparison with the traditional network, while the main advantage pf PHSs is their multipurpose aspect causing them to be more justifiable in comparison with the BESs for the widespread utilization in the distribution network.
Various measures are required to move from research to implementation, such as (1) the regulator support for PHS development in both urban and rural areas, (2) implementing the modification of PHS structural design to maximally separate the water and electricity management, and (3) the utilization of hybrid storage devices like PHS in both planning (e.g., increasing HC) and operation (e.g., reducing costs and losses) of smart distribution networks. Moreover, different improvements can be implemented in future works releasing the limitations of the models in the present paper, such as (1) optimization model simplification (e.g., by decomposition) to ensure the scalability for large-scale networks, (2) extending the model to scenario-based stochastic programming for handling the uncertainties of forecasted parameters (e.g., upstream electricity prices and PV generation), and (3) integrating the improved PHS model into the economic model of PV investors in the agriculture-based regions.
Indices and Sets
-
- IPV/BES/PHS
-
- Set of network buses with possible PV/BES/PHS
-
- i, I
-
- Index and set of network buses
-
- j, Ji
-
- Index and set of buses connected to bus i
-
- t, T
-
- Index and set of study period times (e.g., 96 h)
-
- td, Td
-
- Index and set of study period days (e.g., 4 selected days)
-
-
- Set of hours which are related to the day td
Parameters
-
- βPHS(i)
-
- Coefficient of surface water evaporation of PHS in bus i (0–1)
-
-
- Charge/discharge efficiency of BES in bus i (0–1)
-
-
- Motor/generator efficiency of PHS in bus i (0–1)
-
- ΦPV(i)
-
- The power factor angle of PV in bus i (rad)
-
- Φ(i)
-
- The power factor angle of the load in bus i (rad)
-
- bgrid(i)
-
- The parameter indicating the connection of bus i to the grid (binary)
-
- GFPV(i, t)
-
- Generation factor of PV in bus i and time t (0–1)
-
- HWC(i, t)
-
- The home water consumption coefficient in bus i and time t (0–1)
-
- LC(i, t)
-
- The electric load coefficient in bus i and time t (0–1)
-
-
- The peak load of bus i (MW)
-
-
- Maximum charge/discharge power of BES in bus i (MW)
-
- Pmin/max
-
- Minimum/maximum of interchanged active power with the grid (MW)
-
-
- Maximum motor/generator power of PHS in bus i (MW)
-
- Price(t)
-
- Price of buying electricity from the upstream grid at time t ($/MW)
-
- Qmin/max
-
- Minimum/maximum of interchanged reactive power with the grid (MVar)
-
- Smax(i, j)
-
- The maximum apparent power of the line connecting i and j (MVA).
-
- SOCmin/max(i)
-
- Minimum/maximum allowed state of charge (SOC) of BES (MWh)
-
- Vmin/max
-
- Minimum/maximum permissible value for voltage of network buses (p.u.)
-
- WEEQfarm(i, td)
-
- The total water energy equivalent of the farm in bus i and day td (MWh)
-
-
- The peak water energy equivalent of home in bus i and time t (MWh)
-
-
- Maximum energy equivalent of water passing pipes 1/2 of PHS (MWh)
-
-
- Minimum/maximum water energy equivalent of the PHS tank (MWh)
-
- Z(i, j), θ(i, j)
-
- Impedance magnitude (p.u.) and angle (rad) of the line connecting i and j
Independent (Decision) Variables
-
- ICPV(i)
-
- Installed capacity of PV in bus i (MW) (main decision variables o)
-
-
- Charge/discharge power of BES in bus i and time t (MW)
-
-
- Motor/generator power of PHS in bus i and time t (MW)
-
-
- BES charge/discharge status in bus i and time t (binary)
-
-
- PHS motor/generator status in bus i and time t (binary)
Dependent Variables
-
- Cost(t)
-
- The cost of purchasing electricity from the upstream grid at time t ($)
-
- Loss(t)
-
- Network active power losses at time t (MW)
-
- OF1, OF2
-
- Objectives: (1) hosting capacity (MW), (2) total electricity purchase cost ($)
-
- P/Q(i, j, t)
-
- Active (MW)/reactive (MVar) flows of line connecting buses i and j
-
- PD(i, t)
-
- Active power load in bus i and time t (MW)
-
- PBES/PHS(i, t)
-
- Injection power of BES and PHS in bus i and time t (MW)
-
- P/Qgrid(t)
-
- Active (MW)/reactive (MVar) power taken from the upstream grid
-
- PPV(i, t)
-
- The value of PV generation in bus i and time t (MW)
-
- QD(i, t)
-
- Reactive power load of bus i at time t (MVar)
-
- QPV(i, t)
-
- Reactive power of PV in bus i and time t (MVar)
-
- SOC(i, t)
-
- The state of charge for the BES in bus i and time t (MWh)
-
- V(i, t), σ(i, t)
-
- Magnitude (p.u.) and angle (rad) of voltage for bus i at time t
-
-
- Equivalent energy of farm water (directly/indirectly) in bus i (MWh)
-
- WEEQhome(i, t)
-
- Equivalent energy of consumed water of the home in bus i (MWh)
-
- WEEQpipe1/2(i, t)
-
- Equivalent energy of water in pipes 1/2 of PHS in bus i (MWh)
-
- WEEQtank(i, t)
-
- Equivalent energy of water stored in the PHS tank in bus i (MWh)
Conflicts of Interest
The authors declare no conflicts of interest.
Funding
No funding or support has been received for the research reported in this paper.
Appendix A: Test System Parameters
Detailed parameters of lines (resistance, reactance, and capacity besides the topology) and buses (active and reactive loads) are presented in Table A1.
| Line | From bus | To bus | R (Ω) | X (Ω) | Capacity (MVA) | Bus | PL (kW) | QL (kVAR) |
|---|---|---|---|---|---|---|---|---|
| — | — | — | — | — | — | 1 | Grid | Grid |
| 1 | 1 | 2 | 0.0922 | 0.0470 | 5.0 | 2 | 100 | 60 |
| 2 | 2 | 3 | 0.4930 | 0.2511 | 5.0 | 3 | 90 | 40 |
| 3 | 3 | 4 | 0.3660 | 0.1864 | 5.0 | 4 | 120 | 80 |
| 4 | 4 | 5 | 0.3811 | 0.1941 | 5.0 | 5 | 60 | 30 |
| 5 | 5 | 6 | 0.8190 | 0.7070 | 5.0 | 6 | 60 | 20 |
| 6 | 6 | 7 | 0.1872 | 0.6188 | 5.0 | 7 | 200 | 100 |
| 7 | 7 | 8 | 0.7114 | 0.2351 | 5.0 | 8 | 200 | 100 |
| 8 | 8 | 9 | 1.0300 | 0.7400 | 4.5 | 9 | 60 | 20 |
| 9 | 9 | 10 | 0.0440 | 0.7400 | 4.5 | 10 | 60 | 20 |
| 10 | 10 | 11 | 0.1966 | 0.0650 | 4.5 | 11 | 45 | 30 |
| 11 | 11 | 12 | 0.3744 | 0.1238 | 4.5 | 12 | 60 | 35 |
| 12 | 12 | 13 | 1.4680 | 1.1550 | 4.5 | 13 | 60 | 35 |
| 13 | 13 | 14 | 0.5416 | 0.7129 | 4.5 | 14 | 120 | 80 |
| 14 | 14 | 15 | 0.5910 | 0.5260 | 4.5 | 15 | 60 | 10 |
| 15 | 15 | 16 | 0.7463 | 0.5450 | 4.5 | 16 | 60 | 20 |
| 16 | 16 | 17 | 1.2890 | 1.7210 | 4.5 | 17 | 60 | 20 |
| 17 | 17 | 18 | 0.7320 | 0.5740 | 4.5 | 18 | 90 | 40 |
| 18 | 2 | 19 | 0.1640 | 0.1565 | 4.5 | 19 | 90 | 40 |
| 19 | 19 | 20 | 1.5042 | 1.3554 | 4.5 | 20 | 90 | 40 |
| 20 | 20 | 21 | 0.4095 | 0.4784 | 4.5 | 21 | 90 | 40 |
| 21 | 21 | 22 | 0.7089 | 0.9373 | 4.5 | 22 | 90 | 40 |
| 22 | 3 | 23 | 0.4512 | 0.3083 | 4.5 | 23 | 90 | 50 |
| 23 | 23 | 24 | 0.8980 | 0.7091 | 4.5 | 24 | 420 | 200 |
| 24 | 24 | 25 | 0.8960 | 0.7011 | 4.5 | 25 | 420 | 200 |
| 25 | 6 | 26 | 0.2030 | 0.1034 | 4.5 | 26 | 60 | 25 |
| 26 | 26 | 27 | 0.2842 | 0.1447 | 4.5 | 27 | 60 | 25 |
| 27 | 27 | 28 | 1.0590 | 0.9337 | 4.5 | 28 | 60 | 20 |
| 28 | 28 | 29 | 0.8042 | 0.7006 | 4.5 | 29 | 120 | 70 |
| 29 | 29 | 30 | 0.5075 | 0.2585 | 4.5 | 30 | 200 | 600 |
| 30 | 30 | 31 | 0.9744 | 0.9630 | 4.5 | 31 | 150 | 70 |
| 31 | 31 | 32 | 0.3105 | 0.3619 | 4.5 | 32 | 210 | 100 |
| 32 | 32 | 33 | 0.3410 | 0.5302 | 4.5 | 33 | 60 | 40 |
Appendix B: Various Forecasted Coefficients
Detailed utilized coefficients (forecasted) for PV generation, load, and home water consumption are presented in Table A2. Note that in the HC studies, the planner must have the forecasted values of different parameters before executing the optimization. The methods of extracting such values (e.g., various machine learning approaches) are beyond the scope of present paper and these coefficients are utilized as known inputs of the formulation.
| Component | PV | Load | Home water | |||||||||
|---|---|---|---|---|---|---|---|---|---|---|---|---|
| Season | Spring | Summer | Fall | Winter | Spring | Summer | Fall | Winter | Spring | Summer | Fall | Winter |
| t1 | 0 | 0 | 0 | 0 | 0.45 | 0.55 | 0.40 | 0.35 | 0.018 | 0.018 | 0.020 | 0.010 |
| t2 | 0 | 0 | 0 | 0 | 0.42 | 0.46 | 0.35 | 0.32 | 0.013 | 0.011 | 0.011 | 0.011 |
| t3 | 0 | 0 | 0 | 0 | 0.45 | 0.48 | 0.40 | 0.35 | 0.017 | 0.015 | 0.015 | 0.015 |
| t4 | 0 | 0 | 0 | 0 | 0.50 | 0.52 | 0.42 | 0.39 | 0.030 | 0.036 | 0.02 | 0.020 |
| t5 | 0 | 0 | 0 | 0 | 0.53 | 0.57 | 0.47 | 0.43 | 0.035 | 0.040 | 0.030 | 0.030 |
| t6 | 0.01 | 0.05 | 0.01 | 0.01 | 0.58 | 0.62 | 0.52 | 0.45 | 0.055 | 0.075 | 0.040 | 0.030 |
| t7 | 0.07 | 0.07 | 0.07 | 0.05 | 0.62 | 0.65 | 0.57 | 0.50 | 0.085 | 0.090 | 0.080 | 0.055 |
| t8 | 0.12 | 0.12 | 0.12 | 0.10 | 0.66 | 0.70 | 0.63 | 0.55 | 0.080 | 0.085 | 0.080 | 0.075 |
| t9 | 0.20 | 0.25 | 0.20 | 0.20 | 0.75 | 0.80 | 0.68 | 0.60 | 0.075 | 0.075 | 0.070 | 0.070 |
| t10 | 0.72 | 0.78 | 0.61 | 0.55 | 0.86 | 0.90 | 0.72 | 0.65 | 0.068 | 0.075 | 0.060 | 0.060 |
| t11 | 0.85 | 0.99 | 0.75 | 0.61 | 0.91 | 0.97 | 0.75 | 0.69 | 0.076 | 0.080 | 0.075 | 0.075 |
| t12 | 0.90 | 1 | 0.80 | 0.65 | 0.93 | 1 | 0.73 | 0.68 | 0.085 | 0.090 | 0.080 | 0.070 |
| t13 | 0.85 | 0.97 | 0.75 | 0.60 | 0.93 | 1 | 0.72 | 0.62 | 0.065 | 0.070 | 0.065 | 0.055 |
| t14 | 0.70 | 0.75 | 0.65 | 0.40 | 0.85 | 1 | 0.63 | 0.60 | 0.055 | 0.06 | 0.050 | 0.050 |
| t15 | 0.50 | 0.55 | 0.55 | 0.20 | 0.72 | 0.95 | 0.57 | 0.53 | 0.052 | 0.055 | 0.050 | 0.050 |
| t16 | 0.20 | 0.35 | 0.20 | 0.05 | 0.60 | 0.75 | 0.53 | 0.50 | 0.055 | 0.060 | 0.051 | 0.051 |
| t17 | 0.11 | 0.21 | 0.05 | 0 | 0.60 | 0.68 | 0.53 | 0.50 | 0.041 | 0.041 | 0.038 | 0.03 |
| t18 | 0.05 | 0.10 | 0 | 0 | 0.65 | 0.72 | 0.60 | 0.56 | 0.035 | 0.040 | 0.015 | 0.01 |
| t19 | 0 | 0 | 0 | 0 | 0.80 | 0.85 | 0.74 | 0.68 | 0.025 | 0.030 | 0.030 | 0.028 |
| t20 | 0 | 0 | 0 | 0 | 0.85 | 0.93 | 0.78 | 0.75 | 0.030 | 0.040 | 0.025 | 0.025 |
| t21 | 0 | 0 | 0 | 0 | 0.80 | 0.87 | 0.74 | 0.65 | 0.050 | 0.06 | 0.050 | 0.040 |
| t22 | 0 | 0 | 0 | 0 | 0.68 | 0.72 | 0.65 | 0.60 | 0.022 | 0.025 | 0.020 | 0.020 |
| t23 | 0 | 0 | 0 | 0 | 0.57 | 0.62 | 0.50 | 0.45 | 0.018 | 0.017 | 0.015 | 0.015 |
| t24 | 0 | 0 | 0 | 0 | 0.45 | 0.55 | 0.40 | 0.35 | 0.015 | 0.012 | 0.010 | 0.005 |
Open Research
Data Availability Statement
The research data are included within the paper or properly cited to other references, where needed.


