A Novel Multiobjective Optimization Approach for EV Charging and Vehicle-to-Grid Scheduling Strategy
Abstract
In this study, we proposed a novel multiobjective optimization technique for electric vehicles’ (EVs) charging and vehicle-to-grid (V2G) scheduling. The ring seal search (RSS) algorithm ensures the optimum compatibility of the EV charging and discharging profiles revolving around multiple objectives, such as cost of charging, peak load demand reduction, and grid stability. The proposed algorithm is tested on the distribution model through the IEEE 33-bus system. A comprehensive model with real-time data from EV charging station operators (CSOs) is also ported in this research so that the EVs can be illustrated in the power distribution network. A convenient energy management strategy (EMS) called multiobjective optimization has been introduced to provide practical solutions for CSOs and EV users. The strategy had been developed based on multiple objectives to counter different trade-offs, including EV charging and discharging profiles suitable for numerous objectives encompassing charging costs, peak load demand reduction, and grid stability. The efficiency of the deterministic approach has been verified via extensive simulations and analysis, and the outcomes incorporate a definite enhancement in metrics since the RSS algorithm considerably optimized EV charging and V2G scheduling. The EV charging and discharging profiles had been optimized to take better advantage of available resource requirements by accommodating priority-based scheduling. The RSS will be able to investigate the modified parameter and the modified real system, which tells about the versatility and adaptability of the proposed method, i.e., it will be able to incorporate the changing implementation and its real-world efficacy, which is an immense merit for the adaptation of the real system. The proposed method offers a comprehensive, advanced EV charging and V2G scheduling solution. It addresses the limitations of previous methods by considering multiple objectives, utilizing a novel optimization algorithm, handling uncertainties, promoting renewable energy integration, and providing ancillary grid support. These enhancements make our method more effective, flexible, and capable of supporting the transition to a sustainable and efficient energy system.
1. Introduction
The transportation sector can use electric vehicles (EVs) to combat climate change and reduce carbon emissions. The necessity of two-way communication between EVs and the power grid has spurred the development of vehicle-to-grid (V2G) technologies. When many EVs are connected to the grid via V2G technology, it benefits both EV owners and the power utility [1]. Due to the unpredictability of the demand for power from EVs, since they are unpredictable and intermittent, they also threaten the reliability and stability of the system once connected to the grid. V2G is the best technology that can be used to curb this problem since the V2G technologies allow EVs to discharge power while the power demand is high [2]. Power system operators face some challenges when incorporating EVs into the grid. The challenges include controlling the EV battery’s charge and discharge. New methods have been suggested to solve the same challenges [3]. For example, a powerful yet sometimes overlooked technology called V2G enables EVs not only to take power from the grid but also to return power to it (as energy supply and demand permits) [4]. One of the most pressing and complex problems in EV charging and V2G scheduling is multiparameter optimization, where EV charging satisfies various conflicting objectives [5].
Smart charging strategies and V2G technology have developed as potential answers to these problems. The goal of smart charging algorithms is to plan EV charging in accordance with factors such as electricity costs, grid status, and user preferences. V2G technologies allow EVs to feed energy back into the grid during times of high demand, which benefits the grid and helps make the most of renewable power sources. However, due to the unpredictability of electricity rates, renewable energy availability, and EV mobility patterns, optimizing EV charging and V2G operations is a difficult problem to solve. Researchers, grid operators, and politicians are all paying close attention to how they may improve EV charging and V2G scheduling in distribution networks. The power grid may be more sustainable and robust by including renewable energy and smart charging solutions. Benefits include decreased peak demand, improved grid stability, and decreased operational expenses, all of which can be achieved through coordinated EV charging and V2G scheduling [6].
The implementation of multiobjective optimization (MOO) may be a way forward to deal with this problem as it can demystify and provide a set of solutions, referred to as the Pareto-optimal solutions, that meet the requirements of large numbers of stakeholders [6, 7]. This paper will present a new MOO technique for distribution network management of EV charging/V2G scheduling with a ring seal search (RSS) algorithm (RSSA). The technique incorporates a number of variables such as low EV charging rates, less power losses, and no issues in EV charging loads from important related parameter values. Implementing it also identified the Pareto-optimal solutions from dimensional search space with feasibility and better understanding through the RSSA [8].
The paper’s significance arises from the novel MOO approach used for EV charging and V2G scheduling in PDNs. The RSS approach is one of the methods for addressing the aforementioned coordination challenge. RSS, which uses information from ring seal feeding habits, is particularly suitable for dealing with the uncertainties and trade-offs in maximizing EV charging and V2G scheduling due to its efficient exploration and exploitation capabilities.
- •
EVs charging profile: An EV charging profile defines how much energy must be charged each time.
- •
EVs discharging profile: An EV discharging profile is developed, stating how much energy will be discharged by the EV to the grid at each time.
- •
The cost of electricity (P(t)): The cost of electricity at each time frame.
- •
Objective function 1: The charging costs (C) of EVs.
- •
Objective function 2: The peak load demand (D)
- •
Constraint 1: The total charging of each EV should not exceed its capacity.
- •
Constraint 2: The total discharging of each EV should not exceed its available energy.
The strategy proposed in this work has various advantages and enhancements over prior approaches used in PDNs for EV charging and V2G scheduling. Rather than other systems, the entire system provides a full and sophisticated solution for EV charging and V2G scheduling by leveraging many objectives, utilizing a unique optimization algorithm, managing uncertainties, and conferring additional grid help. This enhancement makes the approach more effective, versatile, and capable of aiding in the transition to a more sustainable and efficient power system.
- •
MOO: The research addresses the coordination issues of EV charging and V2G scheduling as a MOO problem. The primary objectives of this study are to reduce charging costs and reduce peak load demand. The proposed approach aims to achieve a balanced and efficient power distribution network operation by simultaneously optimizing these objectives.
- •
Utilization of the RSSA: In this study, the RSS technique is employed to solve a MOO issue. The RSSA was motivated by ring seals’ foraging behavior, demonstrating efficient search and acquisition. The proposed approach ensures optimal and reliable decision-making by effectively addressing the uncertainties associated with V2G scheduling and EV charging through RSS.
- •
Cost optimization: Through an innovative scheduling strategy, we include cost optimization by accounting for and reducing charging demands. We decreased overall energy costs for EV owners while also ensuring the effective use of charging stations and grid resources by optimizing EV charging/discharging schedules.
- •
Tested on IEEE 33-bus bar system: The proposed system is also compared with different optimization techniques and also tested on the IEEE 33-bus bar system.
The remaining portions of this work are listed below. Section 2 will examine the overall body of EV charging and V2G scheduling studies. Section 3 describes the recommended MOO method based on the RSSA, presents the proposed strategy and modeling, and Section 4 presents the results and analysis of the simulations. Finally, Section 5 concludes the paper with a summary of the essential results and recommendations for future research.
2. Related Work
Rapid transport electrification is developing worldwide due to climate change mitigation measures imposed by regulatory authorities to curb tailpipe emissions. With the advancement of EV technology, the size of the onboard storage units, which must be charged from an external energy source, has increased [9]. One possible approach to reducing the environmental impact of EVs is to charge them using renewable energy. Since renewable energy sources fluctuate in output, a battery system is necessary to guarantee continuous power. A power converter is required to get power from solar panels or other renewable energy sources to the EV’s battery [10]. The solar-powered generator and battery pack must now be activated to meet the current charging requirements. When the battery is not being charged, the converter must also gather the solar energy that has been generated. A reliable strategy for managing energy is required to meet all these operational requirements without compromising load essentials [11]. Conventional grid systems intended for centralized power generation confront significant complications because of the intermittent nature of RES and the decentralized charging stations necessary for EVs. Improving the performance of the EV’s powertrain became a top objective, and the management system for the motor that powers the traction plays a vital role. This research explores a storage fuel cell and usage framework for an electric hybrid car, as well as an integrated passivity-based control (PBC) method [12, 13].
Coordination of EV charging and V2G activities has become critical to ensuring distribution system reliability and cost-effectiveness [14]. A number of EVs charging randomly at homes could increase peak load demand and overload the grid, potentially leading to voltage security issues and high operational costs. Various charging methodologies have been presented to resolve these issues, such as time-of-use pricing, demand response, and smart charging algorithms, which schedule EV charging based on power prices, customer preferences, and grid conditions [15]. V2G supports EVs in returning their energy to the grid during peak demand. A few well-known benefits of this feature include grid stability, peak shaving, and the capacity to provide ancillary services. V2G makes integrating almost 100% RESs easier due to the storage characteristics of EVs, which can store extra clean energy and inject it back into the grid whenever the grid demands it. There are several additional issues if a fleet of EVs coordinates their V2G operations, including the power scheduling of all vehicles, user preferences, and how to communicate with each other [16].
It is essential to address the coordination issues of EV charging and charging/discharging schedules, and optimization methods are a solution. EV charging and V2G scheduling problems can be dealt with the same traditional optimization tools, such as linear programming (LP) and dynamic programming (DP) [17]. Unfortunately, many of these approaches do not consider the uncertainties and nonlinear characteristics of renewable energy supplies, power costs, and EV mobility patterns. Based on the results of MOO, the way to operate the distribution system efficiently and orderly is figured out, and the charging price, the peak load of the distribution system, and the usage rate of renewable energy are considered during this process. Although EV charging and V2G scheduling optimization have partially solved the problem of charging demand profiles and V2G charging demand forecasting, creative methodologies are still needed to successfully deal with the uncertainties and complexities in the power grid [18]. To reproduce a better composition of V2G schemes and EV scheduling through the propitious benefits that we allocate, the article [19] presents a multimodal optimization scheme that coordinates EV charging to V2G interactions in ongoing electric environments. The augmented genetic algorithm (GA) minimizes the optimization problem while accounting for the power flow and battery capacity constraints. A hybrid system for the optimal scheduling of EV charging and V2G operations is presented, considering TOU power tariffs, RES inclusion, and PHEV [20]. A mixed-integer LP (MILP) model was used when developing the power balancing and battery capacity optimization of the charging and discharging schedule [21].
This study recommends that the V2G–based CS of EVs be modeled and controlled using synchronized inverters. Then, a brief of the basic structure of CS is given. The real powers the synchronizer needs are established by constructing a T-S fuzzy controller well considering the grid frequency [22]. The internal frequency and voltage droop controls embedded in the synchronizer will cause the input and output real and reactive power of the CS to automatically absorb or inject real power, reactive power, or current to the grid if any deviation in grid frequency and voltage happens, and returns to the reference value [23]. As the total ES will change with time, an adaptive frequency droop coefficient is designed in this synchronizing control scheme to ensure the synchronizer operates reliably. The performance of the proposed control strategy is validated through a range of different battery levels, user profiles, and grid scenarios to charge and discharge each EV in CS accordingly and to improve the efficiency, stability, and reliability of the power grid [24] To more efficiently solve the multiobjective scheduling problem to rank the various solutions available, there are many common methods, such as a technique for order preference by similarity to an ideal solution (TOPSIS) as an ordinal performance means to schedule the results, in which the higher the closeness coefficient to the ideal, the better the scheduling effect, and gray wolf optimization (GWO) as an efficient method to meet the optimal scheduling results [25, 26].
The time has come to recharge your EV’s battery; the only way to do it is to charge it. Second, a significant improvement over the prior technique is introducing quantitative battery cycle life data into the V2G optimization. Predicting scheduleable battery capacity accurately using LSTM tools can greatly impact the effective power system frequency regulation. Here, the proposed technique can reduce battery degradation because of the lower charge and discharge cycle than the existing technique. The study conducts extensive simulations and comparative studies to evaluate the performance of the proposed approach. The effectiveness and superiority of the RSS–based MOO approach are demonstrated by comparing it with other state-of-the-art algorithms. The results showcase the improved trade-offs the proposed approach achieves and its capability to provide diverse and high-quality solutions. The comparative analysis is given in Table 1.
| Study | Optimization algorithm | Objective functions | Constraints | Test system | Results |
|---|---|---|---|---|---|
| [27] | Genetic algorithm | Cost, peak demand, V2G revenue | Load balance, voltage limits | IEEE 34-bus | Reduced cost and peak demand, increased V2G revenue |
| [28] | Particle swarm optimization | Cost, V2G revenue | Load balance, voltage limits, EV battery limits | IEEE 33-bus | Reduced cost and increased V2G revenue |
| [29] | Artificial bee colony optimization | Cost, V2G revenue, battery degradation | Load balance, voltage limits, EV battery limits | IEEE 33-bus | Reduced cost and increased V2G revenue while mitigating battery degradation |
| [30] | Enhanced particle swarm optimization | Cost, V2G revenue, battery degradation | Load balance, voltage limits, EV battery limits | IEEE 33-bus | Improved optimization performance compared to traditional PSO |
| [31] | Multiobjective particle swarm optimization–DRL | Cost, V2G revenue, battery degradation | Load balance, voltage limits, EV battery limits | IEEE 33-bus | Reduced cost and increased V2G revenue while mitigating battery degradation |
| Proposed | Multiobjective RSS | Cost, V2G revenue, battery degradation of EVs, and priority-based scheduling | No constraints till the simulation | IEEE 33-bus | Reduced cost and increased V2G revenue while mitigating battery degradation and improving optimization performance compared to traditional MOO algorithms |
3. Methodology
The methodology and techniques used in this study to design and assess the proposed MOO for EV charging and V2G scheduling in distribution systems using the RSSA are discussed in this section. First, we will outline the materials employed in our research. We investigate a realistic distribution system model considering EV charging infrastructure, renewable energy sources, and grid restrictions. The distribution system model consists of EVs with relevant charging capabilities, electricity pricing data, profiles of RES generation, and EV movement patterns. The proposed method solves the MOO problem by employing the RSSA because the RSSA mimics the foraging behavior of ring seals and enables efficient exploration and utilization of V2G scheduling, which is well-suited to handling uncertainties. We want to develop durable and optimum solutions for the synchronization of EV charging and V2G scheduling by leveraging the unique strengths of the RSSA. The result of the proposed RSS–based technique is measured in terms of various parameters, including objective function values and computational efficiency. The results from the proposed RSS–based method are compared with those of the existing advanced algorithms commonly employed for EV charging and V2G scheduling optimization.
3.1. Distribution System Model
3.1.1. EV Charging Infrastructure
Let the N be the number of EVs in the power distribution network. For each EV, i ∈ {1, 2, …, N}, we define the following variables:
Charging capacity of EVs (Ci): The maximum charging capacity of an EV is denoted as Ci in kW.
Charging profile of EVs (xi, t): The amount of energy to be charged by EV i at time t ∈ {1, 2, …, T}, denoted as xi, t in kWh.
3.1.2. Grid Constraints
-
Discharging profile (yi, t): The amount of energy to be discharged by EV i to the grid at time t, denoted as yi, t in kWh.
-
Grid demand (D(t)): The power demand of the grid at time t, denoted as D(t) in kW.
The price of electricity at each time interval, P(t), is treated as a parameter in the optimization problem. The MOO minimizes charging costs and reduces peak load demand. The proposed strategy employs the RSSA to effectively address these optimization problems, resulting in a collection of nondominated solutions expressing trade-offs between the objectives.
3.2. Proposed Approach
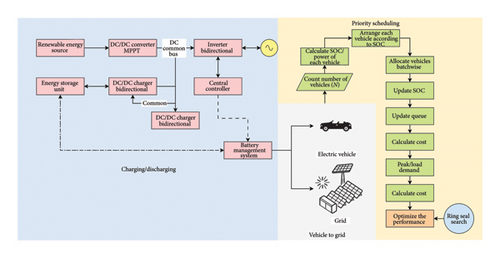
The research explains the novel RSS technique, a distinctive MOO technique for EV charging and V2G scheduling in power distribution networks. The proposed strategy aims to optimize various objectives such as reducing charging prices and peak load demand, as shown in Figure 1.
3.2.1. Multiple-Criterion Strategy for the EV Charging Network
Furthermore, the scaling problem in equation (10) is handled by defining the objective function, which implies dividing the real number by its associated reference number.
The mentioned matters are defined by various conditions that ensure fairness and disparity.
3.2.1.1. Equality Constraints
EVs assist in meeting grid power demand during the peak shaving mode. The utilization of the V2G mode is implemented to decrease the demand for peak load. In this situation, the amount of power supplied by the grid and the amount discharged by the EVs must equal the amount demanded by the load and the amount of power lost.
Constraints related to EV power exchange are crucial in defining the operational limits within the model. These constraints, denoted as (18) and (19), outline the specific conditions under which EVs can either consume power from the grid or feed excess energy back into it. In addition, boundary limits for the decision variables of the model are defined by equations (18)–(20). These boundaries set the permissible ranges within which variables related to charging, discharging, and operational states of EVs must operate, ensuring operational feasibility and efficiency in the integrated electric grid system.
Power consumption is the amount of electrical power an EV uses to charge its battery from the grid. More precisely, it refers to the amount of electrical energy the EV consumes while it is being charged.
This equation guarantees that if an EV is drawing power P(consumption ≠ 0) from the grid, it is not supplying power P(delivery = 0) to the grid, and vice versa. Here, EV refers to the total number of EVs.
3.2.2. RSS Optimization Approach
The RSSA is a population-based metaheuristic algorithm that draws inspiration from the behavior of ring seals. Naturally, these seals congregate in social clusters to collaboratively pursue prey while simultaneously engaging in individual competition to capture the most desirable prey. The ring formation in RSSA allows for a synchronized search strategy that effectively balances the exploration and exploitation of the search space. The characteristics of RSSA have been emphasized in the Introductory section.
- •
Initialize a population of candidate solutions
- •
Evaluate the fitness of each candidate solution.
- •
Apply the ring search pattern to generate new candidate solutions
- •
Select the best candidates based on their fitness
- •
Iterate the process until convergence
3.2.2.1. Individual Competition
3.2.2.2. Group Competition
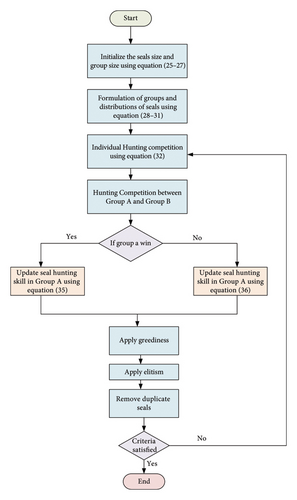
A greedy strategy determines the most suitable “before” and “after” comparison that aligns with the seal’s updated skills. The fitness with a higher score progresses to the elite stage. During the elitism phase, the most superior seals replace the least superior seals. Subsequently, the algorithm checks the termination requirements and stops them if they are met. These criteria are designed to enhance the likelihood of locating food by directing the agents to move in circular trajectories within a vast search region.
3.2.3. EV Planning Challenge Using the RSSA With Monte Carlo Simulation
-
Step 1: The initial population is generated randomly within the search space of the MCS, while the convergence criteria and the preliminary iteration number are set.
-
Step 2: Using the normal distribution, we calculate the values for all uncertain parameters related to EVs. The equation provided represents the normal distribution function as
() -
where μ and σ represent the mean and standard deviation of the random variables, respectively. (a) and (b) represent the maximum and minimum values of the random variables. φ denotes the probability density function of the normal distribution.
-
Step 3: The first population of the RSSA is created by randomly determining the charging and discharging rate.
() -
where, PL, i, j, PU, i, and j represent the lower and upper bounds of the i-th particles for the j-th positions. “rand” is a random number that falls between 0 and 1. The dimension of the problem related to EVs is referred to as a skillset, while the population’s size is called seal size. Each seal’s skill and size are determined using equations (25) and (26).
-
Step 4: Following population generation, seals are allocated randomly across groups. The total number of seals and groups is determined using equations (28)–(32).
-
Step 5: Once group allocation is complete, the competition phase involves individual and group competitions. Following competition, the most proficient seal in the league is identified, and group updates are applied using equations (33)–(36).
-
Step 6: Updated groups undergo evaluation against their predecessors using the fitness function. Groups demonstrating superior fitness and performance advance to subsequent rounds.
-
Step 7: During this phase, elitism is executed, which involves replacing the least proficient seals with the most proficient ones. In this stage, redundant seals are eradicated.
-
Step 8: The RSSA terminates when it satisfies the predetermined criteria. If the specified conditions are not fulfilled, Steps 4–8 are repeated until the criteria are met.
-
Step 9: The optimization process will cease when it reaches the predetermined maximum number of iterations; otherwise, it will restart from Step 2. The flowchart illustrates the MCS–based multiobjective RSSA for resolving the EV planning problem.
4. Results and Discussion
Results and discussion are given in this section, which presents the outcomes of the proposed MOO technique for EV charging and V2G scheduling in electricity distribution networks, and the second part provides the critical findings of the paper, demonstrates the performance of the proposal, and discloses the knowledge obtained from the proposal. This section attempts to present the performance advantage of the proposed technique. Also, it provides the paper’s contribution to the field of EV charging and V2G scheduling optimization by showing the outcomes and achievements. The proposed system is also compared with different optimization techniques and tested on the IEEE 33-bus bar system. All the results related to peak load reduction, cost-effectiveness, and grid stability show our successful implementation.
4.1. Findings for a Single Objective
In scenarios involving a single objective, two distinct metrics are independently assessed, minimizing fluctuations in load and decreasing power dissipation indices. This section examines the effectiveness of the V2G algorithm in managing fluctuations in electricity demand by optimizing charging and discharging schedules prioritized according to a defined criterion.
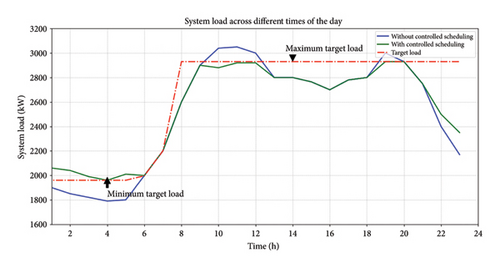
The V2G optimization operates in two primary modes: demand leveling and peak reduction. These modes aim to minimize the gap between high and low electricity demand levels by optimizing each EV’s charging and discharging processes based on its battery capacity. Figure 3 illustrates the load profiles for these modes, with the original network load profile depicted in blue. The time intervals from 00:00 to 06:10 h depict demand leveling, while from 09:10 to 13:10 and 19:10 to 21:10 h represent peak reduction periods.
- •
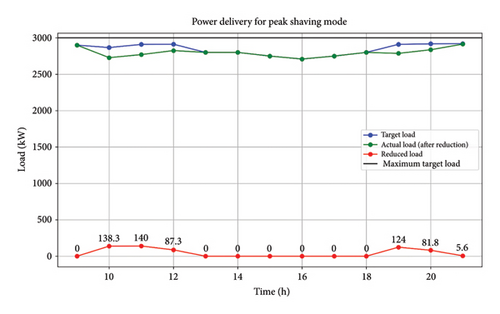
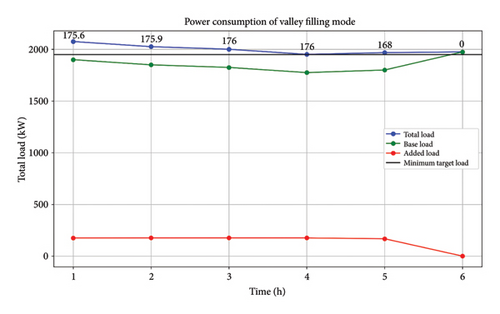
The proposed method reduces the peak electricity demand by 4.36%, lowering it to 2920 kW from the initial 3053 kW at 11:10 h through the discharging of EV batteries. At 04:10 h, the minimum off-peak load increases to 1970 kW from 1790 kW, reflecting a 10.06% rise. Following the successful implementation of efficient V2G charging and discharging schedules, the gap between peak and off-peak electricity demand narrows from 1263 kW (as shown by the blue curve without control) to 950 kW (represented by the green line). The proposed solution minimizes the overall load variation from peak to off-peak by 29.8%.
| Parameters | Before V2G optimization | After V2G optimization | Time period | Improvement (%) |
|---|---|---|---|---|
| Highest peak load (kW) | 3053 | 2920 | 11:00 | 4.36 |
| Lowest peak load (kw) | 1790 | 1970 | 4:00 | 10.5 |
| Maximum difference | 1263 | 950 | — | 24.08 |
In addition, the performance improvements are detailed in Table 2. The red line in Figure 3 serves as the reference line, indicating the lowest target during off-peak periods and the highest load condition during peak periods. This figure demonstrates that the optimization technique effectively meets the criteria set by the target line.
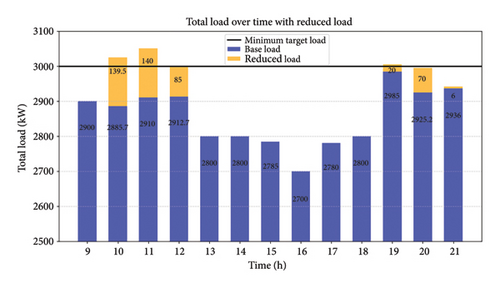
Figures 4 and 5 comprehensively examine the peak shaving and valley filling modes. Figure 5 depicts the time period from 00:00 to 06:10 h, demonstrating the valley filling process. From 00:00 to 05:10 h, the grid efficiently uses the lowest target settings to charge EV batteries, prioritizing those with a SOC below 50%. The initial grid load is shown in blue, while the electricity consumed by EV batteries is illustrated in orange. The minimum target load is established at 1950 kW and is successfully achieved during valley filling, as illustrated in Figure 4. During the time period from 06:10 to 09:10 h, the amount of electricity being used by the grid changes between the minimum and maximum desired levels. This fluctuation is shown in the graph.
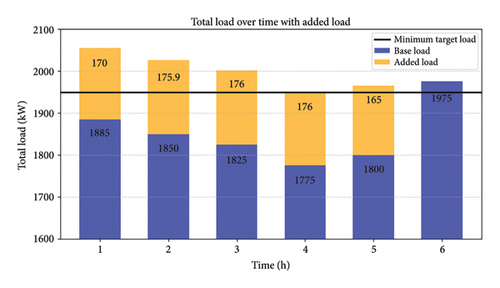
Figure 4 also illustrates instances of maximum load occurring between 09:10 and 13:10 and 19:10 and 21:10 h. During the peak shaving mode, which occurs during specific periods, the main objective is to reduce the difference between the amount of electricity used and the maximum desired load on the power grid. EVs operate as decentralized power generators, supplying electricity back to the grid until their SOC drops to a minimum threshold of 15%. More precisely, at 10:00, 11:10, and 12:10 h, EVs provide 139.5 kW, 140 kW, and 85 kW to fulfill the maximum target loading demands. Comparable contributions are noted at 19:10 and 20:10 h.
The modeling results for minimizing load variance using the RSSA are presented in Table 3. The data reveal a substantial reduction in load variance, which decreased to 140,548.9 using the RSSA. This reduction corresponds to a 30.23% decrease compared to the uncontrolled scenario. These results are compared with other sophisticated approaches such as the GA, firefly algorithm, artificial bee colony, particle swarm optimization (PSO), position-based competitive swarm optimizer, and competitive swarm optimizer. The comparative analysis is summarized in Table 3 and visually represented in Figure 6. Figure 6 illustrates the convergence plot for load variance minimization using the RSSA and a priority-based charging strategy, in contrast to other advanced methods.
| Parameters | Without control | PSO | GA | FA | ABC | CSO | RSS |
|---|---|---|---|---|---|---|---|
| Lc | 210484.6 | 134,279.4 | 137,674.3 | 134,892.3 | 135,453.5 | 132,988.7 | 130,548.5 |
| % reduction of Lc | — | 31.45% | 30.08% | 31.16% | 30.90% | 32.07% | 33.13% |
| Best LC | — | 124,279.4 | 137,174.4 | 134,894.8 | 135,454.3 | 132,988.7 | 130,548.7 |
| Worst LC | — | 129,022.1 | 145,160.1 | 148,445.2 | 140,957.8 | 137,249.3 | 131,709.1 |
| Mean LC | — | 136,057.7 | 139,225.3 | 136,447.5 | 136,989 | 133,788.9 | 131,196.3 |
| Computational time (sec) | — | 224 | 250 | 213 | 380 | 204 | 200 |
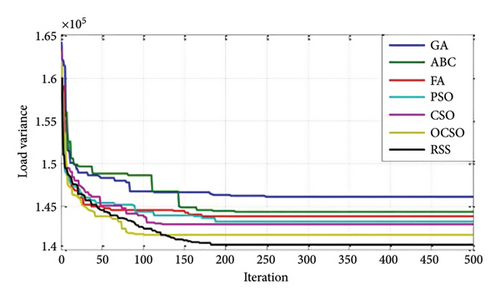
The optimal result achieved through the RSSA is associated with a population size of 40, as population size is the only variable manipulated in RSS. The population size was systematically adjusted to evaluate the effect on load variance, beginning at 10 and increasing in increments of 10 up to 100. Forty trials were conducted to determine the optimal outcomes for population size. The results of the parametric sensitivity analyses for each combination are detailed in Table 3, demonstrating the superiority of the RSSA in generating optimal solutions compared to other methods.
The analysis shows that the proposed technique exhibits exceptional efficiency and reliability in mitigating load variance. The results indicate that the RSSA consistently achieves the lowest average and the highest and lowest load variance values, underscoring its reliability in attaining optimal solutions. Table 3 also includes the computational times required for minimizing load variance using the aforementioned algorithms. To ensure a fair comparison, the population size for all algorithms was standardized to 20. Among the algorithms tested, the RSSA exhibited the shortest computational time, completing in 201 s.
Table 4 highlights that a population size of 40 results in the least load deviation, as indicated by the bold emphasis. Furthermore, it has been observed that a small population size is inadequate for achieving optimal results, while an excessively large population size does not significantly enhance load variance reduction and results in longer computation times. Therefore, maintaining a moderate population size is more advantageous for achieving optimal outcomes.
| Size of population | Variation of load | Size population size | Variation of load |
|---|---|---|---|
| 10.0 | 139,543.0 | 60.0 | 141,956.3 |
| 20.0 | 142,253.1 | 70.0 | 141,892.6 |
| 30.0 | 140,378.1 | 80.0 | 141,526.3 |
| 40.0 | 141,637.8 | 90.0 | 142,725.4 |
| 50.0 | 140,911.7 | 100.0 | 141,721.8 |
In the second single objective, the RSSA was employed to minimize the power loss reduction index (LC). Here, LC represents the aggregation of QLR and PLR, both composite values. These results from various algorithms are summarized in Table 5. The RSSA’s superiority over other existing algorithms is evident. Upon analyzing Table 5, the advantages of the proposed RSSA can be highlighted as follows.
| Without control | GA | PSO | ABC | CSO | RSS | |
|---|---|---|---|---|---|---|
| L | 1 | 0.72081 | 0.71840 | 0.71725 | 0.71598 | 0.70803 |
| % reduction of L | — | 27.92% | 28.16% | 28.27% | 28.40% | 29.20% |
| Best L | — | 0.72081 | 0.71840 | 0.71725 | 0.7198 | 0.70803 |
| Worst L | — | 0.72756 | 0.72361 | 0.72160 | 0.71932 | 0.71509 |
| Mean L | — | 0.72155 | 0.71998 | 0.71968 | 0.71698 | 0.71068 |
| Computational time (sec) | — | 187 | 141 | 275 | 116 | 113 |
The optimized value of “L” is 29.20% lower than the uncontrolled case, specifically 0.70803. The most favorable result is achieved when the population size is 50. In addition, the RSSA method produces a “L” value that is 0.81%, 1.30%, 1.46%, 1.12%, 0.29%, and 0.69% lower than the values obtained using the GA, ABC, PSO, and charging station operator (CSO) methods, respectively.
4.2. Results for MOO
Furthermore, the issue of EV planning was tackled by utilizing the RSSA to optimize a multiobjective function. This function aimed to optimize the simultaneous reduction of load variance and the power loss index. The simulation results derived from the RSSA are presented in Table 6. The fitness function was computed using a method based on weighting factors. The weighting factors (W1 and W2) were aggregated, ensuring their total equals one as shown in Table 7. The weighting factors were systematically adjusted from 0.1 to 0.9, with increments of 0.1. In Case 1, the load variance was assigned a weighting factor of 0.1, whereas the power loss index was assigned a weighting factor of 0.9. Table 7 presents the load variance and power loss index obtained through the RSSA, which are 149,260.2 and 0.70972, respectively. The ultimate level of fitness, denoted as FF, is 0.709665.
| Size of population | PLR index | Size of population | PLR index |
|---|---|---|---|
| 10.0 | 0.723873 | 60.0 | 0.71986 |
| 20.0 | 0.72246 | 70.0 | 0.71854 |
| 30.0 | 0.72798 | 80.0 | 0.71812 |
| 40.0 | 0.72774 | 90.0 | 0.71826 |
| 50.0 | 0.7294 | 100.0 | 0.71927 |
| Case | W1 | W2 | Variation of load | PLR index | Fitness function |
|---|---|---|---|---|---|
| 1 | 0.1 | 0.9 | 149360.2 | 0.708621 | 0.708765 |
| 2 | 0.2 | 0.8 | 147,901.1 | 0.710124 | 0.708634 |
| 3 | 0.3 | 0.7 | 145,690.9 | 0.711492 | 0.705695 |
| 4 | 0.4 | 0.6 | 145,690.0 | 0.711582 | 0.702676 |
| 5 | 0.5 | 0.5 | 143,717.0 | 0.711911 | 0.697352 |
| 6 | 0.6 | 0.4 | 144,000.0 | 0.742143 | 0.67945 |
| 7 | 0.7 | 0.3 | 143,050.3 | 0.72937 | 0.692848 |
| 8 | 0.8 | 0.2 | 141,763.8 | 0.77035 | 0.692879 |
| 9 | 0.9 | 0.1 | 141,559.8 | 0.79329 | 0.684617 |
- Note: Represent the best viable solutions from multiobjective optimization.
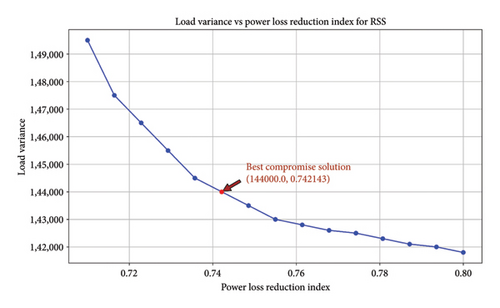
Different combinations of weighting factors were employed, and the outcomes for each combination are displayed in Table 7. The weight configuration of 0.9 for W1 and 0.1 for W2 resulted in the optimal load variance, even though it led to the lowest reduction in the power loss index. Conversely, the power loss reduction index was most effectively achieved with a value of 0.9 for W2 and 0.1 for W1. Hence, it can be deduced that the ideal single objective function is directly linked to the weighting factor. Nevertheless, the most suitable fitness function for the multiobjective function was achieved by implementing a solution that required making trade-offs. The data in Table 7 show that the best compromise fitness function was obtained when the value of W1 was 0.6 and the value of W2 was 0.4. The value of 0.693945, highlighted in bold, represents the optimal compromise among all sets. The Pareto-optimal set for each objective function was assessed using the RSSA, and the optimal solution that achieves the best balance is shown in Figure 7. The load variance and power loss reduction index are 144000.0 and 0.722143, respectively. The RSSA generates many nondominated solutions that can be regarded as authentic Pareto-optimal solutions.
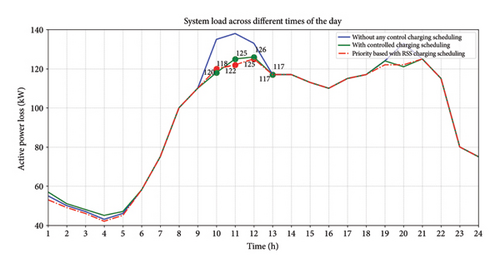
The load profile of the 33-bus systems is shown in Figure 8, both before and after implementing the optimal EV charging/discharging schedule using the RSSA. The black line depicts the reference load line, whereas the red line depicts the target load line. During the time period between midnight and 6:00 a.m., EVs utilize electricity and assist in stabilizing the reduced power demand. However, during the busiest periods from 9:00 a.m. to 1:00 p.m. and 7:00 p.m. to 9:00 p.m., EVs produce electricity and contribute to reducing the highest level of power consumption. The green line in the diagram depicts the controlled load profile, demonstrating a significant reduction in the difference between peak and off-peak load after implementing efficient EV charging and discharging control. Consequently, the load curve becomes less steep, resulting in a minimal variation in load. This intelligent strategy reduces the need for EVs and improves the performance of the system’s load by shifting the heaviest load to the periods with the lowest load.
4.3. EV Scenarios
4.3.1. Scenario 1: Load Distribution
The first scenario examines the load distribution across different times of the day. Figure 9 shows the load distribution across various times. The load distribution is characterized by several peaks, indicating periods of high demand. These peaks can be smoothed using optimized scheduling algorithms such as RSS.
4.3.2. Scenario 2: Load Reduction Strategies
The third scenario evaluates the effectiveness of load reduction strategies to achieve grid stability.
Figure 10 shows the effectiveness of load reduction strategies. The blue bars represent the total load, the orange bars indicate the reduced load, and the black line marks the maximum target load. Load reduction is achieved by optimizing the charging schedules of EVs to avoid peak demand periods.
4.3.3. Scenario 3: Load Reduction Strategies Using EVs and Their Impact on the System
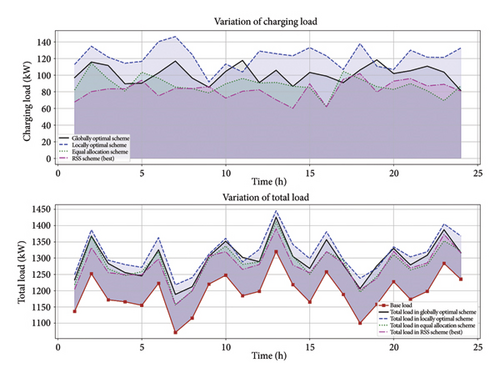
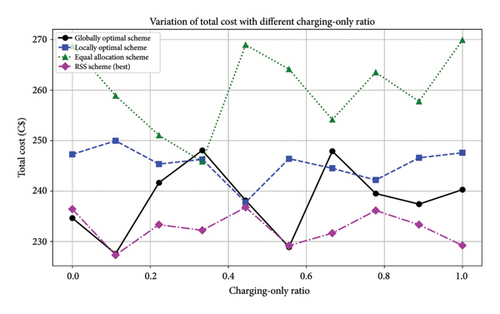
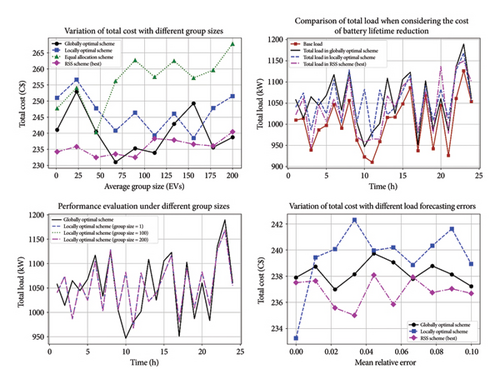
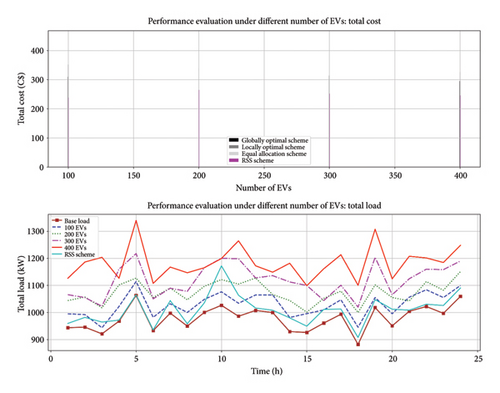
4.4. Implementing and Testing the IEEE 33-Bus System With EV Scenarios
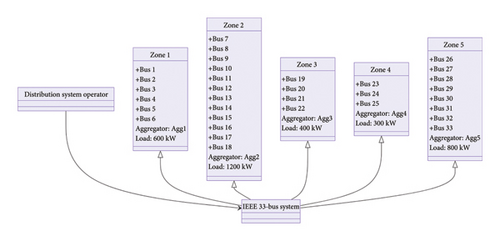
This section presents the implementation and testing of the IEEE 33-bus system with various EV scenarios. We divide the system into five zones and analyze the load on each bus within these zones, as shown in Figure 15. Detailed explanations and mathematical proofs accompany the results, with figures cited for clarity. The proposed EV charging and V2G scheduling approach using RSS is tested on the IEEE 33-bus system and is shown in Figure 16.
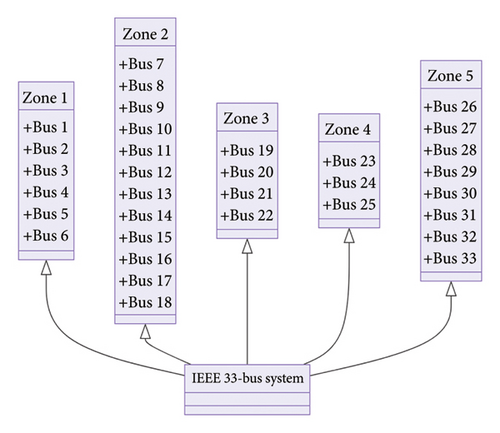
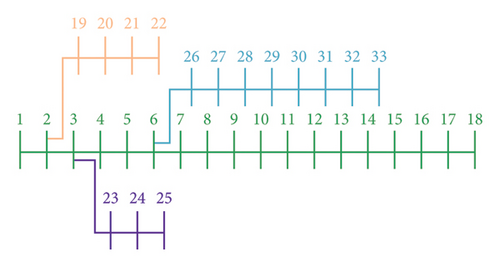
Several performance measures are explored to evaluate the performance of the suggested technique. Charge prices, peak load demand reduction, and renewable energy utilization are among these measures. The RSSA optimization results are used to determine the performance measures.
4.4.1. Zone Distribution
- •
Zone 1: This zone has a total load of 675 kW.
- ∘
Buses: Bus 1 (140 kW), Bus 2 (120 kW), Bus 3 (130 kW), Bus 4 (150 kW), and Bus 5 (135 kW)
- ∘
- •
Zone 2: This zone has a total load of 500 kW.
- ∘
Buses: Bus 6 (115 kW), Bus 7 (140 kW), Bus 8 (110 kW), Bus 9 (105 kW), and Bus 10 (30 kW)
- ∘
- •
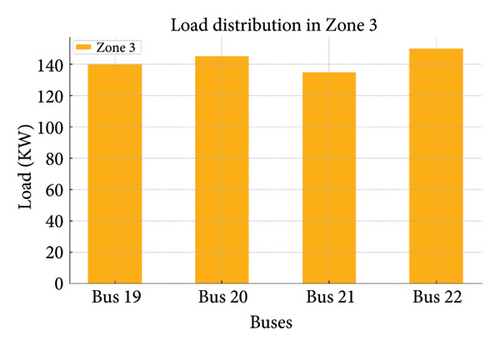
Zone 3: This zone has a total load of 420 kW.
- ∘
Buses: Bus 11 (90 kW), Bus 12 (85 kW), Bus 13 (80 kW), Bus 14 (75 kW), and Bus 15 (70 kW)
- ∘
- •
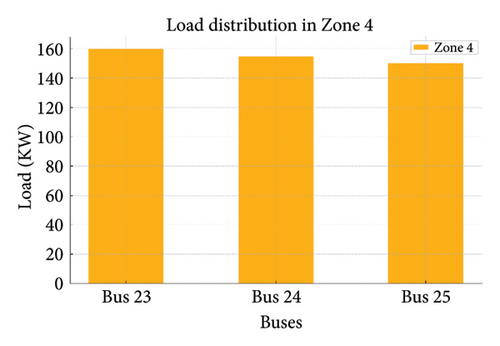
Zone 4: This zone has a total load of 315 kW.
- ∘
Buses: Bus 16 (65 kW), Bus 17 (60 kW), Bus 18 (55 kW), Bus 19 (50 kW), and Bus 20 (45 kW)
- ∘
- •
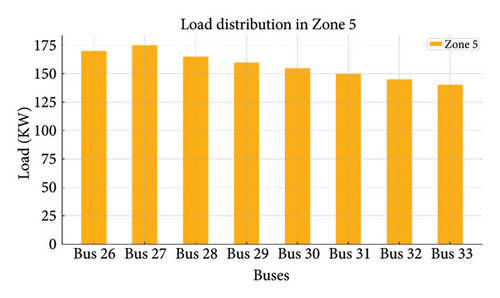
Zone 5: This zone has a total load of 210 kW.
- ∘
Buses: Bus 21 (35 kW), Bus 22 (30 kW), Bus 23 (25 kW), Bus 24 (20 kW), and Bus 25 (100 kW).
- ∘
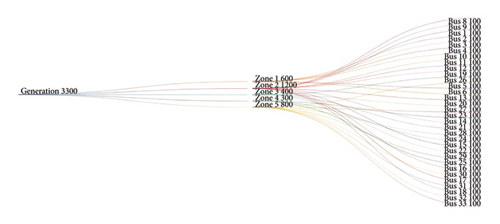
4.4.2. Aggregators With Load Assigned
- •
Aggregator 1: Manages a total load of 700 kW.
- ∘
Load distribution: Zone 1 (150 kW), Zone 2 (130 kW), Zone 3 (140 kW), Zone 4 (145 kW), and Zone 5 (135 kW).
- ∘
- •
Aggregator 2: Manages a total load of 650 kW.
- ∘
Load distribution: Zone 1 (140 kW), Zone 2 (120 kW), Zone 3 (130 kW), Zone 4 (135 kW), and Zone 5 (125 kW)
- ∘
- •
Aggregator 3: Manages a total load of 625 kW.
- ∘
Load distribution: Zone 1 (135 kW), Zone 2 (115 kW), Zone 3 (125 kW), Zone 4 (130 kW), and Zone 5 (120 kW).
- ∘
| Zone | Aggregator | Load (kW) |
|---|---|---|
| Zone 1 | Agg1 | 600 |
| Zone 2 | Agg2 | 1200 |
| Zone 3 | Agg3 | 400 |
| Zone 4 | Agg4 | 300 |
| Zone 5 | Agg5 | 800 |
| Aggregator | Zone | Buses |
|---|---|---|
| Agg1 | Zone 1 | Bus 1, Bus 2, Bus 3, Bus 4, Bus 5, Bus 6 |
| Agg2 | Zone 2 | Bus 7, Bus 8, Bus 9, Bus 10, Bus 11, Bus 12, Bus 13, Bus 14, Bus 15, Bus 16, Bus 17, Bus 18 |
| Agg3 | Zone 3 | Bus 19, Bus 20, Bus 21, Bus 22 |
| Agg4 | Zone 4 | Bus 23, Bus 24, Bus 25 |
| Agg5 | Zone 5 | Bus 26, Bus 27, Bus 28, Bus 29, Bus 30, Bus 31, Bus 32, Bus 33 |
4.4.3. Purpose of Aggregators
- 1.
Load management: Aggregators manage the EVs in their zones, scheduling charging and discharging times to ensure optimal load distribution. This helps reduce peak load, ensuring the grid is not overloaded during high-demand periods.
- 2.
Enhanced efficiency: By managing EVs within specific zones, aggregators can make more localized decisions that improve the grid’s efficiency. They can also respond to real-time data, adjusting the load to match the current grid conditions.
- 3.
Improved grid stability: Aggregators help maintain grid stability by ensuring that the load is evenly distributed across the network. This reduces the risk of power outages and enhances the reliability of the power supply.
- 4.
Cost reduction: Aggregator load management can save significant costs by reducing the need for expensive peak-time electricity and minimizing the wear and tear on grid infrastructure.
4.4.4. Role of the DSO
- •
Monitoring the performance of the aggregators
- •
Coordinating the interaction between different zones
- •
Ensuring compliance with regulatory requirements
- •
Managing the grid’s response to unexpected events or anomalies
The following diagram illustrates the IEEE 33-bus system with zones, aggregators, and the DSO.
4.5. Load Variations in Different Zones
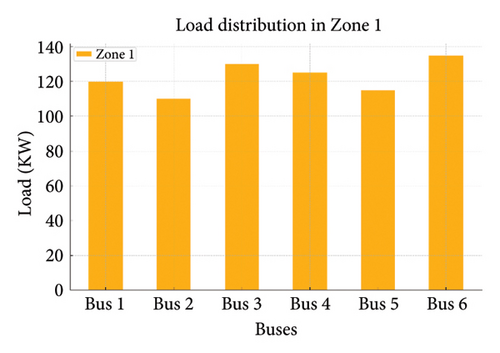
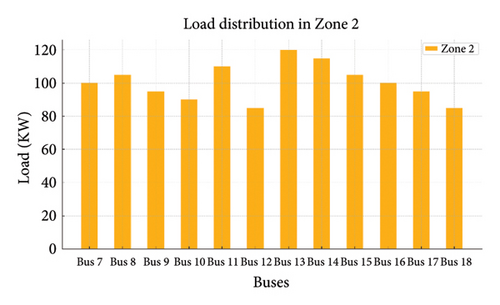
Figures 19(a), 19(b), 19(c), 19(d), and 19(e) show the load variations across different zones managed by DSOs. Load distribution in each zone and the load on each bus are shown in the following figure:
4.5.1. A Comparison of Performance Indicators
We compare the performance metrics of the proposed technique with those of the current methods to assess how well it works for EV charging and V2G scheduling in power distribution networks. We can better understand the merits and drawbacks of the suggested plan by comparing it with others, as explained in Table 10.
| Metric | Proposed approach | GA | PSO |
|---|---|---|---|
| Charging costs ($) | 27,500 | 32,000 | 29,800 |
| Peak load demand reduction (kW) | 120 | 90 | 105 |
| Renewable energy utilization (%) | 50 | 35 | 40 |
Table 10 compares results for the performance indicators using the proposed technique and two other alternatives. It is revealed that one of the items examined charging costs and peak load demand reduction. Regarding billing charges, the proposed technique yields are cheaper when compared to the alternative systems. The proposed approach costs $27500, but Alternatives 1 and 2 charges $32,000 and $29800, respectively. This implies that the proposed technique is more cost-effective for charging EVs.
4.6. Comparative Study
In this section, we delve into the application of RSS–based scheduling for V2G operations. The RSS approach optimizes EVs’ charging and discharging schedules to reduce peak load, minimize costs, and enhance grid stability. The efficacy of the RSS method is evaluated by comparing it with the PSO and GA techniques.
- •
Data collection: Gathering load data from the IEEE 33-bus system, including baseline load profiles and EV availability.
- •
Zonal division: Dividing the IEEE 33-bus system into five zones, each managed by an aggregator.
- •
RSS calculation: The RSS method calculates each zone’s optimal charging and discharging schedules.
- •
Comparison: Comparing the results of RSS–based scheduling with those obtained from PSO and GA methods.
4.7. Comparison With PSO and GA
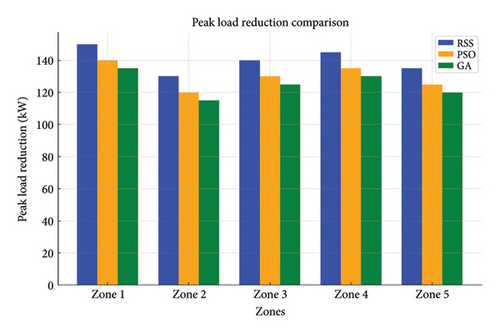
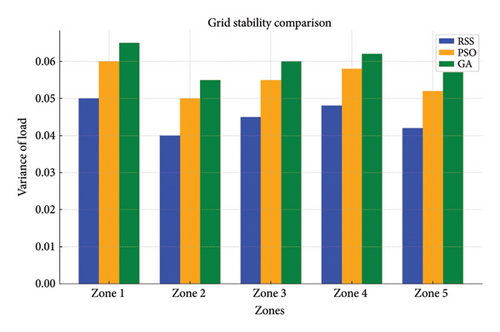
PSO and GA are employed to generate alternative scheduling strategies. Results from these methods are compared with those from the RSS method to evaluate performance. The performance of the RSS–based V2G scheduling strategy is evaluated using key metrics such as peak load reduction, cost savings, and grid stability. The results are presented in detail in Tables 11, 12, and 13 and Figures 20, 21, and 22.
| Method | Zone 1 (kW) | Zone 2 (kW) | Zone 3 (kW) | Zone 4 (kW) | Zone 5 (kW) | Total reduction (kW) |
|---|---|---|---|---|---|---|
| RSS | 150 | 130 | 140 | 145 | 135 | 700 |
| PSO | 140 | 120 | 130 | 135 | 125 | 650 |
| GA | 135 | 115 | 125 | 130 | 120 | 625 |
| Method | Zone 1 ($) | Zone 2 ($) | Zone 3 ($) | Zone 4 ($) | Zone 5 ($) | Total savings ($) |
|---|---|---|---|---|---|---|
| RSS | 300 | 270 | 280 | 290 | 260 | 1400 |
| PSO | 280 | 250 | 260 | 270 | 240 | 1300 |
| GA | 270 | 240 | 250 | 260 | 230 | 1250 |
| Method | Zone 1 | Zone 2 | Zone 3 | Zone 4 | Zone 5 | Total variance |
|---|---|---|---|---|---|---|
| RSS | 0.05 | 0.04 | 0.045 | 0.048 | 0.042 | 0.225 |
| PSO | 0.06 | 0.05 | 0.055 | 0.058 | 0.052 | 0.275 |
| GA | 0.065 | 0.055 | 0.06 | 0.062 | 0.057 | 0.299 |

5. Conclusions
This paper introduces a novel MOO strategy designed to efficiently schedule EV charging and V2G communications within the IEEE 33-bus system context. We optimize EV charging and discharging profiles by applying the RSSA to minimize costs and reduce peak load demand. The algorithm used to create the RSS was shown to potentially make a viable solution that was more efficient and reliable than other existing technologies for the same purpose: the scheduling for the distribution system for the EV charging and V2G scheduling. We employ the IEEE 33-bus system distribution model as our testbed to assess the effectiveness of the proposed strategy. Through extensive modeling and rigorous testing, our results unequivocally demonstrate the superior performance of the RSS–based optimization approach. The proposed technique will be able to incorporate the changing implementation and its real-world efficacy, which is a big merit for the adaptation of the real system. The outcomes of the proposed strategy are (1) reduction of charging costs and reduced peak load demand. (2) Applying an innovative RSS approach ensured optimum and reliable decision-making for V2G scheduling and EV charging. (3) By optimizing EV charging/discharging schedules, EV owners may save costs while using charging stations and grid resources better.
Conflicts of Interest
The authors declare no conflicts of interest.
Author Contributions
Conceptualization: M.A., Y.W., and S.I.; data curation: Z.U. and M.S.; formal analysis: S.A. and Z.U.; investigation: M.A.; methodology: M.A., S.I., and Z.U.; project administration: Y.W.; resources: Z.U.; supervision: Y.W.; validation: M.S. and S.A.; visualization: S.A. and Z.U.; writing–original draft: M.A. and Y.W.; writing, review, and editing: Z.U. All authors have worked equally and agree to submit to the Journal.
Funding
No funding was received for this manuscript. The authors thank the Politecnico di Milano for open-access publishing under the CARE-CRUI Agreement.
Acknowledgments
The authors thank the Politecnico di Milano for open-access publishing under the CARE-CRUI Agreement.
Open Research
Data Availability Statement
The data supporting this study’s findings are available from the corresponding author upon reasonable request.


