

Performance and Energy Analysis of Solar Water Heating Plant in Area of High Solar Radiation: Case of Study in Northern Chile
Abstract
This study focuses on the analysis of the efficiency and the energy performance of a solar water heating (SWH) plant located in the North of Chile, characterized by an instantaneous global solar radiation reaching around 1000 W/m2. The methodology combined experimental measurements in an indirect active solar system with systematic variations in operating parameters, including the evaluation of different flow rates in both the primary and secondary circuits, a comparative analysis of storage system volumes (100 L vs. 200 L) and an assessment of domestic hot water (DHW) consumption management. Precise temperature and flow rate measurements were used to determine performance indicators such as collector efficiency, charging efficiency, and overall plant efficiency. The experimental results reveal that the higher flow rates translate into greater efficiency, reaching a 72% with a flow rate of the 0.63 m3/h compared to the 46% obtained with a flow rate of the 0.35 m3/h. Also, under similar operating conditions, the larger capacity tank (200 L) reaches a lower maximum temperature during the charging (60°C vs. 75°C for the tank of 100 L). However, despite the lower temperature reached, the largest capacity tank (200 L) manages to recover 55% more of DHW. This analysis highlights the importance of considering the efficiency, the storage capacity, and the consumption management to optimize SWH systems in environments with high solar radiation, such as Northern Chile. Furthermore, the exploration of innovative technologies, such as the use of phase change materials (PCM), is suggested to further improve the efficiency of the thermal storage system.
1. Introduction
Worldwide, the energy consumption in the residential sector is distributed in percentage terms according to the final use of energy, that is, the amount of energy consumed to perform various tasks in a home. According to the data analyzed for the year 2021, the hot water represents 16% of the total energy consumed in this sector (Figure 1a) [1]. These values highlight the relevance of the energy used for heating water in homes. In the Chilean context, the residential energy panorama presents particularities. Data from 2018 reveal that 53% of the energy consumed is related to the heating and air conditioning (individual heaters, central heating, and air conditioning), while 20% is allocated to obtaining domestic hot water (DHW; e.g., shower, bathtub, and dishwashing; Figure 1b) [2]. These data establish a framework to understand the importance of the hot water in the residential energy consumption in Chile.


Regarding the source of the energy used to obtain hot water in the Chilean residential sector, it is highlighted that 78.3% comes from liquefied petroleum gas (LPG), followed by 13.8% from natural gas (NG) and a 6.8% from electricity. It is surprising that only 1.2% of the solar energy sources are used for the DHW production [2]. Although the north of Chile has one of the highest solar radiations on the planet (around 1000 W/m2, the maximum global solar radiation reached on the collector tilted equal to the latitude at the University of Antofagasta, Chile). The need to address this imbalance and harnessing the solar potential of Northern Chile motivates the incorporation of solar water heating (SWH) plants in the residential sector. This approach not only seeks to reduce significantly the consumption of the conventional energy, such as gas, electricity, or firewood, but also aims to contribute to the reduction of the CO2 emissions and generate significant savings on the energy bill for homes [3].
In a study carried out in the United States, the thermal performance, the economic feasibility, and the environmental benefits of SWH systems for typical residential buildings were evaluated in three locations: Los Angeles, Atlanta, and Chicago. Systems with solar flat plate collectors (FPCs) and evacuated tube collectors (ETC), along with NG and electric auxiliary heaters were compared. The results revealed solar fractions of 59%, 69% and 76%, and efficiencies of 55%, 54% and 55%, respectively, depending on the local climatic conditions [4]. These findings provide a global context and highlight the need to consider the geographical variability when implementing SWH systems.
To achieve this goal, it is crucial to understand the different configurations of solar systems used in the residential hot water production. Among the most common, there are the systems with natural and forced circulation, known as direct and indirect active systems. Each configuration has its advantages and disadvantages, as highlighted in Table 1 [5–7]. However, the performance or the solar fraction of the use of these SWH systems depends strongly on the climatic conditions of the installation site, that is, its geographical position.
| Configuration type | Design | Advantages of each technology | Disadvantages of each technology |
|---|---|---|---|
| Natural convection |  |
|
|
| Forced convection (active direct system) | 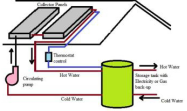 |
|
|
| Forced convection (active indirect system) | 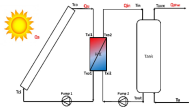 |
|
|
In the natural circulation systems, such as the thermosiphon systems, the convection drives the movement of the heat transfer fluid, being effective if the storage tank is located above the collector in order to establish a difference in the density between the water in the collector and the water in the tank. The difference in density depends on the temperature, and therefore, the operating principle is thermal stratification, also called direct systems. The forced circulation systems use pumps to circulate the heat transfer fluid through the collector, being suitable for the zones with temperate and cold climates [8]. These systems incorporate a heat exchanger, also called indirect systems, where another heat transfer fluid circulates through the collector. To transfer the heat from the collector to the water tank, the heat exchanger can be located inside or outside the hot water tank. In general, the indirect system works better than the direct system, especially in the colder regions, as it is less sensitive to the weather and provides a greater thermal efficiency [9].
Despite the obvious advantages, few studies have been dedicated to investigating the performance of real SWH plants. Table 2 presents a summary of studies worldwide on SWH systems, analyzing the key parameters (collector area, tank volume, and temperature reached) under the different climatic conditions. However, in the Chilean context, according to the data from the Technological Development Corporation [2], the use of the solar energy for the thermal production remains marginal, due to its low use as a source of energy to heat water in the residential sectors.
| Country | Efficiency of the collector and the sensible heat storage systems and performance of the overall system | ||||
|---|---|---|---|---|---|
| Geographic coordinates (location) and solar radiation | System types | Basic information of the system | Findings | Ref. | |
| Ireland (Dublin) |
|
Indirect active system with ETC |
|
|
[11] |
| Ireland (Dublin) |
|
Indirect active system with FPC + electrical auxiliary |
|
|
[12] |
| Canada (Ottawa) |
|
|
|
|
[13] |
|
|
Indirect active system |
|
|
[14] |
|
|
|
|
|
[15] |
| Iran (Shiraz) |
|
|
|
The solar fraction is 19%, 35% and 42%, respectively, for each collector area | [16] |
| Spain (Malaga) |
|
|
|
|
[17] |
| Iraq (Kirkuk) |
|
|
|
|
[18] |
| Maroc (Marrakech) |
|
|
|
|
[19] |
| Pakistan (Taxila) |
|
|
|
|
[20] |
| Albania (Tirana) |
|
Flat-plate vs. heat pipe evacuated tube collectors for solar water heating systems (experimental study) |
|
|
[21] |
|
Direct active system (SWHS and FPC) with electrical or natural gas auxiliary heater |
|
|
[4] | |
This panorama is particularly relevant in the northern zone of Chile, where the use of the thermal energy for the hot water production is the greatest energy consumption in the homes, but the use of solar energy is practically nil and corresponds only to 1.2% at national level. In the climate zone ZT1, where the city of Antofagasta is located, the use of solar systems to heat water is 0.8%. The predominant sources are gas and electricity [2]. Therefore, there is a pressing need to carry out specific studies on the efficiency and performance of the SWH production plants in this region, taking advantage of the favorable climatic conditions. Thus, the aim of this work is to deliver significant practical insights for SWH plant design and optimization and establish a framework for future research in renewable energy.
2. Description and Operational Parameters of SWH Plant
2.1. Location
Given the high solar radiation values and year-round sunlight duration in Northern Chile, it is imperative to exploit the potential solar energy collection for thermal energy production. To harness this potential, a SWH plant with thermal storage has been installed in the Center for Advanced Research in Lithium and Industrial Minerals (CELiMIN) laboratory of the University of Antofagasta (Chile), situated at 23.7004°S latitude, 70.4205°W longitude, and an elevation of 23 m.
2.2. Plant Description
2.2.1. Components of the Plant
The plant operates as an indirect active system, comprising two solar collectors, each with a collection area of 1.782 m2; two storage tanks, each with a capacity of 100 L; a plate heat exchanger, and two recirculation pumps in the primary (solar) and secondary circuits (Table 3 and Figures 2 and 3). The heat exchanger is made of stainless-steel material (AISI316). The tank is made of stainless steel 316 material, with 5 mm of thickness, and 5 cm of glass wool of insulation. Two types of pipes are used for the system. The primary circuit is made of copper pipe and the secondary and discharge circuits are made of PP-R pipe. All pipes are 3/4 inch in diameter, with a thickness of 2.5 mm and 2 cm of the rubber-based elastomeric foam material as insulation material.


| Technical characteristics of the components | ||
|---|---|---|
| Flat solar collector | Total area (m2) | 3.564 |
| Heat exchanger | Power (kW) | 13 |
| Plate numbers | 33 | |
| Recirculation pumps |
|
|
|
|
|
| Tank (each one) | Diameter, D (m) | 0.345 |
| Height, H (m) | 1.08 | |
In the plant, a digital solar controller ELIOS 25 is configured to activate the pumps automatically when the temperature difference between the collector outlet and the bottom of the storage tank exceeds 5°C (Figure 3d). The pump turns off when the temperature difference reaches 5°C, standard values in solar thermal systems to prevent operation during periods of low insolation solar radiation and minimize pump cycle frequency [22].
As shown in Figure 4, the tank is divided into six sections (y1, y2, y3, y4, y5, and y6), where temperature measurements using six PT100 thermocouples were taken to determine the defined variables.

Various measuring instruments are used to record and monitoring the plant operation. The pressure and temperature 12 channels Data Logger from ShengRuike Automation Equipment Co. (Figure 3a) was used to measure the fluid temperatures at the inlet and outlet of each element of the plant (in Celsius degrees). Both water and air temperature measurements were conducted via PT-100 thermocouples with ±0.15% accuracy. The B Meter-Hydrocal M3 instrument with accuracy ±2% accuracy (Figure 3b) allows to read the fluid flow rate in both circuits. It also allows calculating the amount of heat and hot water recovered from the storage tanks. The pyranometer, PCE-SPM1 Datalogging Solar Power Meter, with ±1% accuracy, is the instrument that allows to measure solar radiation (Figure 3c). The flow rates are adjusted by the pumps. The percentage uncertainty of measuring parameters is listed in Table 4.
| Parameters | Uncertainty (ω) |
|---|---|
| Water temperature (°C) | ±0.15% |
| Water flow rate (m3/h) | ±2% |
| Air temperature (°C) | ±0.15% |
| Solar radiation (W/m2) | ±1% |
| Uncertainty percentage of overall efficiency (%) | ±2.93% |
The calculation by Equation (1) results in a 2.93% uncertainty percentage of the overall system efficiency.
2.2.2. Input Operational Variables
2.2.2.1. Influence of the Flow Rate in the Primary and Secondary Circuit
In this section, the influence of the circulation flows in the primary (C1) and secondary (C2) circuits in the plant are analyzed. The flow rates in the pumps are set, the temperatures at the inlet and outlet of each component of the plant are recorded and the thermal energy flows in each circuit are calculated to determine the efficiency of the solar collector and the plant.
- •
The average temperature difference between the inlet and outlet of the collector (ΔTc).
- •
The temperatures at the outlet of the collector and at the top of the tank (Tco and TC1).
- •
The efficiencies of the collector, the plant, and the charging system (nc, nplant, and nch).
- •
The overall heat transfer coefficient in the heat exchanger (Uhx).
| Flow rates | C1 (m3/h) | C2 (m3/h) |
|---|---|---|
| Scenario 1 | 0.88 | 0.35 |
| Scenario 2 | 0.50 | 0.35 |
| Scenario 3 | 0.88 | 0.63 |
| Scenario 4 | 0.50 | 0.63 |
2.2.2.2. Influence of the Thermal Energy Storage Capacity
In this section, a comparison is made between the volumes of the storage tanks, keeping the other elements of the plant constant, including the collector area, and the similar climatic conditions. The performance of the plant with storage capacities of 200 and 100 L is examined, as illustrated in Figure 5. The flow rates used are 0.88 m3/h for the primary circuit and 0.63 m3/h for the secondary circuit. This analysis provides a fundamental understanding of the sensible heat storage and the system sizing principle, which it depends on the thermal energy stored in the tank and the solar radiation received.


The amount of thermal energy stored/dispatched is affected by three fundamental parameters: the volume, the amount of material, and the maximum temperature reached in the storage tank. Therefore, it is essential to carefully observe the behavior of the storage system, both in charging and in discharging, in order to understand which element most affects the overall performance of the system.
2.2.3. Performance Indicators
The performance of the installed SWH plant is evaluated by utilizing the following indicators:
2.2.3.1. Collector Efficiency
2.2.3.2. Efficiency of the Plant
Tin is the inlet temperature to the tank from the heat exchanger and represents the charge temperature, while Tout is the outlet temperature from the tank to the heat exchanger and represents the return temperature. C2 and Cdhw are the flows of the secondary circuit and the DHW, respectively. Tdhw and Ta are the temperatures of the DHW and the cold-water temperature of the city entering the system, respectively.
2.2.3.3. Efficiency of the Tank Charging
2.2.3.4. The Overall Heat Transfer Coefficient in the Heat Exchanger (Uhx)
2.2.4. Water Consumption Management
The management of the hot water consumption produced by the plant for a single-family home involves the profile of the water use, that is, how the users use the DHW throughout the day. For this study, we adopted the Chilean model on the daily hot water use (Figure 6) [29], which consists of the discharge (consumption) of 30% of water in the morning, 25% during the day, and 45% during the afternoon and night. In this experiment, we applied this consumption management model, so that 30% of the hot water remains available for the morning of the next day.

The parameters considered for the plant are the following: one storage tank of 100 L, the flow rates of the primary and secondary circuits C1 and C2 are 0.88 and 0.63 m3/h, respectively; the consumption flow (Cuse) is 0.37 m3/h. Four discharges were carried out depending on the percentages of DHW consumption according to the time slots of the day (Table 6). The discharge time is 10 min in the morning, 8.3 min during the day, 15 min at night, and 10 additional minutes in the fourth discharge, corresponding to the consumption in the morning of the next day. Figure 7 establishes the way in which the discharge was carried out in the system, where the temperature and the flow rate of the DHW (Tdhw and Cdhw, respectively) vary as the discharge progresses.

| Time slots of the day | In the morning (7–9 h) (30%) | During the day (11–12 h) (25%) | In the evening (19–21 h) (45%) | In the morning the next day (30%) |
|---|---|---|---|---|
| Discharging time (min) | 10 | 8.33 | 15 | 10 |
3. Results and Discussion
The key performance parameters, such as the collector and the plant efficiency, the solar fraction, the charging time, the consumption profile, the heat transfer coefficient of the heat exchanger, and energy storage/retrieval rates, have been measured and analyzed. The results obtained from this experimental study provide valuable insights into the thermal behaviors, the energy storage capacity, and the overall performance of the solar DHW plant with a sensible heat storage system.
3.1. Influence of the Flow Rate on the Operating Parameters
In this section, the results of the tests carried out to evaluate the impact of variations in the flow rates in the primary circuit (solar circuit) are presented. The storage capacity used for the analysis in the system is one 100 L tank.
In Figure 8, the influence of the flow change in the primary circuit (C1) is presented. It is observed, in both cases, that the temperature in the tank reaches practically the same level (79°C). However, a longer operation time of the pumps is recorded for the lowest flow rate in the solar circuit, that is, 30 min more operation time, which implies a greater consumption of electrical energy for the lowest flow rate. The pump operating time range in this scenario is from 9:00 to 16:40 for the highest flow rate and from 9:00 to 17:10 for the lowest flow rate, during the day. Furthermore, it is observed that the efficiency of the collector is similar for both flow rates (nc = 64%). Although there is a larger temperature difference for the lowest flow rate (ΔTc = 2.3°C) compared to 1.54°C for the highest flow rate C1. The heat transfer coefficient of the heat exchanger and the plant efficiency are higher for the larger flow rate (nplant = 46%) compared to 41% for the lowest flow rate.


In Figure 9, similarly to Figure 8, the system reaches practically the same temperature level in the tank in both cases. A longer operation time of the pumps is recorded for the lowest flow rate in the solar circuit, that is, 20 min more operation time for lower C1, which implies a greater consumption of electrical energy. The pump operating time range in this scenario is from 9:30 to 14:40 for the highest flow rate and from 9:00 to 14:30 for the lowest flow rate, during the day. Furthermore, it is observed that the efficiency of the collector is almost the same for both flow rates (nc = 67%), although there is a greater temperature difference for the lowest flow rate in the solar circuit, ΔTc = 2.3°C for lower in C1 compared to 1.54°C for higher C1.


Shorter charging time is observed for higher flow rates (0.88–0.63 m3/h) in both circuits and longer charging time for lower flow rates (0.50–0.35 m3/h).
3.1.1. Efficiency of the Collector and the Plant
From the experimental results, it can be established that the change in the flow rate of the secondary circuit has a significant impact on the performance of both the collector and the plant. A higher flow rate in the C2 leads to an improvement in the efficiency, with increases of 3% for the solar collector and 27% for the plant, compared to the lowest C2 (Figure 10). Furthermore, it is observed that, in the face of changes in the flow rate of the secondary circuit, a shorter operating time is achieved with the larger flow rate (~155 min less), implying a lower electrical energy consumption of the pumps. In summary, a greater flow in the secondary circuit allows a faster charging of the system, resulting an improved overall performance.

In Figure 10, the efficiencies of the solar collector (ηc) and the plant (ηplant) are represented as a function of changes in the flow rates. As observed in the use of the higher flow rates in the circuits, better performance is obtained, especially with the C2 flow rate of the secondary circuit, which is directly related to the storage tank.
A summary of the findings on the changes in the flow rates in the plant circuits is presented in the Table 7.
| Flow rates (m3/h) | C1 | 0.88 | 0.50 | 0.88 | 0.50 |
|---|---|---|---|---|---|
| C2 | 0.35 | 0.35 | 0.63 | 0.63 | |
| Operation time (min) | 450 | 480 | 300 | 320 | |
| Consumption of the pumps (kWh) | 18 | 23 | 9 | 10 | |
| Consumption of the pumps (MJ) | 64.8 | 82.8 | 32.4 | 36 | |
| ΔTc (°C) | 1.54 | 2.3 | 1.57 | 2.47 | |
| Qu (kW) | 72.21 | 64.90 | 49.67 | 45.63 | |
| ηc (%) | 64 | 64 | 67 | 67 | |
| ΔThx2 (°C) | 5.3 | 5.08 | 3.96 | 3.87 | |
| Qin (kW) | 99.40 | 101.39 | 90.03 | 90.85 | |
| Uhx (W/m2 °C) | 341.5 | 335.5 | 453.4 | 454.3 | |
| Qstored (J) | 25.63 | 25.14 | 25.22 | 24.73 | |
| Qcharging (MJ) | 59.64 | 60.83 | 54.01 | 54.51 | |
| ηplant (%) | 46 | 41 | 72 | 69 | |
| ηcharging (%) | 43 | 41.3 | 46.7 | 45.3 |
As observed in the Table 7, another important finding has been obtained in the solar circuit. The temperature difference in the collector (ΔTc) is greater for the lowest flow rate, although this difference is not enough to improve the efficiency of the collector and the plant. However, for the higher flow rate in the secondary circuit, the plant charges faster, shows a better heat transfer coefficient in the heat exchange and, ultimately, a better overall plant performance. Consequently, a higher flow rate in both circuits is emerging as the optimal option for an indirect active DHW system, always respecting the pump flow rate limit speed recommended by the manufacturer.
In a similar study, Arsalan et al. [20] carried out a comparative study on a solar space heating system, evaluating three different mass flows in the solar circuit (primary circuit), with values of 0.1066, 0.0716, and 0.0538 kg/s and using a total collecting area of 7.37 m2 (FPC) with a water tank volume of 300 L. For the flow rate of 0.1066 kg/s, the maximum and minimum temperature differences achieved by the FPC are 5.7 and 1.93°C, respectively. For the flow rate of 0.0716 kg/s, the maximum and minimum values of the temperature difference are 8 and 1.93°C and for the flow rate of 0.0538 kg/s, the maximum and minimum temperature difference are 9.8 and 2.93°C. However, the maximum efficiencies achieved by the FPC for the flow rates of 0.1066, 0.0716, and 0.0538 kg/s are 51.6%, 45% and 38%, respectively.
Furthermore, the reduction in flow rate also affected the temperature difference, heat gain, and the efficiency. Similarly, the energy efficiency achieved by the solar collector is also influenced by the intensity of solar radiation. The comparative analysis results indicate that the temperature difference increases with a reduction in flow rate, while the thermal efficiency decreases with the lower mass flow rates. The solar collector shows better efficiency at higher flow rates compared to lower flow rates. Therefore, increasing the flow rate has a positive effect on the thermal efficiency of the collectors [20].
3.2. Thermal Storage Capacity Comparison
This section delves into the comparison of thermal storage between two systems. The first one, with 100 L storage capacity (one tank), and the second, with 200 L (considering two tanks with 100 L each one) capacity, highlighting the influence of the tank size on the overall performance.
Figure 11 shows a comparison between the two systems in terms of the temperature reached in the tank during the charging and storage process. The amount of energy stored in the tank is directly related to the area of the solar collector, which implies that the maximum temperature of the tank is influenced by its volume. While the storage system of 100 L achieves a maximum temperature of 75°C (Figure 11a, TC1 plot line), the 200 L storage system achieves a maximum temperature of 60°C (Figure 11b, TC1 and TL1 plot lines). Furthermore, it is observed that the smaller storage capacity experiences a faster heat loss, indicating a greater consistency in the thermal energy storage in the larger capacity system.


Figure 12 presents the thermal behavior of the systems during the hot water recovery process. As can be seen, the system with the smallest capacity reaches the highest temperature, but recovers the least amount of the DHW. On the other hand, the system with a larger capacity reaches a lower temperature but achieves the greater DHW recovery. In this way, it is concluded that the size or volume of the tank has a significant impact on the recovery of the DHW (Figure 13).


Table 8 provides a comparative summary between the 100 and 200 L storage system under the similar climatic conditions. The experimental results indicate that the storage capacity is directly related to the area of the solar collector (sizing principle). For the same collector area, the system with a larger volume (200 L) reaches a lower maximum temperature (60°C), has a lower heat loss rate, and achieves the greater DHW recovery.
| Storage volume | 100 L | 200 L |
|---|---|---|
| Qu (MJ) | 49.74 | 43 |
| nc (%) | 66.27 | 71 |
| Tmax (°C) reached | 75 | 60 |
| Heat loss rate from 17:00 to 5:00 (°C/min) | 3.26 × 10⁻² | 1.20 × 10⁻² |
| Qcharging (MJ) released | 62.03 | 67.84 |
| Qstored (MJ) | 24.21 | 34.63 |
| ncharging (%) | 39 | 51.05 |
| Operation time (min) | 360 | 460 |
| Ep (kWh) consumed | 8 | 6 |
| VDHW (L) recovered | 267 | 415 |
| QDHW (MJ) recovered | 41.82 | 50.90 |
In this context, the performance of the plant has been analyzed, highlighting that a greater fluid flow rate in the solar circuit translates into a better performance (46% vs. 41%). In the secondary circuit, the higher flow rate charges the plant more quickly, obtaining a better performance (72% vs. 46%) than the lower flow rate. Furthermore, the two different volumes of the accumulator (100 vs. 200 L) have been compared. The system with the smallest storage capacity reaches a higher maximum temperature (75°C), while the system with the largest storage volume reaches a lower maximum temperature (60°C). Despite the lower temperature reached, 55% more DHW was recovered with the system with the largest storage capacity. Next, we proceed to analyze the management of the consumption of the hot water recovered from the plant.
In a related study, Comakli et al. [14] investigated the optimal collector and storage tank sizes to design the more economical and efficient SWH systems. A program was developed and validated with 1 year of experimental and environmental data for Erzurum, Turkey. The results indicated that when the volume of the storage tank increases, the efficiency of the collector also increases. Figure 14a shows that the collector efficiency is maximized when the tank volume/collector area ratio is 200 L/m2 and the efficiency is minimized when that ratio is 25 L/m2. Figure 14b shows that the temperature of the storage tank decreases as the tank volume increases. When the tank-volume ratio has the lowest value of 25 L/m2, the annual value of the tank temperature is the highest [14].


Given the reasons previously stated, it is essential to establish the optimal collector area based on the tank volume for the design of the solar heating systems more effective, beneficial, and profitable. It is important to keep in mind that the determination of the tank volume is carried out according to the daily demand of the DHW in residential environments.
3.3. Water Consumption Management Study
The behavior of the users in the use of the DHW has a significant influence on the energy consumption of the DHW systems. Likewise, the performance of these systems also impacts the user behavior [30]. In Figure 15, the water temperature profiles in the tank are presented according to the daily DHW consumption, detailed in Section 2.2.4.

The user profile varies depending on the region of the world. In Figure 15 and Table 9, four discharges of DHW are shown, based on the usage profile in Chile. It is observed that the nights and the mornings are the critical times, and the users must control to avoid the heat losses that affect the storage temperature, as can be seen in the two morning discharges. The DHW temperature in the tank must be maintained above 37.5°C to ensure the user comfort. The fourth discharge is not effective due to the heat loss observed in the tank during the night (between 8:00 p.m. and 8:00 a.m.). The next morning, the DHW already reached a temperature of 37°C, which cannot provide hot water for a bath. This could be due to the efficiency of the tank and the pipe insulation.
| Parameters | 1st discharge | 2nd discharge | 3rd discharge | 4th discharge |
|---|---|---|---|---|
| Discharge time (min) | 9 | 10 | 20 | 2 |
| TDHW (°C) initialc | 42.6 | 43.7 | 66.2 | 37.1 |
| DHW recovered (L)a | 36.6 | 46.1 | 29.3 | 12 |
| Vuse (L)b | 55.5 | 61.6 | 123.3 | 12.3 |
- aDHW recovered from the storage system.
- bVolume of consumption water available at 37.5°C.
- cDHW temperature in the tank.
In a similar analysis, Baneshi and Bahreini [16] examined a hybrid system of a SWH with an auxiliary heat source for residential homes, considering three different profiles of the daily DHW consumption. They discovered that the solar fraction changes with the DHW consumption profile. To supply DHW consumption in the system with a total collector area of 10 m2 and a tank of 500 L, the solar fraction can reach 52.8%, 49.8%, and 55% with Profiles 1, 2, and 3, respectively. They also observed that the solar fraction varies for the supply of the DHW and the heating simultaneously. With a total collector area of 40 m2, the maximum solar fraction and the optimal storage tank volume were 45.8% and 2900 L in Profile 1, 45.7% and 3000 L in Profile 2, and 45.9% and 2800 L in Profile 3. This indicates that the way the DHW is consumed influences the system [16].
Bouhal et al. [19] analyzed five types of different DHW consumption profiles in a SWH system in Morocco (Marrakech). In the same place and climatic conditions, they observed that the solar fractions for the flat plate collector varied minimally according to the profiles, ranging between 42% and 98%, depending on the solar radiation (DTIE profile: 42%–98%, day profile: 42%–98%, EUROPEAN profile: 41%–95%, morning profile: 42%–96%, and afternoon profile: 42%–97%) [19].
In our study, according to the experimental analyses, it is observed that the efficiency can be affected by the insulation of the storage tank. The management of the DHW consumption between the night and the morning is crucial, then, according to the DHW consumption profile in Chile, the maximum demand occurs at night. Therefore, a poor DHW management at night will affect the availability of DHW in the morning of the next day. It is essential to consider the system is not only for heating the solar water but also for storing heat in the tank and that this helps to manage the heat according to the DHW consumption profile.
Table 10 presents the comparative summary of our plant and previous studies, considering the maximum values reached during the maximum solar radiation recorded in each work. When analyzing the works, the determining influence of the fundamental parameters is evident, such as the solar radiation, the collector area and the volume of the tank.
| Location | Rmax (W/m2) | Configuration (system type) | Ac (m2) | Vtank (L) | Tmax (°C) | DHW recovered (L) | Vusea (L) | Observation | Ref. |
|---|---|---|---|---|---|---|---|---|---|
| Antofagasta (Chile) | 1018 | Indirect active system with FPC | 3.564 | 100 | 75 | 267 | 444 |
|
Our work |
| 200 | 60 | 415 | 601 |
|
|||||
| Dublin (Ireland) | 961.8 | Indirect active system with FPC + electrical auxiliar | 4 | 300 | 59 | -- | -- |
|
[12] |
| Ottawa (Canada) | 920 | Indirect active system with FPC + gas fired auxiliar | 5.716 | 272 | 59.6 | -- | -- |
|
[13] |
- aComfort water available at 37.5°C.
In particular, the Dublin (Ireland) system with a volume of 300 L reaches a maximum temperature comparable to our 200 L system. The difference lies in the collector area, significantly larger than the Dublin system, which highlights its crucial influence in the thermal performance. Similarly, the Ottawa (Canada) system, despite having a larger volume tank (272 L), should reach a lower maximum temperature due to its larger collector area (5.716 m2), although in practice it reaches practically the same maximum temperature (60°C).
The levels of the solar radiation directly affect the efficiency of the collector and, therefore, in the system as a whole. The high solar radiation present demonstrates the capacity of the system to generate a considerable amount of heat. It is observed that even a tank of 100 L can supply hot water for more than four people in a day, providing 267 L of the DHW, equivalent to 444 L of the comfort hot water at 37.5°C. Likewise, the system with a storage volume of 200 L can provide 415 L of the hot water, with a total availability of 601 L of comfort water for users. The efficiency and safety of a system to supply hot water continuously 24 h a day requires an adequate insulation of the pipes and the storage tank to optimize their thermal capacity.
4. Conclusions
This study comprehensively detailed and evaluated the thermal behavior of a DHW plant powered by solar energy, with special emphasis on the sensible heat storage and the various operating parameters of the system. The most notable conclusions are summarized below.
In relation to the operating parameters of the system, it was evident that the flow rate in the secondary circuit exerts a significant influence on the overall performance. It was observed that a higher flow rate of the secondary circuit led to a faster charging and resulted in higher efficiency (72%), compared to a lower flow rate (46%). Furthermore, it was found that the higher flow rates were associated with lower electrical energy consumption by the pumps.
The comparison between the tank capacity and the storage temperature revealed that, during the charging process, the tank of 100 L reached a maximum temperature of 75°C, while the tank of 200 L reached the 60°C. In the discharging process, 55% more DHW was recovered from the larger capacity tank (200 L), despite the high temperature reached of the smaller capacity tank (100 L).
In the consumption management analysis, a deficiency was identified in the thermal storage tank of the 100 L during the night. After the third discharge at 20:00, the temperature at the top of the tank, which was at 60°C, could not maintain enough thermal energy to provide DHW at a temperature higher than 37.5°C at 7:00 in the morning of the next day. The consumption profile plays a crucial role in the discharge of a solar DHW storage system, as it reflects the users’ behavior regarding the DHW consumption.
The experimental results clearly show that a higher flow rate in the secondary circuit enhances overall plant efficiency, while an increased storage capacity leads to a greater recovery of DHW, despite attaining lower maximum charging temperatures. However, several limitations should be acknowledged, including the variability of climatic conditions during testing, measurement uncertainties, and potential influences of uncontrolled thermal losses in auxiliary components. In light of these factors, it is recommended to improve the insulation of both the storage tank and the piping network, as well as to explore the integration of innovative technologies—such as phase change materials (PCMs)—to further reduce heat losses and boost system performance.
Nomenclature
-
- Ac:
-
- Solar collector area
-
- Ahx:
-
- Heat transfer area of the heat exchanger
-
- C1:
-
- Flow rate of the primary circuit
-
- C2:
-
- Flow rate of the secondary circuit
-
- Cdhw:
-
- Outlet flow rate of the hot water from the tank
-
- Cuse:
-
- Flow rate of the use of water
-
- Cp:
-
- Specific heat
-
- D:
-
- Internal diameter of the tank
-
- DHW:
-
- Domestic hot water
-
- ETC:
-
- Evacuated tube collector
-
- FPC:
-
- Solar flat plate collector
-
- HTF:
-
- Heat transfer fluid
-
- k1:
-
- Coefficient of the heat gain of the solar collector
-
- k2:
-
- Coefficient of the heat loss of the solar collector
-
- m:
-
- Mass
-
- 𝜂c:
-
- Efficiency of the solar collector
-
- 𝜂charging:
-
- Efficiency of the tank charging
-
- 𝜂plant:
-
- Efficiency of the plant
-
- 𝜂o:
-
- Optical efficiency of the solar collector
-
- 𝜂overall:
-
- Overall performance of the plant
-
- 𝜂syst:
-
- Efficiency of the system
-
- ρ:
-
- Density
-
- Q:
-
- Amount of thermal energy or heat (J)
-
- QDHW:
-
- Amount of thermal energy of hot water from the tank (J)
-
- :
-
- Heat flow from the outlet of the tank (W)
-
- :
-
- Heat flow into the tank (W)
-
- Qreleased:
-
- Heat released to the tank (J)
-
- :
-
- Heat loss flow (W)
-
- :
-
- Average heat flow through the heat exchanger (W)
-
- :
-
- Net solar power flow (W)
-
- :
-
- Useful heat flow from the solar collector (W)
-
- :
-
- Heat flow of the use water (W)
-
- Quse:
-
- Amount of thermal energy related to use (J)
-
- Rs:
-
- Instantaneous global solar radiation captured by the collector (W/m2)
-
- Rave:
-
- Average global solar radiation per day
-
- Rmax:
-
- Maximum instantaneous global solar radiation reached in summer
-
- Rmin:
-
- Maximum instantaneous global solar radiation in winter
-
- sf:
-
- Solar fraction
-
- SWHS:
-
- Solar water heating system
-
- STS:
-
- Solar thermal system
-
- Ta:
-
- Temperature of the mains water
-
- Tdhw:
-
- Temperature of the domestic hot water
-
- Tamb:
-
- Ambient temperature inside the plant
-
- Tci:
-
- Inlet temperature of the solar collector
-
- TC1, TC2, TC3, TC4, TC5, TC6:
-
- Thermocouples placed into the first tank, from the top to the bottom (thermal energy storage of 100 L capacity)
-
- TL1, TL2, TL3, TL4, TL5, TL6:
-
- Thermocouples placed in the second tank, from the top to the bottom (thermal energy storage of 200 L capacity)
-
- Tco:
-
- Outlet temperature of the solar collector
-
- TES:
-
- Thermal energy storage
-
- Tin:
-
- Hot inlet temperature to storage tank
-
- Tmax:
-
- Maximum temperature reached in the tank in summer
-
- Tmc:
-
- Average temperature of the solar collector
-
- Tmin:
-
- Maximum temperature reached in the winter
-
- Tout:
-
- Outlet temperature of the tank towards the heat exchanger
-
- Tuse:
-
- Usage water temperature
-
- Txi1:
-
- Inlet temperature of the primary circuit to the heat exchanger
-
- Txo1:
-
- Outlet temperature of the primary circuit from the heat exchanger
-
- Txi2:
-
- Inlet temperature to the secondary circuit to the heat exchanger
-
- Txo2:
-
- Outlet temperature of the secondary circuit from the heat exchanger
-
- ΔT:
-
- Temperature difference
-
- ΔTc:
-
- Temperature difference between collector inlet and outlet
-
- ΔTlm:
-
- Logarithmic mean temperature difference of the heat exchanger
-
- Uhx:
-
- Heat transfer coefficient of the heat exchanger
-
- V:
-
- Total volume of the tank
-
- VDHW:
-
- Volume of domestic hot water in the tank
-
- Vi:
-
- Stratified tank volume
-
- yi:
-
- The different layers of the tank where the thermocouples are placed (y1, y2, y3, y4, y5, and y6).
Disclosure
A preprint of the manuscript has previously been published [31].
Conflicts of Interest
The authors declare no conflicts of interest.
Funding
This study was funded by the Agencia Nacional de Investigación y Desarrollo (Grant FONDAP No. 15110019, PUENTE No. 1523A0006, FONDECYT REGULAR No. 1231721, Beca Doctorado Nacional 2018/Folio 21180082, Beca De Doctorado Nacional 2023/Folio No. 21230140, and Beca De Doctorado Nacional 2024/Folio No. 21242487) and Corporación de Fomento de la Producción (Grant 20EBTC-137312).
Acknowledgments
Stephan Pierre Louis, M. Judith Cruz, and Sergio Pablo thank Doctorado en Ingeniería de Procesos de Minerales, Universidad de Antofagasta. Svetlana Ushak, thanks for technical support to the CEO of “PCM Chile SpA” Company, Jose Miguel Carrasco.
Open Research
Data Availability Statement
The data that support the findings of this study are available from the corresponding author upon reasonable request.

