Optimal Energy Recycling, Allocation, and Trading for Electricity, Natural Gas, Heat, and Cold Energies in Factories With Ground Source Heat Pumps
Abstract
To enhance the utilization of corporate green energy, integrated energy systems (IESs) have been proposed, with ground source heat pumps (GSHPs) being widely utilized as a clean energy conversion device within these systems. However, there have been few studies from the perspective of factory-based IES designs regarding energy usage, energy storage, and energy trading considering GSHPs under the Internet of Energy (IoE) framework, especially for recyclable energies from the production equipment in the factory. Consequently, this study firstly formulates a mixed-integer programing model for the factory-based IES with a GSHP under the IoE framework that employs the information from the IoE to make decisions for utilizing, recycling, storing, and trading electricity, natural gas, heat, and cold energies through multienergy trading platforms while optimizing the relevant costs and revenues. Since the simplified harmony search algorithm (SHS) simplifies the classical harmony search algorithm (HSA) to accelerate the method of finding new solutions, and the island model considers migration among multiple subpopulations to increase population diversity, this study takes their advantages to propose the island-based SHS (iSHS) to address the concerned problem. The experimental findings indicate that the iSHS surpasses both SHS and HSA in performance. In comparison to the electricity-based system alone, the proposed IES achieves 39% green energy utilization and a 15.34% reduction in electricity consumption for the baseline factory. For the high-load factory, while electricity consumption remains high, the IES still integrates 9% green energy, demonstrating its potential for scalability and adaptability across different factory scales.
1. Introduction
To achieve carbon neutrality in 2050, the European Union (EU) proposed the “Fit for 55” commitment to reduce carbon emissions by 55% in 2030 compared to 1990. To speed up the transition of industries toward greener practices, the EU will trial the carbon border adjustment mechanism (CBAM) in 2023 to levy a carbon tax on goods exported to the EU. The United States has also introduced a carbon tariff bill, the Clean Competition Act (CCA), which is expected to be trialed in 2024. Energy production and industrial manufacturing stand out as primary contributors to human carbon emissions. Consequently, the mechanisms and bills proposed by the EU and the United States to impose carbon taxes on carbon emissions will inevitably increase the cost of production, affect the global manufacturing industries, and propel the transition toward greener practices in factories. To reduce carbon emissions, factories employ various strategies. However, two main approaches are predominantly discussed. The first approach focuses on reducing the occurrence of carbon emissions through utilizing renewable energy equipments (REEs) and improving energy utilization efficiency [1, 2]. The second approach aims to offset existing carbon emissions through initiatives like afforestation and the deployment of carbon recovery and capture mechanisms [3, 4].
Reducing carbon emissions in the energy sector necessitates a dual focus on ramping up adopting REEs and improving energy utilization efficiency within factories. In pursuit of optimal production efficiency, conventional production lines use Internet of Things (IoTs) technology to gradually transform into smart factories with automated and intelligent production. Different from the centralized power generation model of conventional power grid, the Internet of Energy (IoE) framework [5] features multiple distribution systems. This includes distributed renewable energy (DRE) that facilitates peer-to-peer (P2P) energy transactions through energy trading platforms (ETPs) [6–8]. The IoE collaborates with the network and utilizes big data to monitor real-time energy consumption, enabling the bidirectional transmission of energy and information between energy end-users and suppliers. This approach improves the utilization of renewable energy and decreases energy waste caused by information asymmetry in conventional power grids.
The integrated energy system (IES) includes production equipment (PE), conversion devices, and energy storage systems for various energy types like natural gas, electricity, heat energy, and cold energy. The multienergy system framework can effectively reduce energy losses caused by energy conversion. Among energy conversion devices, the ground source heat pump (GSHP) stands out as an eco-friendly and efficient device capable of converting a small input of electricity into a large amount of both heat and cold energy with zero carbon emissions during the conversion process. Therefore, GSHPs have widely been used in IES framework. Smart factories could use the concepts of IoE and IES to enhance energy utilization efficiency to subsequently lower carbon emissions caused by energy usage. However, there have been limited studies from the perspective of factory-based IES designs regarding energy usage, energy storage, and energy trading considering GSHPs under the IoE framework, especially for recyclable energies from the PE in the factory.
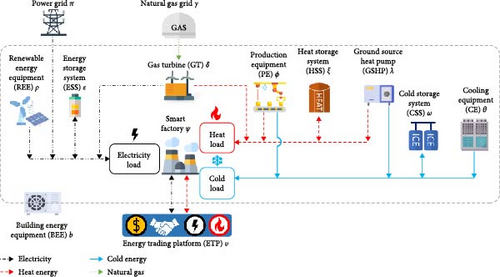
Therefore, this study explores the optimal energy allocation problem of an IoE-based IES within a smart factory, incorporating a GSHP and a multienergy ETP while considering recyclable energies from PE, as shown in Figure 1. By combining the information flow of the IoE, the problem objective is to enhance energy utilization efficiency, decrease energy losses, and consequently reduce carbon emissions from energy usage. Based on this system framework, a mixed-integer programing (MIP) model is established for optimizing the daily energy costs and revenues of the smart factory. Our previous work proposed an efficient metaheuristic algorithm called simplified harmony search algorithm (SHS), which adopts a one-stage new solution generation method to accelerate the two-stage new solution generation method of the classical harmony search algorithm (HSA) [9]. In addition, the island model considers migration among multiple subpopulations to enhance the algorithm’s diversity in population, thereby aiding in escaping local optimal solution. This study further proposes the integration of the island model into the SHS to give rise to the island-based SHS (iSHS) algorithm to solve the concerned problem. Experimental results demonstrate that the proposed iSHS outperforms both SHS and HSA in solving this problem, and the proposed IES can assist the smart factory to achieve green transformation by optimizing energy allocation and reducing carbon emissions.
- •
This study stands as an innovative initiative within the realm of smart factories by proposing a MIP model for the IoE-based IES within a smart factory, incorporating a GSHP, a multienergy ETP, and recyclable energies from PE to decrease energy losses, improve energy utilization efficiency, and lower carbon emissions. With the model, flows of information and multiple energies (including electricity, recycle, natural gas, heat, cold energies) complexify this model.
- •
An iSHS is proposed by integrating the island model into the SHS for enhancing population diversity and aiding in escaping local optima. Experimental results illustrate that the proposed iSHS outperforms SHS and HSA in solving the concerned problem.
2. Related Works
This section examines the IESs based on past studies and then reviews the related studies on island model and SHS algorithm, which are integral components of the algorithm proposed in this study.
2.1. Related Works on IESs
Derived from the regional microgrid framework, the IES was initially developed to explore unified regional parallel frameworks with two or more energy sources [10, 11], e.g., electricity, heat, and natural gas. The IES relies on advanced information processing and energy management technologies to implement multienergy scheduling and management, which can effectively enhance energy utilization efficiency [12], increase utilization of REEs [13], reduce operating expenses, and mitigate carbon emissions [13, 14]. It also enables organizations to optimize energy usage across diverse energy sources and devices.
This study focuses on the energy allocation optimization problems under IESs, holding significant importance for achieving energy sustainability and economic benefits. The past related studies are generally categorized as follows: system design, operation strategy, and system optimization. On system designs for IESs, Li et al. [15] and He et al. [16] examined variations in energy sources integrated with IESs and assessed how various energy conversion devices influence the overall system design. Zhang et al. [17] designed an IES with a GSHP, and showed its outperformance than those without GSHPs, in terms of lowering carbon emissions and energy use costs.
On operation strategies for different equipment in IESs, Zhang et al. [18] proposed a seasonal operation strategy for GSHPs in IESs to reduce energy cost. Xiang et al. [19] designed a price-based demand response strategy aimed at minimizing annual costs of the grid-connected IES and demonstrated significant economic and environmental benefits under various configurations and market conditions. Wei et al. [20] optimized IESs through a stochastic predictive control strategy, resulting in total cost reductions of up to 3.4%.
On system optimization for IESs, Huang et al. [21] enhanced the reliability of a multienergy IES through a resilience-oriented planning approach so that the system has a stronger capability to withstand stochastic events such as natural disasters. Capone et al. [22] considered the demand response of heat storage in an electric-thermal integrated multienergy framework to optimize energy costs. The IES proposed by Su,Zhou, and Tan [23] dynamically optimizes household energy usage by switching between gas and electricity, reducing costs by up to 23.4% compared to traditional methods. Wu et al. [11] suggested an IES containing GSHPs to effectively utilize green energy so as to optimize the energy utilization efficiency as well as the utilization of green energy. Table 1 compares the abovementioned previous works on IESs with this study, in which “CHP” represents the combined heat and power.
| Reference | Method | Objectives | Electricity | Electricity storage |
Heat energy | Heat storage | Heat recycle | Natural gas | CHP | Cold energy | Cold storage | GSHP |
|---|---|---|---|---|---|---|---|---|---|---|---|---|
| [12] | CVaR | System operation cost | ✓ | ✓ | ✓ | ✓ | — | ✓ | ✓ | ✓ | — | — |
| [16] | CPLEX solver | Operation cost and emission cost | ✓ | — | ✓ | ✓ | — | ✓ | ✓ | — | — | ✓ |
| [13] | CPLEX solver | Daily operation cost | ✓ | — | ✓ | — | — | ✓ | ✓ | — | — | — |
| [14] | Simulation | System operation cost | ✓ | ✓ | ✓ | ✓ | — | ✓ | ✓ | ✓ | — | — |
| [19] | Simulation | Total annual cost | ✓ | ✓ | ✓ | — | ✓ | ✓ | ✓ | — | — | — |
| [21] | Simulation | Resilience and reliability | ✓ | — | ✓ | ✓ | — | — | ✓ | ✓ | ✓ | — |
| [24] | Simulation | System operation cost | ✓ | ✓ | ✓ | ✓ | — | ✓ | ✓ | ✓ | ✓ | — |
| [17] | GA | Annual total cost, energy efficiency, and the saving rate of CO2 emissions | ✓ | — | ✓ | — | — | ✓ | ✓ | ✓ | — | ✓ |
| [15] | QGA, SGA | System operation cost and energy efficiency | ✓ | — | ✓ | — | — | ✓ | ✓ | — | — | ✓ |
| [23] | GA | Household energy cost and emissions | ✓ | — | — | — | — | ✓ | — | — | — | — |
| [20] | Scenario-based SMPC | Operation cost and energy consumption | ✓ | ✓ | ✓ | ✓ | — | — | ✓ | ✓ | — | — |
| [22] | GA | Operation cost | ✓ | ✓ | ✓ | ✓ | — | — | ✓ | — | — | — |
| [1] | FOA | Annual total cost, energy efficiency, and the saving rate of CO2 emissions | ✓ | ✓ | ✓ | ✓ | — | ✓ | ✓ | ✓ | ✓ | — |
| [18] | BES algorithm | System operation cost and environmental pollutant | ✓ | ✓ | ✓ | ✓ | — | ✓ | ✓ | ✓ | ✓ | ✓ |
| [11] | MO-NSGA-II | System operation cost, energy efficiency and environmental pollutant | ✓ | — | ✓ | ✓ | — | ✓ | ✓ | ✓ | — | ✓ |
| This study | iSHS | Operation cost and revenue | ✓ | ✓ | ✓ | ✓ | ✓ | ✓ | ✓ | ✓ | ✓ | ✓ |
- Abbreviations: IES, integrated energy system; iSHS, island-based simplified harmony search.
2.2. Island Model
When reviewing the classic genetic algorithm (GA), Whitley [25] introduced a population structuring strategy referred to as the island model, which partitions the solution population into multiple subpopulations, each of which functions as a separate duplication of the GA. Upon reaching a specific number of iterations, a predetermined number of individuals exchange between islands. This process, termed migration, is repeated across all islands to uphold population diversity and aid in problem-solving without converging towards local optimal solutions. Corcoran and Wainwright [26] solved multiprocessor scheduling problems using island model GA (IMGA), which effectively preserves population diversity, thereby improving the performance of the algorithm. This strategy has been successfully combined with various metaheuristic algorithms, e.g., island crow search algorithm [27], island cuckoo search algorithm [28], multi-island GA [29], and island HSA [30]. The island model is widely recognized as one of the most popular structural population strategies due to its effectiveness in preserving population diversity throughout the search process [31].
2.3. Simplified Harmony Search
The HSA [9] is a metaheuristic algorithm inspired by the process of musicians improvising notes. The HSA employs two parameters harmony memory consideration rate (HMCR) and pitch adjustment rate (PAR) to govern the two-stage process of selecting one of three operations (i.e., randomly generating a new note, choosing a note from the harmony memory (HM) and choosing a note from the HM and adjusting its pitch) to determine new notes, as shown in Figure 2a. The HSA considers the HM, which stores the best solutions found thus far. The HSA continually searches for optimal solutions by replacing inferior solutions in the HM with better ones.
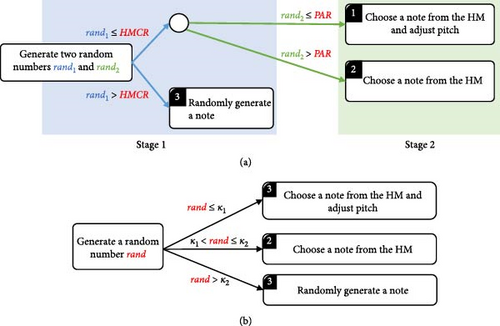
Our previous work proposed the SHS algorithm [32] to improve the HSA. As shown in Figure 2b, the SHS adopts a single-stage judgement based on the two parameters κ1 and κ2 to select one of the three operations for generating new notes random number. This simplification contributes to a better performance compared to the HSA. The SHS not only accelerates the algorithm’s solution generation speed but also enhances solution stability. This improvement signifies a significant advancement in optimization algorithms, making the SHS a promising choice for various optimization tasks.
3. Problem Description
3.1. System Framework
- •
REE: This contains solar panels and wind turbines.
- •
Gas turbine (GT): This device converts natural gas or various types of fuel into both electricity and heat energy.
- •
PE: Within the smart factory, the heat and cold energy generated by the PE is recycled and reused.
- •
GSHP: This device transforms geothermal heat energy into heat and cold energy that can be used by the factory. Its energy output varies depending on the season.
- •
Cooling equipment (CE): This device converts electricity into cold energy and provides cold energy when the system’s cold energy supply is insufficient.
- •
Energy storage systems: The electricity storage system (ESS), heat storage system (HSS), and cold storage system (CSS) can effectively charge and discharge electricity, heat energy, and cold energy, respectively. Excess energy can be stored for later use when the current energy supply exceeds demand.
- •
ETP: The system sells the excess electricity and heat energy from the smart factory to the ETP. It can also purchase electricity and heat energy from the ETP as needed.
- •
Electricity: This pipeline is connected to the power grid, REE, GT, ESS, and ETP to ensure efficient energy delivery to electricity load.
- •
Heat energy: This pipeline is connected to the PE, GSHP, GT, HSS, and ETP to ensure efficient energy delivery to heat load.
- •
Cold energy: This pipeline is connected to the PE, GSHP, CE, and CSS to ensure efficient delivery to cold load.
- •
Natural gas: This pipeline delivers natural gas to the GT.
- •
Electricity load: This system prioritizes the use of electricity generated by REE. If the power generation and storage in the factory cannot meet the factory’s electricity load, the factory will buy electricity from the power grid or ETP.
- •
Heat load: This system prioritizes the use of heat energy generated by PE and GSHP to satisfy the factory’s heat energy demand. If the heat generation and storage in the factory are insufficient, the factory will purchase heat energy from the ETP.
- •
Cold load: This system prioritizes the use of cold energy generated by PE and GSHP. If the cold energy supply exceeds the demand, the surplus cold energy will be stored in the CSS. If the cold energy in the factory is insufficient, the factory will use the EC to generate more cold energy.
3.2. Problem Model
This study considers an IES as shown in Figure 1, including five sources of electricity: REE, GT, ESS, ETP, and power grid; five sources of heat energy are listed as follows: PE, GSHP, GT, HSS, and ETP; four sources of cold energy are listed as follows: PE, GSHP, CSS, and CE; and one source of natural gas: natural gas grid. The excess electricity and heat energy generated by this IES can be sold to other organizations in need through the ETP.
- •
The electricity price of the power grid in this system adopts the real-time pricing (RTP) mechanism. The power grid sets 24 hourly RTPs of 1 day {pπ (1), pπ (2), …, pπ (t), …, pπ (24)} based on the demand for the previous day. This factory is informed of the 24 hourly RTPs before starting operation each day.
- •
The hourly electricity price pυe (t) of ETP υ for every hour t is assumed to be known and be affected by the current electricity RTP fluctuations and the current electricity supply and demand situation.
- •
The hourly heat energy price pυh (t) of ETP υ and natural gas price pγ (t) of natural gas grid γ for each hour t are assumed to be known.
- •
The electricity load De (t), heat energy load Dh (t), and cold energy load Dc (t) of this factory for every hour t are assumed to be known
- •
This factory cannot abuse more energy than required in each day.
- •
As energy transmission technology matures, it is assumed that no energy loss occurs during transmission through the power grid, natural gas grid, and ETP. This study only considers the loss of energy due to energy conversion equipment (i.e., GT δ, GSHP λ, and CE θ) and energy storage systems (i.e., ESS, HSS, and CSS). Hence, this study assumes that each energy conversion equipment has a coefficient of performance (COP) (i.e., βδ, βλ, and βθ).
- •
Each energy storage system (i.e., ESS, HSS, and CSS) cannot be charged and discharged simultaneously.
This study establishes a MIP model for optimizing energy management decisions (including determining the timing of charging and discharging energy storage systems, electricity purchased from the power grid, electricity, and heat energy purchased from the ETP, energy stored in energy storage systems, electricity used in CE, and consumption of natural gas) in the IES outlined in the previous section. Table 2 displays the relevant notations used in the model, with all energy-related variables converted to SI units for consistency. Specifically, joules (J) are used for electricity, heat energy, and cold energy, while the energy content of natural gas is also expressed in joules.
| Parameter | Definition | Unit |
|---|---|---|
| pπ (t) | The price of buying electricity from power grid π for hour t | €/J |
| pυe (t) | The price of trading electricity from ETP υ for hour t | €/J |
| pγ (t) | The price of buying natural gas from natural gas grid γ for hour t | €/J |
| pμϕ, pμδ, pμb | The maintenance costs of PE ϕ, GT δ, and BEE b, respectively | €/J, €/J, €/J |
| Eϕ (t) | The electricity consumed by PE ϕ for hour t | J |
| Eb (t) | The electricity consumed by BEE b for hour t | J |
| pυh (t) | The price of trading heat energy from ETP υ for hour t | €/J |
| EPV (t) | The amount of electricity generated by solar panels for hour t | J |
| EWT (t) | The amount of electricity generated by wind turbines for hour t | J |
| βδe | The COP of GT δ from natural gas into electricity | — |
| βδh | The COP of GT δ from natural gas into heat energy | — |
| De (t) | The electricity load for hour t | J |
| Dh (t) | The heat energy load for hour t | J |
| Dc (t) | The cold energy load for hour t | J |
| Hϕ (t) | The heat energy produced by PE ϕ for hour t | J |
| Hλ (t) | The heat energy produced by GSHP λ for hour t | J |
| Kϕ (t) | The cold energy produced by PE ϕ for hour t | J |
| Kλ (t) | The cold energy produced by GSHP λ for hour t | J |
| yλh | Binary variable indicating whether the GSHP is in heating mode (1 if heating is active, 0 otherwise) | — |
| yλc | Binary variable indicating whether the GSHP is in heating mode (1 if cooling is active, 0 otherwise) | — |
| Eλ | The input electricity of GSHP λ (which is set to 1 J in this study) | J |
| βλ | The COP of heat energy or cold energy generated by GSHP λ based on the input electricity | — |
| βθ | The COP of CE θ from electricity to cool energy | — |
| Gδ,min | The minimum hourly natural gas transmission amount for GT δ | J |
| Gδ,max | The maximum hourly natural gas transmission amount for GT δ | J |
| Eπ,min | The minimum hourly electricity transmission amount for power grid π and ETP υ | J |
| Eπ,max | The maximum hourly electricity transmission amount for power grid π and ETP υ | J |
| Hυ,min | The minimum hourly heat transmission capacity of ETP υ | J |
| Hυ,max | The maximum hourly heat transmission capacity of ETP υ | J |
| Eε,min | The minimum capacity of ESS ε | J |
| Eε,max | The maximum capacity of ESS ε | J |
| Eψε,min | The minimum hourly charge capacity of ESS ε | J |
| Eψε,max | The maximum hourly charge capacity of ESS ε | J |
| Eεψ,min | The minimum hourly discharge capacity of ESS ε | J |
| Eεψ,max | The maximum hourly discharge capacity of ESS ε | J |
| Hξ,min | The minimum capacity of HSS ξ | J |
| Hξ,max | The maximum capacity of HSS ξ | J |
| Hψξ,min | The minimum hourly charge capacity of HSS ξ | J |
| Hψξ,max | The maximum hourly charge capacity of HSS ξ | J |
| Hξψ,min | The minimum hourly discharge capacity of HSS ξ | J |
| Hξψ,max | The maximum hourly discharge capacity of HSS ξ | J |
| Kω,min | The minimum capacity of CSS ω | J |
| Kω,max | The maximum capacity of CSS ω | J |
| Kψω,min | The minimum hourly charge capacity of CSS ω | J |
| Kψω,max | The maximum hourly charge capacity of CSS ω | J |
| Kωψ,min | The minimum hourly discharge capacity of CSS ω | J |
| Kωψ,max | The maximum hourly discharge capacity of CSS ω | J |
| Response variable | Definition | Unit |
| Ce | The total purchased electricity cost for 1 day | € |
| Cg | The total natural gas cost for 1 day | € |
| Cμ | The total equipment maintenance cost for 1 day | € |
| Rυe | The total revenue of selling electricity to ETP υ for 1 day | € |
| Rυh | The total revenue of trading heat energy to ETP υ for 1 day | € |
| Rε | The residual electricity value of ESS ε at the end of 1 day | € |
| Rξ | The residual heat energy value of HSS ξ at the end of 1 day | € |
| Rω | The residual cold energy value of CSS ω at the end of 1 day | € |
| Eθ | The input electricity of CE θ | J |
| Eε (t) | The amount of energy stored in ESS ε at hour t | J |
| Hξ (t) | The amount of heat energy stored in HSS ξ at hour t | J |
| Kω (t) | The amount of cold energy stored in CSS ω at hour t | J |
| Decision variable | Definition | Unit |
| yε (t) | A binary variable that indicates whether to charge or discharge ESS ε for hour t | — |
| yξ (t) | A binary variable that indicates whether to charge or discharge HSS ξ for hour t | — |
| yω (t) | The binary variable that indicates whether to charge or discharge CSS ω for hour t | — |
| Eπ (t) | The electricity purchased from power grid π at hour t | J |
| Eυψ (t) | The electricity purchased by factory ψ from ETP υ at hour t | J |
| Eψυ (t) | The electricity sold by factory ψ to ETP υ at hour t | J |
| G (t) | The natural gas consumed by GT δ for hour t | J |
| Hυψ (t) | The heat energy purchased by factory ψ from ETP υ for hour t | J |
| Hψυ (t) | The heat energy sold by factory ψ to ETP υ for hour t | J |
| Eεψ (t) | The electricity discharged from ESS ε to factory ψ for hour t | J |
| Eψε (t) | The electricity charged from factory ψ into ESS ε for hour t | J |
| Hξψ (t) | The heat energy discharged from HSS ξ to factory ψ for hour t | J |
| Hψξ (t) | The heat energy charged from factory ψ into HSS ξ for hour t | J |
| Kθ (t) | The cold energy produced by CE θ for hour t | J |
| Kωψ (t) | The cold energy discharged from CSS ω to factory ψ for hour t | J |
| Kψω (t) | The cold energy charged from factory ψ into CSS ω for hour t | J |
- Abbreviations: CSS, cold storage system; ESS, electricity storage system; ETP, energy trading platform; GT, gas turbine; HSS, heat storage system.
Note that the GSHP operates in a single mode (either heating or cooling) based on seasonal climate conditions. This operational limitation is due to the design characteristics of the GSHP, which cannot simultaneously generate both heat and cold energy. For simplification, this study assumes a constant COP for the GSHP under the given mode of operation, regardless of climate variations. This assumption ensures the feasibility of the model and focus on the energy allocation problem.
4. Proposed iSHS Algorithm for the Concerned Energy Allocation Problem
This study incorporates the island model into the SHS, named iSHS, and adapts it to solve the concerned problem, to enhance the algorithm’s exploration ability through increasing population diversity.

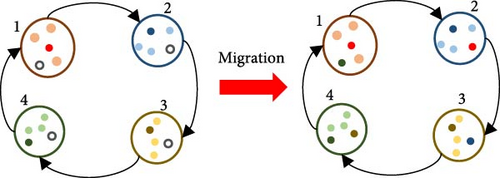
The flowchart of the iSHS for the concerned problem is shown in Algorithm 1, and it is described as follows. Line 1 initializes each feasible harmony on each IM with Algorithms 2 and 3 and then evaluates its fitness with Algorithm 4. Then, Lines 2–12 enter the main loop with iter iterations. In the main loop, Lines 3–8 consider each island j of In islands. Line 4 generates a new harmony Xnew with the SHS procedure in Algorithm 5. Line 5 checks if Xnew is infeasible and repairs its infeasibility with Algorithm 3. Line 6 evaluates the fitness of Xnew with Algorithm 4. Line 7 replaces the worst harmony in IM j by Xnew. When the iteration number iter every Fm times, Lines 9–11 conduct the ring island migration scheme, i.e., considering all the islands arranged in a ring, the best harmony (i.e., migrant) on each island replaces the worst harmony on the next island in the ring, as illustrative in Figure 3b. After the main loop, Line 13 outputs the best harmony among all IMs as the final solution.
-
Algorithm 1: iSHS.
-
Parameters: κ1, κ2, harmony memory size hms, bandwidth bw, maximum number of iterations iter, number of islands In, migration frequency Fm, and migration rate Rm.
-
Output: Solution Xbest.
-
-
1: Use Algorithms 2 and 3 to initialize each feasible harmony on each IM, and use Algorithm 4 to evaluate its fitness.
-
2: for i = 1, 2, …, iter do
-
3: for j = 1, 2, …, In do
-
4: Use the SHS procedure based on IM j in Algorithm 5 to generate a new harmony Xnew.
-
5: If harmony Xnew is infeasible, then repair it with Algorithm 3.
-
6: Evaluate the fitness of harmony Xnew with Algorithm 4.
-
7: If the fitness of harmony Xnew exceeds that of the worst harmony in IM j, replace the worst harmony with Xnew.
-
8: end for
-
9: if iter mod Fm = 0 do
-
10: For each j = 1, 2, …, In, the round (Is × Rm) best harmony of IM j replaces the round (Is × Rm) worst harmonies of the next IM, i.e., IM (j + 1) mod In.
-
11: end if
-
12: end for
-
13: Output the best harmony among all IMs as the output solution.
-
Algorithm 2: Initializing_a_harmony.
-
1: for t = 1, 2, …, 24 do
-
2: yε (t), yξ (t), and yω (t) are initialized randomly within the range [0, 1].
-
3: Eπ (t), Eυψ (t), and Eψυ (t) are set randomly within the range [Eπ,min, Eπ,max].
-
4: G (t) is set randomly within the range [Gδ,min, Gδ,max].
-
5: if yε (t) = 0 then
-
6: Eεψ is set randomly within the range [Eεψ,min, min{Eε (t – 1), Eε,max, Eεψ,max}]
-
7: Eψε = 0
-
8: else
-
9: Eεψ = 0
-
10: Eψε is set randomly within the range [Eψε,min, min{Eε,max – Eε (t – 1), Eψε,max}]
-
11: end if
-
12: Hυψ and Hψυ are set randomly within [Hξ,min, Hξ,max].
-
13: if yξ (t) = 0 then
-
14: Hξψ is set randomly within the range [Hξψ,min, min{Hξ (t – 1), Hξ,max, Hξψ,max}]
-
15: Hψξ = 0
-
16: else
-
17: Hξψ = 0
-
18: Hψξ is set randomly within the range [Hψξ,min, min{Hξ,max – Hξ (t – 1), Eψξ,max}]
-
19: end if
-
20: Kθ (t) = Dc (t) + Kψω (t) – Kϕ (t) – Kλ (t) – Kωψ (t)
-
21: if yω (t) = 0 then
-
22: Kωψ is set randomly within the range [Kωψ,min, min{Kω (t – 1), Kω,max, Kωψ,max}]
-
23: Kψω = 0
-
24: else
-
25: Kωψ = 0
-
26: Kψω is set randomly within the range [Kψω,min, min{Kω,max – Kω (t – 1), Kψω,max}]
-
27: end if
-
28: end for
-
29: Repair infeasible solutions with Algorithm 3.
-
30: Return X = [v1v2 … v24] where vt = [yε (t), yξ (t), yω (t), Eπ (t), Eυψ (t), Eψυ (t), G (t), Hυψ (t), Hψυ (t), Eεψ (t), Eψε (t), Hξψ (t), Hψξ (t), Kθ (t), Kωψ (t), Kψω (t)]⊤
-
Algorithm 3: Repair (harmony X = [Xr,t]16 × 24).
-
1: for t = 1, 2, …, 24 do
-
2: if xr,t violates the upper bound of Constraints (10)–(40) then
-
3: xr,t is assigned with the minimal upper bound of the violated constraints.
-
4: else if xr,t violates the lower bound of Constraints (10)–(40) then
-
5: xr,t is assigned with the maximal lower bound of the violated constraints.
-
6: end if
-
7: end for
-
Algorithm 4: Evaluate_fitness (harmony X = [Xr,t]16 × 24).
-
1: if X violates η constraints from Constraints (10)–(40) then
-
2: P = η·M
-
3: end if
-
4: for t = 1, 2, …, 24 do
-
5: Ce = Ce + pπ (t)·Eπ (t) + pυe (t)·Eυψ (t)
-
6: Cg = Cg + pγ (t)·G (t)
-
7: Cμ = Cμ + pμφ·Eφ (t) + pμδ·G (t) + pμb·Eb (t)
-
8: Rυe = Rυe + pυe·Eψυ (t)
-
9: Rυh = Rυh + pυh·(Hψυ (t) – Hυψ (t))
-
10: p1 = p1 + pπ (t) + pυe (t)
-
11: p2 = p2 + pυh (t)
-
12: p3 = p3 + (pπ (t) + pυe (t))·βθ
-
13: end for
-
14: Rε = Eε (24)·p1/48
-
15: Rξ = Hξ (24)·p2/24
-
16: Rω = Kω (24)·p3/48
-
17: Return f (X) = Ce + Cg + Cμ – Rυe –Rυh – Rε – Rξ – Rω + P
-
Algorithm 5: SHS_generate_new_harmony (IM j).
-
1: for t = 1, 2, …, 24 do
-
2: if r = 1, 2, 3 then
-
3: is assigned to a random binary number.
-
4: else //, i.e., r = 4, 5, …, 16
-
5: rand1 = rand(0, 1)
-
6: if rand1 > κ2 then
-
7: is set as an arbitrary note Xr,t from IM j, and is adjusted with pitch bw, i.e., purtubed between the range [–bw, bw].
-
8: else if rand1 > κ1 then
-
9: is set as an arbitrary note Xr,t from IM j.
-
10: else
-
11: is set as a random value selected from its feasible range.
-
12: end if
-
13: end if
-
14: end for
-
15: Return harmony .
4.1. Solution Encoding and Initialization
4.2. Fitness Evaluation
The fitness of a harmony is evaluated by Algorithm 4, based on Equations (2)–(9) and (45).
4.3. SHS Procedure for Generating a New Harmony
The SHS improves the HSA to generate a new note in only one stage based on two parameters κ1 and κ2, as illustrated in Figure 2b. This study employs the scheme to generate a new harmony for the concerned problem in Algorithm 5.
5. Experimental Results and Analysis
5.1. Experimental Environment and Parameter Settings
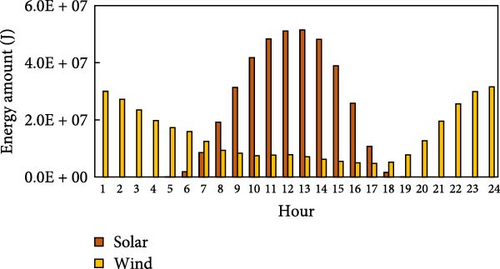
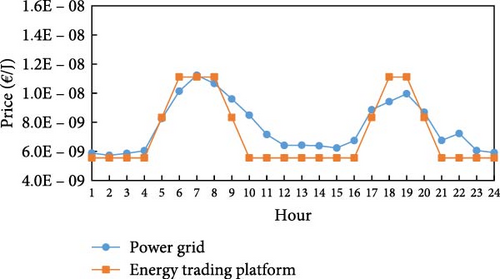
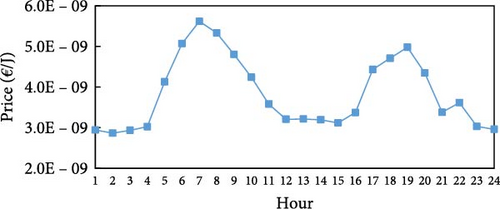
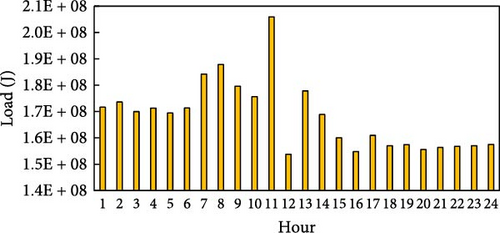
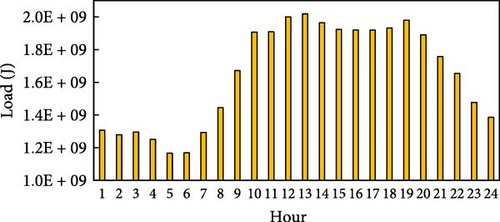
The settings of the experimental environment for this study are shown in Table 3, with all date-related settings set to April 1, 2016. The date, April 1, 2016, was chosen because it represents one of the days with the most comprehensive data from the referenced dataset. From the available days with complete data, this date was randomly selected for the experiments. The parameters related to this specific date include the hourly renewable energy generation data, electricity prices, and heat energy prices, which are all based on real data corresponding to April 1, 2016. These parameters are detailed in Table 3 and Figure 4a–c. Natural gas prices are referenced to the daily natural gas price information on the Trading Economics website [33] on the day. The electricity generation data for both solar and wind is based on renewable energy generation data from a factory in southern Germany provided by Open Power System Data [34], from which the electricity generation was extracted for each hour of the day, as illustrated in Figure 4a. On that day, the electricity price of the grid is determined by the German real-time electricity price provided by [35]. The hourly price of the ETP is derived from the energy trading price model introduced by Yaagoubi and Mouftah [36]. This model captures the dynamics of real-time electricity supply and demand as well as RTP fluctuations at the time of its publication. It is crucial to highlight that the prices used in this study are reflective of the market conditions and assumptions embedded in the 2015 model. The distribution of real-time prices on electricity of the grid, the ETP, and heat energy is shown in Figure 4b, c.

| Parameter | Setting |
|---|---|
| COP from electricity to cold energy (βθ) | 3.0 |
| COP from natural gas to electricity (βδe) | 0.66 |
| COP from natural gas to heat energy (βδh) | 0.8 |
| pγ (t) | 1.675036 × 10⁻⁶ €/J |
| EPV (t) and EWT (t) | Figure 4a |
| pπ (t) and pυe (t) | Figure 4b |
| pυh (t) | Figure 4c |
| Dh (t) | Figure 4d |
| Dc (t) | Figure 4e |
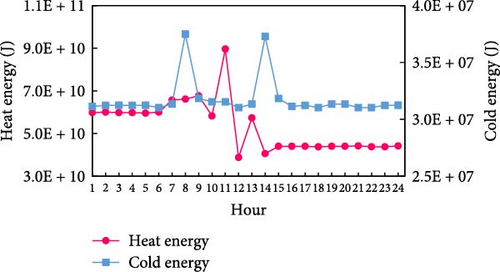
| Heat and cold energy recycling data | Figure 4f |
| βλ | Figure 4g |
| De (t) for the baseline factory | Figure 5a |
| De (t) for the high-load factory | Figure 5b |
- Abbreviation: COP, coefficient of performance.
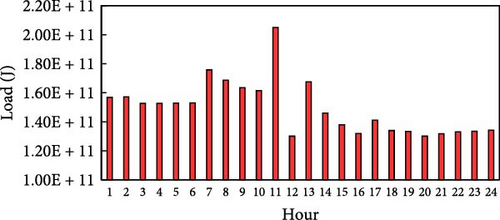
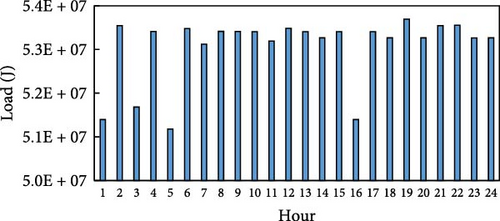
This study considers two factory examples: a baseline factory with a relatively low electricity load and a high-load factory with a significantly larger electricity demand. Electricity load data for a baseline factory is referred to Open Power System Data for southern Germany [37] (Figure 5a). To account for variations in electricity load data across different industry scales, additional data for a high-load factory is extracted from German BDEW’s normalized standard load profiles [38]. Specifically, the “G3-Gewerbe durchlaufend” category, suitable for continuous commercial operations, is selected to match the requirements of this study. Considering the time frame of April 1, 2016, data for the Übergangszeit (transitional period) and Werktag (working day) conditions are used (Figure 5b).
The cold and heat energy load data of the factories are simulated based on the electricity load profiles from the Open Power System Data for southern Germany [37]. The heat load is estimated by taking the electricity demand for air conditioning during the heating season (October to April, as defined for Europe) and adding 60% of the electricity demand of a specific machine, which is assumed to perform heating functions. This assumption allows the electricity demand for this machine to be replaced by equivalent heat energy demand. The cold load is estimated by taking the electricity demand for air conditioning during the cooling season (April to October) and combining it with the cold energy demands of the cooling pumps and cooling aggregate from the dataset. Figure 4d, e illustrate the simulated heat and cold energy load profiles for the baseline factory based on these calculations.
Additionally, the heat and cold energy recovery data of the factories is calculated from the heat and cold energy recycling rate of the energy loads (Figure 4f). However, the recycling rates vary across different industries. Since this study discusses the energy integration framework of a future smart factory, the recycling rate is set at 70%.
The parameter settings of the three energy storage systems considered in this study are given in Table 4, in which the partial parameters (including the ESS capacity for the baseline factory 1.80000 × 10⁸ J) are referred to [18]. To design an ESS for the high-load factory, the total daily electricity consumption is 4.01800 × 10¹⁰ J [38]. Since the storage system is designed to integrate with REEs, consisting of solar and wind power, it would need to store up to half a day’s electricity consumption, requiring a capacity of 2.00880 × 10¹⁰ J (Table 4). These considerations ensure the energy storage system is customized to meet the operational and sustainability goals of the factory.
| System | Capacity (J) | Storage loss rate (%/h) | Charge and discharge energy loss ratio (%/h) | Maximum storage capacity (%/h) | Minimum storage capacity (%/h) | Initial storage state (%/h) |
|---|---|---|---|---|---|---|
| ESS for the baseline factory | 1.80000 × 10⁸ | 0.01 | 0.05 | 90 | 10 | 50 |
| ESS for the high-load factory | 2.00880 × 10¹⁰ | 0.01 | 0.05 | 90 | 10 | 50 |
| HSS | 3.69271 × 10⁹ | 0.02 | 0.12 | 90 | 10 | 50 |
| CSS | 7.03200 × 10⁸ | 0.02 | 0.12 | 90 | 10 | 50 |
- Abbreviations: CSS, cold storage system; ESS, electricity storage system; HSS, heat storage system.
As shown in Figure 4g, the COP of GSHP is based on the dataset for Germany provided by Open Power System Data [37]. Note that in southern Germany during the season of April 2016, the GSHP can only generate heat energy. All the experiments were conducted on a PC with Intel Core i7-10700 CPU @ 2.90 GHz and 16 GB of RAM.
This study compares the performance of the proposed iSHS using different island numbers (i.e., iSHS_2, iSHS_3, iSHS_4, and iSHS_5 denoting the iSHS with 2, 3, 4, and 5 islands, respectively) to SHS and HAS because iSHS is an extension of SHS and HSA. Parameter settings for these algorithms have a significant impact on their performance. Therefore, three parameter levels for each parameter of these algorithms are tested for parameter optimization, while the termination condition for each experiment is 10,000 iterations and 30 experiments are conducted for each parameter. The best parameter settings of each algorithm are set based on their performance tested using one-way ANOVA. The results of all the parameters of these algorithms are presented in Table 5.
| Algorithm | Parameter | Notation | Value |
|---|---|---|---|
| iSHS | Number of islands | In | 2/3/4/5 |
| Harmony memory size | hms | 60 | |
| Migration frequency | Fm | 200 | |
| Migration rate | Rm | 20 | |
| Pitch adjusting bandwidth | bw | 0.01 | |
| Parameter 1 | κ1 | 0.05 | |
| Parameter 2 | κ2 | 0.8 | |
| SHS | Harmony memory size | hms | 60 |
| Pitch adjusting bandwidth | bw | 0.01 | |
| Parameter 1 | κ1 | 0.05 | |
| Parameter 2 | κ2 | 0.8 | |
| HSA | Harmony memory size | hms | 60 |
| Pitch adjusting bandwidth | bw | 0.01 | |
| Harmony memory consideration rate | HMCR | 0.95 | |
| Pitch adjusting rate | PAR | 0.8 | |
| All | Number of iterations | Iter | 105 |
- Abbreviations: HSA, harmony search algorithm; iSHS, island-based SHS; SHS, simplified harmony search.
5.2. Performance Comparison of Different Algorithms
The examples for the baseline and high-load factories both involve 15 decision variables across 24 h (15 × 24). In addition to the two examples, this study additionally considers an illustrative example for a smaller problem with 15 decision variables for hour 1 (15 × 1) to better demonstrate the advantages of the proposed algorithm. The illustrative example is designed to provide an intuitive understanding of the algorithm’s performance under simplified conditions, where only 1 h is considered. The comparison of the three experimental settings is as follows: the illustrative example (15 × 1), the baseline factory with a relatively low electricity load (15 × 24), and the high-load factory with electricity demand 100 times larger than the baseline factory (15 × 24).
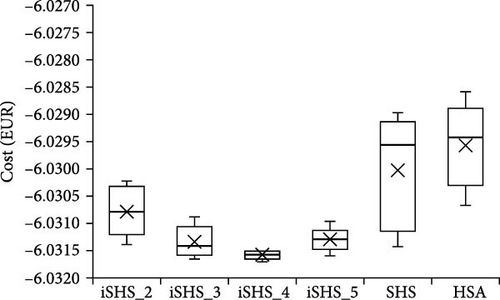
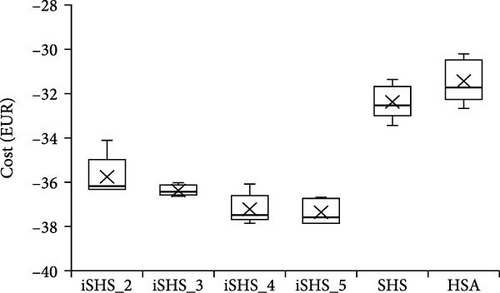
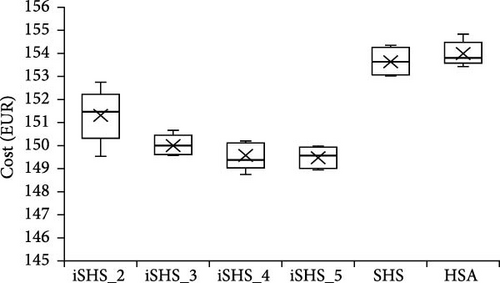
The statistics of the experimental results for the six algorithms, each running five times, for the illustrative example, the baseline factory, and the high-load factory scenarios are shown in Table 6; and their box plots are visualized in Figure 6. For the illustrative example, the experimental results indicate that the performance of all algorithms shows minimal variation, with differences only observable at the third decimal place of the total cost. This suggests that the simplified nature of the example reduces the complexity of the optimization problem, leading to comparable solutions across algorithms. Among the six algorithms, iSHS_4 achieves the best average performance (−6.03159) and the smallest standard deviation (8.09 × 10⁻⁵), highlighting its stability and effectiveness. These results confirm that while the illustrative example provides a straightforward problem for evaluation, the iSHS_4 algorithm still demonstrates a consistent advantage in terms of precision and reliability.
| Factory type | Algorithm | Best | Average | Worst | StdDev | Average carbon emissions (kgCO2eq) | Execution time | Iteration of finding the best fitness | Time of finding the best fitness |
|---|---|---|---|---|---|---|---|---|---|
| Illustrative example | iSHS_2 | −6.03139 | −6.03078 | −6.03023 | 4.64 × 10⁻⁴ | −11.12843 | 48′′ | 67,207 | 0′30′’ |
| iSHS_3 | −6.03166 | −6.03134 | −6.03089 | 2.96 × 10⁻⁴ | −11.12843 | 1′04′′ | 64,527 | 39′′ | |
| iSHS_4 | –6.03171 | –6.03159 | –6.03151 | 8.09 × 10⁻⁵ | −11.12842 | 1′20′′ | 80,511 | 1′42′′ | |
| iSHS_5 | −6.03160 | −6.03130 | −6.03097 | 2.24 × 10⁻⁴ | −11.12843 | 1′38′′ | 99,573 | 1′35′′ | |
| SHS | −6.03143 | −6.03003 | −6.02898 | 1.06 × 10⁻³ | −11.12840 | 2′51′′ | 37,297 | 0′62′′ | |
| HSA | −6.03067 | −6.02966 | −6.02859 | 8.75 × 10⁻⁴ | –11.12843 | 2′56′′ | 97,480 | 2′49′′ | |
| Baseline factory | iSHS_2 | −36.30 | −35.75 | −34.10 | 0.94 | 267.37 | 11′23′′ | 98,839 | 11′13′′ |
| iSHS_3 | −36.62 | −36.38 | −36.03 | 0.24 | 269.09 | 16′05′′ | 99,313 | 15′56′′ | |
| iSHS_4 | –37.84 | −37.21 | −36.07 | 0.68 | 270.83 | 20′34′′ | 95,497 | 19′37′′ | |
| iSHS_5 | −37.83 | –37.35 | –36.65 | 0.56 | 273.04 | 25′07′′ | 99,026 | 24′49′′ | |
| SHS | −33.43 | −32.37 | −31.36 | 0.77 | 203.81 | 8′11′′ | 95,085 | 7′48′′ | |
| HSA | −32.66 | −31.45 | −30.22 | 0.96 | 228.20 | 9′56′′ | 93,135 | 9′13′′ | |
| High-load factory | iSHS_2 | 149.53 | 151.31 | 152.74 | 1.16 | 5894.96 | 11′25′′ | 98,980 | 11′17′′ |
| iSHS_3 | 149.58 | 150.04 | 150.68 | 0.45 | 5898.28 | 16′09′′ | 83,532 | 13′29′′ | |
| iSHS_4 | 148.75 | 149.55 | 150.22 | 0.59 | 5898.29 | 20′38′′ | 99,113 | 20′27′′ | |
| iSHS_5 | 148.93 | 149.49 | 149.94 | 0.45 | 5899.60 | 25′12′′ | 98,656 | 24′51′′ | |
| SHS | 153.03 | 153.66 | 154.36 | 0.60 | 5845.43 | 8′22′′ | 95,202 | 7′51′′ | |
| HSA | 153.45 | 153.74 | 154.83 | 0.26 | 5873.51 | 10′7′′ | 95,003 | 9′29′′ | |
- Note: The bold values indicate the best-performing results obtained from different algorithms for each factory type and each corresponding attribute.
Table 7 shows nonzero decision variable values and the total cost of the best solutions generated by different algorithms for the illustrative example. These values across different algorithms in the illustrative example show minimal variation, indicating that the algorithms produce highly consistent total cost results for this simplified scenario. Note that the differences in the values for electricity, heat, and cold energy discharged or sold are only marginal, further confirming the small-scale nature of the problem. The initial settings ensure sufficient energy availability due to precharged energy storage systems (ESS, HSS, and CSS), along with adequate purchases of electricity from the grid and natural gas. After meeting the load requirements for various devices, surplus energy is sold through the ETP. This leads to a negative total cost, indicating that the system not only meets its energy demands but also generates revenue.
| Algorithm | Eπ (1) (electricity sold to the ETP) | Eεψ (1) (electricity discharged from the ESS) | Hξψ (1) (heat energy discharged from the HSS) | Kωψ (1) (cold energy discharged from the CSS) | Hψυ (1) (heat energy sold by the ETP) | G (1) (natural gas consumption) | Total cost |
|---|---|---|---|---|---|---|---|
| iSHS_2 | 162,750,237 | 89,100,000 | 1,624,671,878 | 22,858,637 | 1,752,161,825 | 117,374,400 | −6.03139 |
| iSHS_3 | 162,750,240 | 89,100,000 | 1,624,764,295 | 21,979,081 | 1,752,254,242 | 117,374,400 | −6.03166 |
| iSHS_4 | 162,750,239 | 89,100,000 | 1,624,782,059 | 20,073,404 | 1,752,272,006 | 117,374,400 | −6.03171 |
| iSHS_5 | 162,750,210 | 89,100,000 | 1,624,743,655 | 21,135,686 | 1,752,233,602 | 117,374,400 | −6.03160 |
| SHS | 162,750,235 | 89,100,000 | 1,624,686,380 | 19,866,737 | 1,752,176,328 | 117,374,400 | −6.03143 |
| HSA | 162,750,193 | 89,100,000 | 1,624,427,891 | 21,902,908 | 1,751,917,838 | 117,374,400 | −6.03067 |
- Abbreviations: CSS, cold storage system; ETP, energy trading platform; HSS, heat storage system.
From Table 6, across both baseline and high-load factory scenarios, the iSHS algorithms consistently outperform the conventional SHS and HSA algorithms in terms of solution quality and stability. Among the iSHS algorithms, iSHS_4 achieves the best performance with the smallest best values of –37.84 for the baseline factory and 148.75 for the high-load factory. Meanwhile, iSHS_5 demonstrates the smallest average values (–37.35 for the baseline factory and 149.49 for the high-load factory) and the smallest worst values (–36.65 for the baseline factory and 149.94 for the high-load factory), showing its consistency across experiments. Additionally, iSHS_3 exhibits the least standard deviation in both scenarios (0.24 for the baseline factory and 0.45 for the high-load factory), indicating its reliable performance. In comparison, the SHS and HSA algorithms show competitive but generally inferior performance across all metrics, with larger average and worst values in both factory scales. These results confirm the robustness and adaptability of the proposed iSHS algorithms for optimizing energy allocation in factories of varying scales.
To address the carbon emissions associated with the experimental results, this study calculates the average carbon emissions for each algorithm in all three scenarios in Table 6 using the carbon emission factor for electricity consumption from the German grid in 2016 at 0.513 kgCO2eq/kWh [39] and that for natural gas at 0.370 kgCO2eq/kWh [40]. For energy traded through the ETP, this study assumes the same emission factor as the German grid at 0.513 due to a lack of specific carbon intensity data for ETP transactions. It is important to note that the proposed model seeks to minimize total costs, rather than directly minimizing carbon emissions. As such, the differences in carbon emissions among the algorithms are relatively minor and do not serve as a primary metric for evaluating algorithm performance. For instance, in the illustrative example, all algorithms yielded nearly identical average carbon emissions, with variations only occurring at a negligible scale. In the baseline and high-load factory scenarios, while there are slight differences in emissions, these are a by-product of the cost optimization process rather than an intentional reduction of emissions. This highlights a potential area for future research: incorporating carbon emission minimization into the model objective. Such an extension would provide a more comprehensive evaluation of algorithm performance in terms of environmental impact.
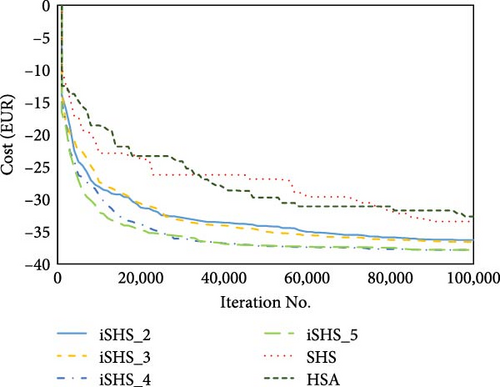
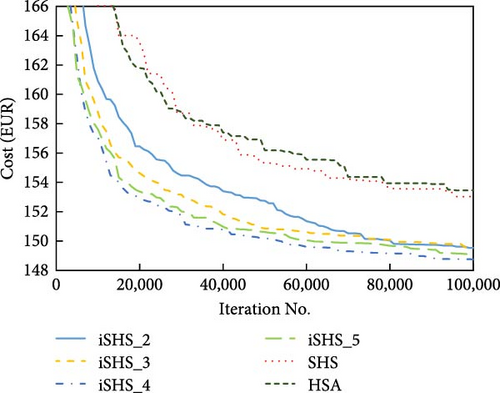
For execution time (Table 6), the SHS takes the least execution time, while the iSHS_5 is the most time-consuming. It is because the SHS simplifies the way of generating new solutions for HSA, while iSHSs generally require longer execution time due to their operations of multiple islands. The convergence analysis of different algorithms for both baseline factory and high-load factory scenarios is shown in Figure 7. From Figure 7, in general, all algorithms show good convergence results, in which all the iSHS algorithms show better converge performance than the legacy SHS and HSA.
5.3. Analyzing the Effects Before and After Implementation of the Proposed IES
From Table 6, the iSHS_4 achieves the best energy cost for 1 day, with €–37.84 for the baseline factory and €148.75 for the high-load factory. This implies that the baseline factory can gain a profit of €37.84 from its energy use and trading decisions. Furthermore, the hourly electricity input and output for both baseline factory and high-load factory scenarios for the best experimental results are shown in Figure 8. The overall electricity input consists of renewable energy, electricity purchased from the power grid, electricity generated by the GT, and electricity purchased from the ETP; while the electricity output is the electricity sold to the ETP. From Figure 8, the overall electricity input to the factory is generally greater than the electricity output, and the difference between them is the electricity load of the factory operation.
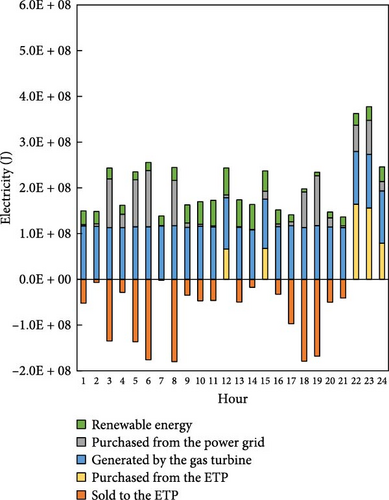
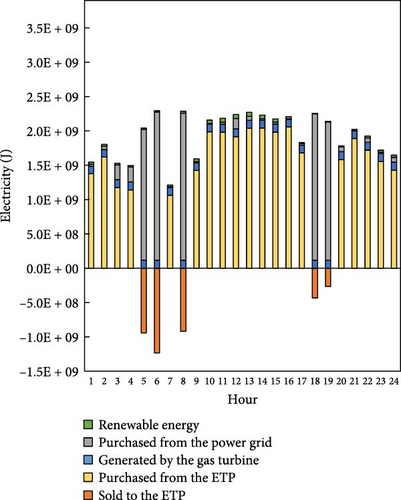
In Figure 8a (baseline factory), the electricity input is relatively smaller and shows higher reliance on REEs and energy trading. The GT and grid electricity inputs are less prominent due to the smaller scale of operations. In contrast, Figure 8b (high-load factory) depicts significantly higher electricity input, with a more substantial contribution from the GT and grid electricity. The higher input and output reflect the larger energy demands of the high-load factory. These differences emphasize the scalability of the proposed energy allocation model and its adaptability to factories of varying sizes.
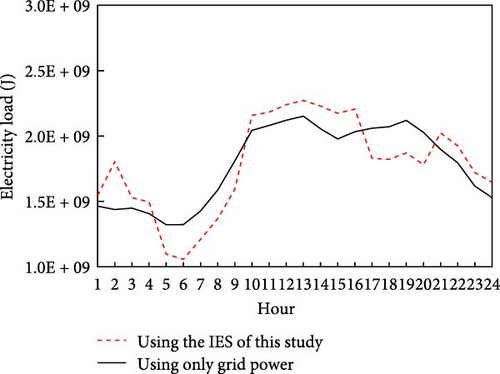
As depicted in Figure 9, the dotted curve represents the electricity load of the plant using only grid power (before implementation), and the solid curve represents the electricity load of the plant in the IES of this study (after implementation). For the baseline factory (Figure 9a), the total energy demand for 1 day before the implementation is 4.03423 × 10⁹ J, while the total energy consumption after the implementation is 3.41557 × 10⁹ J. The difference between the two reflects the reduction due to the proposed IES. Therefore, a total of 15.34% of the electricity load has been reduced and replaced by heat and cold energies from the IES, which are partly obtained from the GSHP and recycling of waste heat and cold from factory production, thus enhancing the factory’s overall energy utilization efficiency. For the high-load factory (Figure 9b), the total energy demand before the implementation is 4.28111 × 10¹⁰ J, and the total energy consumption after the implementation is 4.27795 × 10¹⁰ J. This results in a slight reduction in energy consumption after implementing the IES, which is a minimal decrease compared to the baseline factory. However, the high-load factory still benefits from a decrease in energy consumption by integrating heat and cold energy sources, similar to the baseline factory.

With the implementation of the proposed IES, the utilization of green energy can be evaluated across different factory scales. Table 8 presents the energy consumption and the corresponding green energy percentages for baseline and high-load factories. For the baseline factory, the total energy consumption is 5.70988 × 10⁹ J. Electricity accounts for 38% of the total load, with 7.26696 × 10⁸ J provided by REEs, representing 21% of the electricity load. Heat and cold energy account for 12% and 50% of the total load, respectively, with green energy contributions of 70% and 60%. Overall, 39% of the baseline factory’s energy consumption is met by green energy, indicating a moderate reliance on renewable sources. In contrast, the high-load factory exhibits a significant increase in total energy consumption, reaching 4.50500 × 10¹⁰ J, nearly eight times higher than the baseline factory. The electricity load is the primary driver of this increase, accounting for 88% of the overall energy consumption. Despite the green energy contribution from REE remaining constant at 7.26696 × 10⁸ J, its share of the electricity load decreases dramatically to just 2%, highlighting the challenges of scaling renewable energy supply in larger operations. Heat and cold energy loads remain constant in absolute terms, at 1.05056 × 10⁹ J and 1.24375 × 10⁹ J, respectively, contributing 12% and 50% to the total energy consumption. The green energy contributions to these loads are consistent at 70% for heat and 60% for cold energy, demonstrating the stability of these contributions regardless of factory size. Overall, while the green energy contribution for heat and cold energy remains consistent between the two factory scales, the sharp increase in electricity demand for the high-load factory leads to a notable decrease in the overall green energy share, dropping from 39% in the baseline factory to only 9% in the high-load factory. This disparity underscores the importance of expanding renewable energy capacity, particularly for electricity generation, to accommodate the increased energy demands of larger facilities.
| Factory size | Measure | Electricity (J) | Heat energy (J) | Cold energy (J) | Total (J) |
|---|---|---|---|---|---|
| Baseline | Total load (Percentage) | 3.41557 × 10⁹ (38%) | 1.05056 × 10⁹ (12%) | 1.24375 × 10⁹ (50%) | 5.70988 × 10⁹ (100%) |
| From green energy source (Percentage) | 7.26696 × 10⁸ (21%) | 7.31784 × 10⁸ (70%) | 7.45216 × 10⁸ (60%) | 2.20370 × 10⁹ (39%) | |
| From other energy source (Percentage) | 2.68887 × 10⁹ (79%) | 3.18778 × 10⁸ (30%) | 4.98534 × 10⁸ (40%) | 3.50618 × 10⁹ (61%) | |
| High load | Total load (Percentage) | 3.95212 × 10¹⁰ (88%) | 1.05052 × 10⁹ (12%) | 1.24375 × 10⁹ (50%) | 4.50500 × 10⁹ (100%) |
| From green energy source (Percentage) | 7.26696 × 10⁸ (2%) | 7.31784 × 10⁸ (70%) | 7.45216 × 10⁸ (60%) | 4.14176 × 10⁹ (9%) | |
| From other energy source (Percentage) | 7.26696 × 10¹⁰ (98%) | 3.18778 × 10⁸ (30%) | 4.98534 × 10⁸ (40%) | 4.09082 × 10⁹ (91%) | |
6. Conclusion
This study has investigated the optimal energy allocation problem of the IoE-based IES for smart factories with a GSHP and a multienergy ETP and proposed the iSHS algorithm to more efficiently solve the problem. In the experiments, the proposed iSHS algorithm outperforms both the SHS and HSA. In addition, the proposed IES is significant in improving the energy utilization efficiency and the utilization of green energy in smart factories. For the baseline factory, the proposed IES achieves 39% of total energy consumption from green energy sources and reduces the electricity load by 15.34%, replacing it with heat and cold energy from renewable sources like the GSHP and recycled energy. For the high-load factory, the IES still integrates green energy, though the overall share decreases to 9% due to the sharp increase in electricity demand. Through the proposed system, the smart factory can significantly lower carbon emissions and support the goal of green transformation, with scalable adaptability to factories of varying energy demands.
In the future, the applicability of the framework and methodology can be further enhanced by acquiring energy usage data from real factories. The introduction of real factory data will facilitate a more comprehensive evaluation of the proposed system architecture across diverse factory settings. Additionally, future studies could explore the integration of carbon trading mechanisms into the proposed IES to amplify its effectiveness in facilitating green transformation in factories. Furthermore, the energy flow model can be refined by categorizing energy sources and consumption purposes, thereby optimizing energy allocation and usage. This approach would enable a more detailed and realistic analysis of energy dynamics within factory settings. It is anticipated that ongoing research and practical implementation will refine and advance the capabilities of the IES, ultimately fostering more efficient energy management, carbon reduction, and sustainable production practices in factories. Additionally, the integration of carbon trading mechanisms into the proposed IES framework could further enhance its applicability and benefits. Carbon trading would incentivize factories to adopt greener energy strategies by providing financial rewards for reducing carbon emissions. This would not only strengthen the economic rationale of the framework but also align it with global carbon neutrality goals, enabling a more comprehensive evaluation of its impact on sustainable manufacturing practices.
Conflicts of Interest
The authors declare no conflicts of interest.
Funding
This study was financially supported in part by the National Science and Technology Council, Taiwan under Grants NSTC 112-2221-E-A49-116-MY3 and NSTC 113-2221-E-A49-141; and Taiwan Semiconductor Research Institute (TSRI).
Open Research
Data Availability Statement
Research data are not shared.


