Integrated Multiobjective Energy Management for a Smart Microgrid Incorporating Electric Vehicle Charging Stations and Demand Response Programs Under Uncertainty
Abstract
This paper presents an innovative 24-h scenario–based microgrid energy management system (MG-EMS) designed to achieve cost reduction and emission reduction under conditions of uncertainty. Furthermore, a multiobjective hybrid heuristic algorithm, named hybrid multiobjective particle swarm optimization and lightning search algorithm (hMOPSO-LSA), is introduced to tackle the MG-EMS problem. This algorithm combines the LSA and the MOPSO algorithm. The MG under investigation comprises photovoltaic (PV) and wind turbine (WT) units, a combined heat and power (CHP) system, and employs multicarrier energy storage technology, specifically, power-to-gas (P2G) technology and an electric vehicle (EV) parking lot (PL). Flexible loads are incorporated into the MG to enhance cost and emission reduction through participation in the demand response program (DRP). The proposed MG-EMS model utilizes probability density functions (PDFs) for modeling uncertainties and employs the Roulette wheel (RW) method for scenario selection. The simulations, carried out in MATLAB, encompass two different sections. In the first part, the accuracy and efficiency of the proposed algorithm were validated by solving the standard DTLZ benchmark functions and comparing the optimization results with those of several other optimization algorithms. In the second part, energy management in the MG was carried out using the proposed MG-EMS model, solved by the hMOPSO-LSA algorithm, both without flexible loads and with their inclusion. To provide a comprehensive evaluation, the problem was solved using the proposed hMOPSO-LSA algorithm and compared against three benchmark algorithms: multiobjective flower pollination algorithm (MOFPA), MOPSO, and multiobjective dragonfly algorithm (MODA). The optimization results demonstrate that hMOPSO-LSA achieves higher accuracy compared to other algorithms. Furthermore, the findings indicate that the participation of flexible loads in the DRP results in a 6.43% cost reduction and an 8.21% reduction in emissions. Additionally, P2G technology proves effective in cost and emission reduction, contributing 6.87% of the required gas supply within the MG.
1. Introduction
In today’s world, the utilization of conventional energy systems appears impractical, primarily due to the dwindling fossil fuel resources and the exorbitant expenses associated with energy production and distribution techniques. Consequently, it becomes imperative to focus on versatile energy frameworks like the microgrid (MG) as a solution to these challenges [1, 2]. MG stands as a fundamental concept facilitating the harmonious operation of diverse energy infrastructure networks [3]. Battery storage has been a conventional means of energy storage in MGs. In recent years, energy management in MGs has gained significant attention, particularly with the integration of flexible loads and demand response programs (DRPs) under uncertain conditions. Holistic approaches that combine electric vehicle (EV) capacity in parking lots (PLs), demand response, and renewable energy sources provide comprehensive solutions for smart MGs [4, 5]. Another innovation in recent years is the introduction of power-to-gas (P2G) technology, which involves using electrical energy to produce and store gas for future use in electricity or heat generation [6]. The efficient operation of MG can yield a host of advantages encompassing technical enhancements, economic viability, and environmental conservation. This translates to heightened system dependability, diminished operational expenditures, lowered fuel consumption, and a reduction in greenhouse gas emissions [7]. Also, DRPs play a crucial role in balancing the grid, reducing peak loads, and improving the overall energy utilization. Studies have demonstrated the practical feasibility and benefits of integrated energy management systems (EMSs) through detailed simulations and real-world case studies. These systems not only contribute to sustainability by incorporating renewable energy but also optimize energy use to develop more efficient smart MGs. Numerous approaches have been suggested for the MG-EMSs [8–10].
In the realm of MG energy management, several studies have explored the application of traditional methods such as linear programming (LP) [11], non-LP (NLP) [12], mixed-integer LP (MILP) [13], and dynamic programming [14]. LP and NLP techniques have been employed to optimize various aspects of MG operation, including economic dispatch and resource allocation. MILP approaches have been utilized to address discrete decision variables and constraints in MG optimization, offering a more accurate representation of real-world scenarios [15]. Dynamic programming has been employed to tackle dynamic and stochastic aspects of MG operation, allowing for adaptive decision-making in response to changing conditions. These diverse traditional methodologies contribute to the comprehensive exploration of energy management strategies within MG systems, each offering unique advantages and insights [16]. However, the main drawback of traditional methods is their limited ability to handle the complex nonlinear and dynamic characteristics of modern MG [17]. Therefore, in recent research on MG energy management, a plethora of studies have delved into the application of metaheuristic algorithms to address the complexities of optimization problems. These algorithms, including genetic algorithm (GA) [18], particle swarm optimization (PSO) [19], artificial bee colony (ABC) [20], simulated annealing (SA) [21], differential evolution (DE) [22], gray wolf optimization (GWO) [23], and harmony search (HS) [24], have been harnessed to optimize various facets of MG operation.
In recent literature pertaining to MG energy management, there has been a growing emphasis on addressing the inherent uncertainties and incorporating DRP into the optimization process [25]. Utilizing dynamic pricing and incentive plans within MGs encourages responsible energy consumption [26]. However, while DRPs offer benefits for MGs and consumers, they introduce complexities into MG-EMSs [27]. In [28], optimal planning for an MG with photovoltaic (PV) and compressed air storage aims to reduce operating costs via a market risk–based DRP. Raghav et al. [29] presents a DRP considering energy sources, network constraints, and consumer welfare to minimize costs without compromising comfort, achieving up to a 5% reduction. Shokouhandeh et al. [30] implements a DRP in an MG with energy storage to achieve peak load reduction and lower operational costs, also promoting user participation in MG planning through incentives. Energy generation and demand estimation in MGs face challenges due to predictive errors, primarily driven by uncertainties, with changing weather conditions being a significant source of variation. Residential loads, including heating, cooling, and ventilation systems, are closely linked to weather conditions, making meteorological data essential for accurate load forecasting. Some studies address load uncertainty using probability density functions (PDFs) [31], while others propose scenario-based approaches prioritizing different stochastic scenarios [32]. Robust optimization techniques are critical in addressing the uncertainties in energy supply and demand, thereby, enhancing system resilience and efficiency [33]. These approaches collectively enhance MG-EMS resilience to uncertainty and improve load management.
- •
A novel 24-h scenario–based MG-EMS model is introduced to reduce costs and emissions in the presence of uncertainties.
- •
The paper addresses a gap in the literature by exploring multicarrier energy storage technologies, such as P2G, and the use of EV PLs for storage.
- •
The participation of flexible loads in the DRP and the effectiveness of P2G technology are highlighted, showing significant reductions in both costs and emissions.
- •
The proposed optimization method is a hMOPSO-LSA.
The subsequent sections of this paper are structured as follows: The second section provides an introduction to the understudy MG. The third part delineates the problem formulation. In this section, MG uncertainties model is explained, then, objective functions and constraints are introduced. The fourth section introduces the hMOPSO-LSA algorithm proposed for addressing this optimization problem. The fifth section offers an analysis of the numerical results derived from the simulations. Last, the article concludes in the sixth section, summarizing the main findings and proposing avenues for future research.
2. The Understudy MG Scheme
MG is a system that combines energy production and storage sources, along with energy transmission and communication infrastructure, to achieve various objectives such as cost reduction, improved reliability, and reduced emissions. Figure 1 provides an example of an MG configuration, featuring PV panels, WTs, CHP units, and an EV PL used for energy storage. The MG utilizes P2G technology to convert electrical energy into gas, which can be utilized in the CHP unit. In fact, PL and P2G are methods of electric energy storage in the MG.
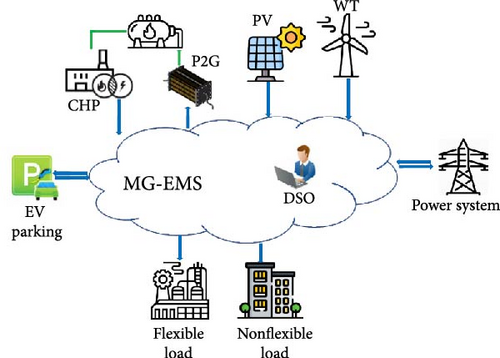
The P2G is a process that involves converting electrical energy into a gaseous form, such as hydrogen or methane, for storage and later use. This technology plays a crucial role in the integration of renewable energy sources into the grid by addressing the intermittent nature of renewable power generation. P2G allows excess electricity generated during low-demand periods to be converted into gas, which can be stored and utilized during high-demand periods or when renewable energy generation is limited. The process typically involves the electrolysis of water, splitting it into hydrogen and oxygen, with the hydrogen then being stored or utilized in various applications such as fuel cells, heating, or power generation. P2G technology offers a versatile and sustainable solution for energy storage, grid balancing, and reducing the reliance on fossil fuels [34].
3. Problem Formulation
This article delves into the utilization of resources and storage devices within a MG context, particularly in the presence of uncertainty, casting it as a stochastic biobjective optimization challenge. The primary objective aims to curtail operational costs, while the secondary objective targets the mitigation of environmental pollution stemming from energy supply in the MG. Within this section, the paper elucidates the modeling of MG components under conditions of uncertainty, introduces the RW method for scenario generation, outlines the proposed objective functions, and delineates the constraints inherent to MG operation.
3.1. The MG Uncertainties Model
MG-EMS studies and research endeavors necessitate a comprehensive exploration of various sources of uncertainty. The issue of uncertainty looms large, exerting a notable impact on the reliability, control, and operation of MGs, primarily attributed to their proclivity for decentralization and the frequent fluctuations in both load and production. This uncertainty is chiefly manifest in the absence of precise information pertaining to parameter values, system components, and measurement accuracy. Fluctuations in parameter values, unanticipated system dynamics, and unreliable measurements emerge as primary drivers of uncertainty within MGs.
By employing these specific PDFs, the model achieves greater robustness and reliability under uncertain conditions, thus, optimizing energy management strategies and reducing the risks associated with uncertainties.
3.2. RW Mechanism
- 1.
Fitness evaluation: Evaluate the fitness of each individual in the population based on a fitness function. The fitness function quantifies the quality or suitability of each individual solution in the population.
- 2.
Fitness scaling: Scale the fitness values to ensure that they are positive and proportional to the selection probabilities. This step is necessary to create a probability distribution for the selection process.
- 3.
Calculate selection probabilities: Divide each individual’s scaled fitness value by the sum of all scaled fitness values to obtain the selection probabilities. This step normalizes the fitness values to create a probability distribution where the probabilities sum up to 1.
- 4.
RW selection: Generate a random value between 0 and 1. Iterate through the individuals in the population and accumulate their selection probabilities. Select the individual whose accumulated probability exceeds the randomly generated value. This selection process is analogous to spinning a RW, where the selection probabilities determine the size of each individual’s slice on the wheel.
- 5.
Repeat: Repeat Steps 4 and 5 until the desired number of individuals is selected to form the next generation.
The RW method ensures that individuals with higher fitness values have a higher probability of being selected, while still allowing some chance for individuals with lower fitness values to be chosen.
3.3. Objective Function
3.4. Operation Constraints
The primary operational constraints for the MG are outlined as follows:
3.4.1. Power Balance
3.4.2. National Grid Constraint
3.4.3. CHP Constraint
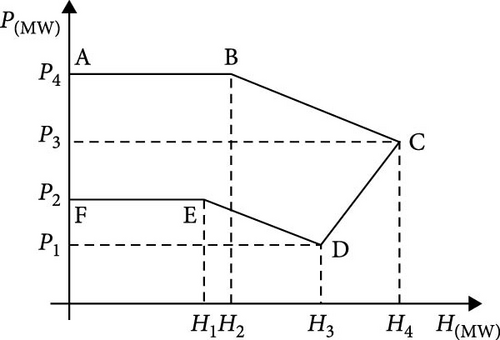
The capacity curve for the CHP unit is illustrated in Figure 2 [39].
3.4.4. PL Constraints
4. The Optimization Algorithms
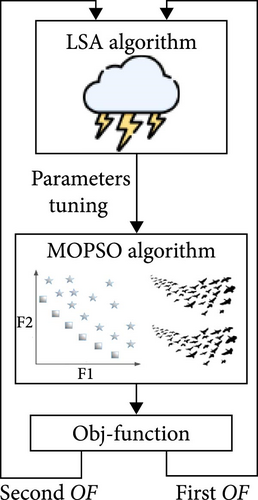
In the hMOPSO-LSA algorithm, careful consideration is given to the selection of parameters, specifically, the coefficients C1 and C2 and inertia weight (ω) of the MOPSO component. These parameters play a crucial role in balancing exploration and exploitation during the optimization process. The LSA is employed to optimally determine these parameters. In each iteration of the LSA, the parameters are dynamically adjusted based on the search performance, which allows for an adaptive approach to parameter tuning. This method not only enhances the convergence speed of the MOPSO but also ensures that the algorithm maintains a diverse set of solutions throughout the optimization process. LSA’s robust exploration capabilities help in identifying parameter values that minimize the chances of the algorithm getting trapped in local optima. The computational complexity of the hMOPSO-LSA algorithm primarily arises from the iterative nature of both the LSA and MOPSO algorithms. The overall complexity can be influenced by several factors, including the size of the population, the number of iterations, and the dimensionality of the optimization problem. In practical implementations, the algorithm’s efficiency is validated through extensive benchmark testing, ensuring that it performs optimally with respect to both accuracy and computational resource requirements. The results demonstrate that the proposed hMOPSO-LSA algorithm effectively balances exploration and exploitation, while maintaining computational feasibility, making it suitable for complex optimization scenarios in MG energy management. Figure 3 illustrates an overview of the hMOPSO-LSA.
The integration of the LSA and MOPSO in the hMOPSO-LSA algorithm leverages the complementary strengths of both methods. LSA, inspired by the natural process of lightning, excels in global search and maintaining diversity by mimicking the unpredictable behavior of lightning, which helps avoid local optima. MOPSO, known for its effective global exploration, is simple to implement and has proven effectiveness in multiobjective problems. Combining MOPSO’s global search with LSA’s diverse exploration capabilities creates a balanced optimization approach that enhances convergence towards the Pareto front while maintaining solution diversity. This integration is justified by their performance on benchmark functions and the complementary nature of their strengths in exploration and exploitation.
4.1. MOPSO Algorithm
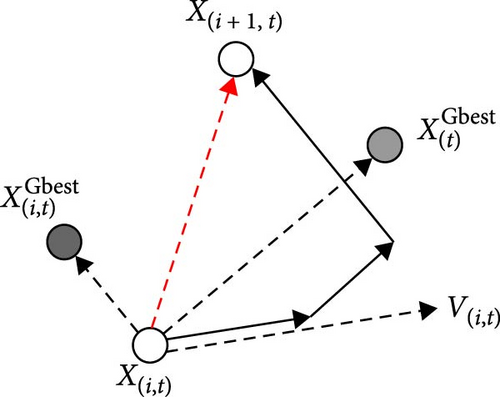
In this context, xgbest and represent the most favorable collective and individual memories, while ω denotes the weight coefficient. Also, rand1 and rand2 are random numbers drawn from a uniform distribution, and C1 and C2 denote the personal and collective learning coefficients, respectively. Additionally, in each iteration, a solution denoted as Repk (t) is chosen from the repository. Figure 4 visually illustrates the updated adjustments in velocity and position for each particle at the conclusion of every iteration.
- 1.
If xk (t + 1) dominates (Ite), then (Ite + 1) = xk (Ite + 1).
- 2.
If the current (Ite) dominates xk (Ite + 1), then (Ite + 1) = (Ite).
- 3.
If no domination occurs between them, a random selection is made to determine which one becomes (Ite + 1).
This process is repeated until the best solution is achieved.
4.2. LSA Algorithm
4.3. hMOPSO-LSA Algorithm
The effectiveness of all optimization algorithms relies heavily on their parameter settings. Incorrectly chosen algorithm parameters can lead to issues such as nonconvergence or being stuck in local optima. In this paper, to address this challenge, it is proposed that the parameters of the MOPSO algorithm be optimally selected using the LSA algorithm. The pseudocode for the proposed hMOPSO-LSA is provided in Table 1.
|
The proposed optimization algorithm stands out for its remarkable accuracy and ability to avoid getting stuck in local optima. The validity of this claim has been substantiated through extensive optimization experiments on standard benchmark problems, where it was compared with other optimization algorithms.
5. Simulation Results and Discussion
The simulations results analysis was conducted in two parts. In the first part, the performance of the proposed hMOPSO-LSA optimization algorithm was evaluated by solving standard benchmark functions and comparing its results with those of other multiobjective optimization algorithms. In the second part, the performance of the proposed EMS was assessed. To ensure a more precise assessment of the results, the problem is resolved using the multiobjective flower pollination algorithm (MOFPA) [42], the MOPSO [43], and the multiobjective dragonfly algorithm (MODA) [44], and also the proposed the hMOPSO-LSA algorithm with subsequent comparison of the results.
5.1. The hMOPSO-LSA Performance Analysis
To assess the optimization performance of the proposed hMOPSO-LSA algorithm, standard ZDT benchmark functions were employed. The Spread (SD) and inverted generational distance (IGD) metrics were calculated to evaluate the quality of the obtained Pareto optimal solutions and are presented in Tables 2 and 3. For comparative analysis, the results of decomposition-based multiobjective symbiotic organism search (MOSOS/D) [45], nondominated sorting GAs (NSGA-II) [46], multiobjective equilibrium optimizer (MOEO) [47], and multiobjective marine predator algorithm (MOMPA) [48] are also accumulated in Tables 2 and 3. This table presents the problem name, number of objectives (M), number of dimensions (D), and calculated values (along with standard deviations in parentheses) for each algorithm.
| Problem | M | D | NSGA-II | MOEO | MOMPA | MOSOS/D | hMOPSO-LSA |
|---|---|---|---|---|---|---|---|
| DTLZ1 | 2 | 6 | 0.1427 (0.203) | 3.222 (1.21) | 0.6174 (0.377) | 0.096 (0.176) | 0.037 (0.096) |
| 3 | 7 | 0.1485 (0.137) | 0.6336 (0.364) | 0.5488 (0.181) | 0.195 (0.117) | 0.174 (0.109) | |
| DTLZ2 | 2 | 11 | 0.0051 (0.0002) | 0.0048 (0.0004) | 0.0072 (0.0011) | 0.0043 (0) | 0.0045 (0.0004) |
| 3 | 12 | 0.075 (0.0028) | 0.0558 (0.0003) | 0.0562 (0.0007) | 0.0574 (0.0014) | 0.0548 (0.0013) | |
| DTLZ3 | 2 | 11 | 6.2989 (2.41) | 76.411 (18.3) | 20.616 (4.62) | 6.2641 (2.81) | 3.418 (1.94) |
| 3 | 12 | 6.5758 (3.22) | 24.566 (11.6) | 16.35 (7.79) | 8.2526 (9.2) | 6.582 (6.3) | |
| DTLZ4 | 2 | 11 | 0.0051 (0.0002) | 0.0053 (0.0003) | 0.0084 (0.0009) | 0.0044 (0.0001) | 0.0046 (0.0002) |
| 3 | 12 | 0.2912 (0.437) | 0.1813 (0.25) | 0.0563 (0.001) | 0.2996 (0.279) | 0.2148 (0.209) | |
| DTLZ5 | 2 | 11 | 0.0051 (0.0001) | 0.005 (0.0004) | 0.0079 (0.0006) | 0.0043 (0.0001) | 0.0047 (0.0003) |
| 3 | 12 | 0.0066 (0.0004) | 0.017 (0.0042) | 0.1028 (0.0133) | 0.0053 (0.0002) | 0.0054 (0.0004) | |
| DTLZ6 | 2 | 11 | 0.0057 (0.0003) | 0.5196 (0.334) | 0.0053 (0.0006) | 0.0041 (0) | 0.0038 (0.0001) |
| 3 | 12 | 0.0067 (0.0003) | 0.0242 (0.0065) | 0.096 (0.0139) | 0.0045 (0) | 0.0041 (0.0002) | |
| DTLZ7 | 2 | 21 | 0.0075 (0.0003) | 0.1624 (0.075) | 0.1295 (0.0074) | 0.0075 (0.0005) | 0.0063 (0.0003) |
| 3 | 22 | 0.0904 (0.0028) | 0.1882 (0.133) | 0.1876 (0.0299) | 0.0754 (0.0043) | 0.0719 (0.004) | |
- Abbreviations: D, number of dimensions; hMOPSO, hybrid multiobjective particle swarm optimization; IGD, inverted generational distance; LSA, lightning search algorithm; M, number of objectives; MOEO, multiobjective equilibrium optimizer; MOMPA, multiobjective marine predator algorithm; MOSOS/D, decomposition-based multiobjective symbiotic organism search; NSGA-II, nondominated sorting genetic algorithms.
| Problem | M | D | NSGA-II | MOEO | MOMPA | MOSOS/D | hMOPSO-LSA |
|---|---|---|---|---|---|---|---|
| DTLZ1 | 2 | 6 | 0.0384 (0.041) | 0.449 (0.3) | 4.8462 (9.16) | 0.0039 (0.0016) | 0.0034 (0.0012) |
| 3 | 7 | 0.04 (0.0204) | 1.5444 (2.49) | 0.2086 (0.0838) | 0.0659 (0.0586) | 0.0632 (0.0316) | |
| DTLZ2 | 2 | 11 | 0.0074 (0.0005) | 0.0064 (0.0003) | 0.0066 (0.0016) | 0.0034 (0.0004) | 0.0036 (0.0005) |
| 3 | 12 | 0.0582 (0.0061) | 0.0544 (0.0011) | 0.0551 (0.0022) | 0.0254 (0.0022) | 0.0201(0.0016) | |
| DTLZ3 | 2 | 11 | 0.9228 (0.616) | 17.692 (14) | 5.8167 (6.11) | 0.7815 (0.645) | 0.6418 (0.326) |
| 3 | 12 | 0.929 (0.37) | 43.042 (59.4) | 3.9219 (1.71) | 0.8357 (0.947) | 0.8357 (0.947) | |
| DTLZ4 | 2 | 11 | 0.0068 (0.0002) | 0.0065 (0.001) | 0.0097 (0.002) | 0.0037 (0.0006) | 0.0039 (0.0008) |
| 3 | 12 | 0.0484 (0.0323) | 0.0557 (0.0023) | 0.0548 (0.0015) | 0.0146 (0.0123) | 0.0118 (0.0108) | |
| DTLZ5 | 2 | 11 | 0.0065 (0.0004) | 0.0063 (0.0005) | 0.0078 (0.0013) | 0.0033 (0.0003) | 0.0031 (0.0004) |
| 3 | 12 | 0.0112 (0.001) | 0.0208 (0.0031) | 0.1295 (0.0636) | 0.0057 (0.001) | 0.0048 (0.001) | |
| DTLZ6 | 2 | 11 | 0.0095 (0.0005) | 0.1448 (0.081) | 0.008 (0.0008) | 0.0034 (0.0003) | 0.0006 (0.0002) |
| 3 | 12 | 0.0122 (0.0009) | 0.0412 (0.0169) | 0.2274 (0.135) | 0.0052 (0.0003) | 0.0031 (0.0001) | |
| DTLZ7 | 2 | 21 | 0.0068 (0.001) | 0.0367 (0.0061) | 0.0455 (0.0065) | 0.0049 (0.0003) | 0.0052 (0.0004) |
| 3 | 22 | 0.0714 (0.0064) | 0.1061 (0.0401) | 0.1321 (0.01) | 0.0393 (0.0009) | 0.0311 (0.0006) | |
- Abbreviations: D, number of dimensions; hMOPSO, hybrid multiobjective particle swarm optimization; LSA, lightning search algorithm; M, number of objectives; MOEO, multiobjective equilibrium optimizer; MOMPA, multiobjective marine predator algorithm; MOSOS/D, decomposition-based multiobjective symbiotic organism search; NSGA-II, nondominated sorting genetic algorithms.
Lower IGD and SP index values indicate superior performance and a well-distributed Pareto front. As Tables 2 and 3 demonstrate the proposed hMOPSO-LSA algorithm consistently achieves the lowest IGD and SP values across most DTLZ problems, confirming its superior performance and accuracy.
5.2. The Understudy MG
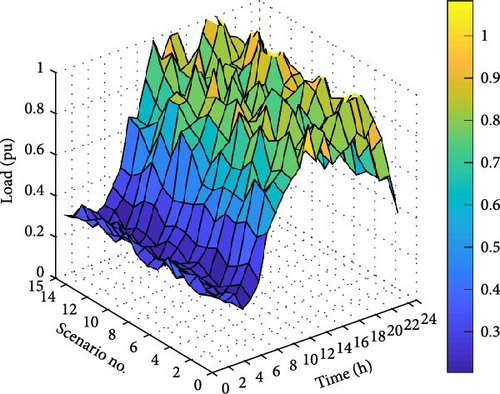
For this paper simulations, a MG incorporating PV, WT systems, CHP unit, EV PL, and P2G storage technology is selected. To optimize the MG energy, the RW is employed to generate 15 unique scenarios based on PDFs for electrical as well as wind and solar radiation intensity. The 24-h electrical load for these scenarios is depicted in Figure 5.
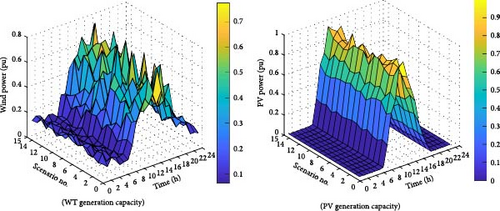
The wind speed in the studied area follows a Weibull PDF with a scaling factor (c) of 5.4 and a shape factor (k) of 1.9. Also, generation capacity of the PV system in different scenarios is determined using the beta PDF with α = 2.1 and β = 5.3. Based on these PDFs, the production power of the WT and PV array for the selected scenarios, as illustrated in Figure 6.
The arrival of EVs to the PL follows a Weibull PDF with a c = 9.2 and k = 3.1. On the other hand, the departure of EVs from the PL is modeled using a lognormal PDF with μ = 2.4 and σ = 0.4. Based on these PDFs, the amount of arrival and departure of EVs to the PLs is depicted in Figure 7.
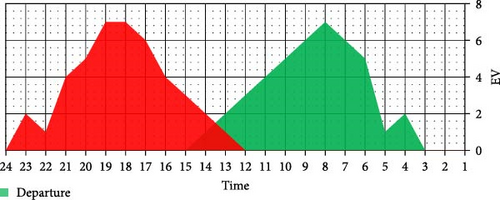
Figure 8 illustrates the hourly electricity prices. The cost of electrical energy within the MG is determined based on a time-of-use (TOU) pricing model.

The simulations are conducted into two different sections. In the first part, the focus is on considering uncertainties in the energy management of the MG, while neglecting the responsible loads within the MG. In the second part, the MG’s energy management is conducted by incorporating a DRP under uncertain conditions. In the subsequent part of this section, a detailed explanation is provided for the results obtained from the optimizations conducted in two different sections.
5.2.1. First Section Results (Without Flexible Load)
In the first part of the simulation results analysis, the energy management of the MG is performed without considering flexible loads. The uncertainties related to electrical loads, as well as uncertainties in renewable energy sources, are taken into account for the scheduling of the MG. Figure 9 presents the Pareto front obtained in this phase of the simulation. The proposed hMOPSO-LSA algorithm achieves a minimum operational cost of approximately 2205 (€/day) and a minimum emission level of 113.2 (kg/day). The MG operation cost and emission for the MOFPA, MOPSO, and MODA are 2208 (€/day)−113.4 (kg/day), 2210 (€/day)−114.6 (kg/day), and 2212 (€/day) −115.9 (kg/day), respectively.
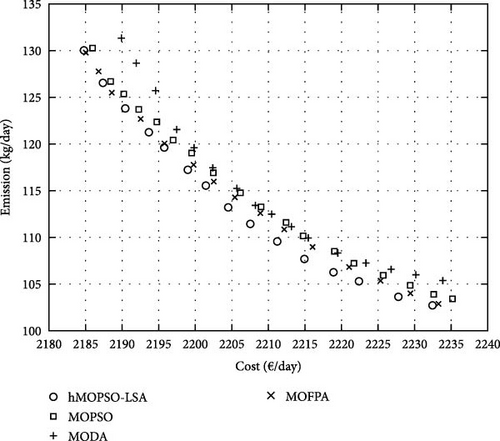
Compared to the MODA algorithm, the proposed hMOPSO-LSA achieved a €7/day reduction in costs and 2.7 kg/day decrease in emissions. While these differences may seem modest in the short term, their cumulative impact over time becomes significant. Moreover, the hMOPSO-LSA energy management program led to approximately 37% cost savings and a 43% reduction in pollution compared to the nonoptimized scenario. To assess the efficiency of the optimization algorithms more precisely, computations are carried out for Spacing and NOS criteria. The Spacing index gauges the relative separation between consecutive outcomes. Lower Spacing criterion values correspond to superior algorithm performance. Conversely, higher NOS values indicate better algorithm performance. The NOS index represents the count of pareto solutions. Figure 10 features a visualization of the NOS and Spacing criteria for the algorithms.

Figure 11 displays the power generated by the generation units when the optimization problem is solved using the proposed hMOPSO-LSA algorithm.
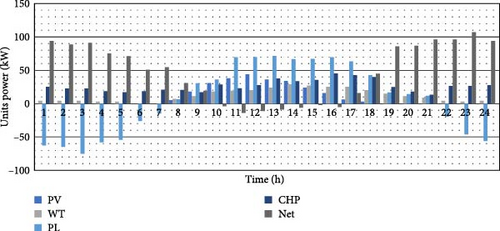
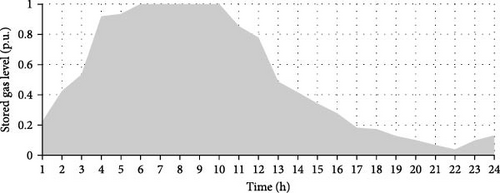
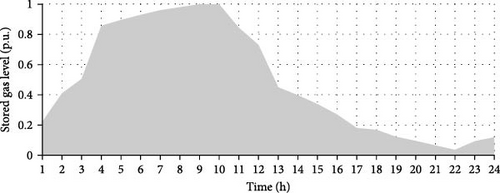
During the early hours, when the price of electric energy is low, the MG takes advantage of this by purchasing electricity from the national grid to charge the EVs parked in the PL. However, the uncertainty associated with the EVs introduces changes in the charging and discharging planning, which can lead to an increase in operating costs and emissions. This uncertainty could be due to factors such as unpredictable EV charging patterns or variations in the availability of renewable energy sources. Figure 12 displays the stored gas level in the P2G unit. In this section, approximately 7.04% of the required gas in the MG is supplied by the P2G unit. This indicates that the P2G unit plays a role in meeting the gas demand of the MG, albeit a relatively small one.
5.2.2. Second Section Results (Considering Flexible Load)
In the second part of the simulation, the energy management of the MG is carried out by incorporating flexible load. The utilization of flexible loads assists in reducing the operational costs and emissions of the MG by optimizing energy consumption during specific hours. Figure 13 illustrates the Pareto front obtained through the implementation of optimization algorithms.
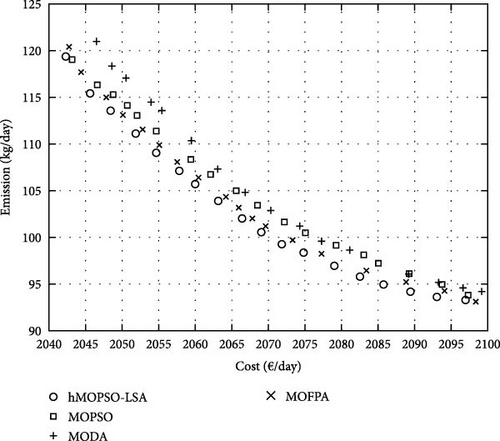
In this section, the hMOPSO-LSA algorithm proposed in the study achieves a minimum operational cost of 2063 (€/day) and a minimum emission level of 103.9 (kg/day). In comparison, the MG operation cost and emission values for the MOFPA algorithm are 2070 (€/day) and 105.5 (kg/day), for the MOPSO algorithm are 2071 (€/day) and 107.3 (kg/day), and for the MODA algorithm are 2078 (€/day) and 106.7 (kg/day), respectively. The results of the simulation in this section indicate that the integration of flexible loads into the DRP has resulted in a significant reduction in both operational costs and emissions, even in the presence of uncertainties. The operating costs of the MG with flexible loads have decreased by 6.43%, and the amount of pollution has decreased by 8.21% compared to conditions without flexible loads. Despite the requirement to provide rewards to the flexible loads, the decrease in electricity consumption during peak hours, coupled with the high cost of electricity, has led to a noticeable decrease in operational costs and emissions. Furthermore, the optimization results continue to support the superior accuracy of the proposed hMOPSO-LSA algorithm when compared to other multiobjective algorithms, as observed in previous sections. The Spacing and NOS criteria is calculated for the second part of optimization results and the results are shown in Figure 14. In this section, higher values of the Spacing index indicate a wider distribution of the obtained results.

Figure 15 illustrates the electric power generation in the MG for the proposed hMOPSO-LSA algorithm.
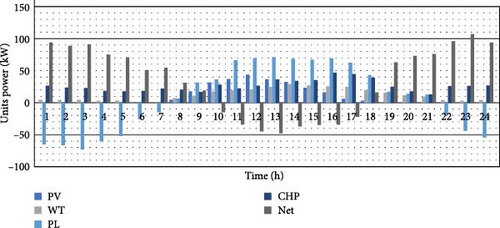
Figure 16 illustrates a decrease in electric power consumption resulting from the inclusion of flexible loads. Specifically, the electric power demand in the MG has decreased between 10 and 15 h. As a result, the operational costs and emissions for these hours have also been reduced. In Figure 16, the generation capacity of the P2G unit for the MG with flexible loads under uncertain conditions is shown. In this part of the simulation, the P2G unit accounts for approximately 6.87% of the gas used in the MG. Due to the reduction in consumption from the removal of flexible loads, the amount of required gas has also decreased.
6. Conclusion and Future Work
This paper introduces a stochastic MG-EMS aimed at reducing operational costs and emissions. The MG consists of renewable electrical sources, an EV PL for energy storage, CHP, and P2G systems. Some electrical consumers are considered flexible loads, and a DRP is employed for MG energy management. Uncertainties in electrical load, renewable sources’ generating capacity, and EVs are modeled using PDFs, and scenario selections are performed using RW. The MG-EMS is formulated as an optimization problem, and two innovative objective functions are proposed. To solve this problem, a multiobjective hybrid heuristic algorithm called hMOPSO-LSA is presented. Simulations are conducted in two different scenarios of without flexible load and considering flexible load. The optimization results of the proposed algorithm are compared with those of MOPSO, MODA, and MOFPA algorithms by calculating Spacing and NOS criteria. The optimization results in two sections demonstrate that the proposed algorithm outperforms other multiobjective algorithms. Furthermore, when flexible loads actively participate in the DRP, it was observed that costs decreased by 6.43% and emissions decreased by 8.21%. Additionally, the results highlighted the importance of energy storage during periods of low energy prices to minimize costs. The P2G technology proved to be effective in cost reduction by converting electricity to gas during hours of low electricity prices, storing hydrogen, and utilizing it during peak load hours for energy production. Approximately 6.87% of the required gas in the MG was supplied by the P2G technology. In future work, it is proposed to extend our evaluation to include larger and more complex MG scenarios, incorporating a higher number of variables and constraints to assess the algorithm’s robustness and efficiency. This will provide a comprehensive understanding of the algorithm’s scalability and applicability to diverse and complex MG systems.
Conflicts of Interest
The authors declare no conflicts of interest.
Funding
This study did not receive any funding in any form.
Acknowledgments
No funding.
Open Research
Data Availability Statement
The data are available on request from the authors.


