Charging Station Sizing and Placement for EV Docking Station in Smart Grid
Abstract
Deploying electric vehicles (EVs) is essential for reducing greenhouse gas emissions and other harmful gases generated by conventional engines. Unprecedented hike in fuel prices and environmental concerns have increased the usage of EVs for last-mile connectivity. An increase in the adoption of EVs also leads to an increase in the grid power demand. A typical EV docking station (EVDS) hosting EVs for last-mile connectivity is considered in this research. Hence, there is a need to locate EVDS, considering the optimal charging pattern of the EVs and the distance traveled. Initially, a ride-hailing company EVDS is modeled based on the type and level of charging. Based on charging profile observations from the advanced metering system, the EV charging system provider (CSP) must propose a suitable location for placing the docking stations corresponding to the energy required for charging the EV fleet. The proposed approach integrates an IEEE 69 Bus distribution network with a solar-powered EVDS. Integration makes use of solar energy as a primary or supplementary source for charging EVs, promoting sustainability and reducing reliance on the conventional grid. Solar photovoltaic (SPV) system-powered EVDS improves reliability and efficiency by reducing power losses. EVDS remains functional during peak demand or grid outages due to the distributed nature of SPV systems. The optimal placement of a solar-based EVDS in the IEEE 69 bus system will improve the charging time, system reliability, and greater utilization of renewable energy sources. Finally, the reliability test was carried out for the optimal placement of solar EVDS within an IEEE 69 BUS system.
1. Introduction
Nowadays, electric vehicles (EVs) play a significant role in transportation than conventional fossil fuel-powered transportation, which produces pollution. In recent years, every government has rapidly increased and encouraged the use of EVs because of zero carbon emissions. Day by day, the population is increasing and the energy demand for transportation is also rising. Dependence on fossil fuels for transportation is not a sustainable option. Transportation electrification is a sustainable option because of zero tailpipe emissions. Globally, almost 14 million electric cars were registered in 2023, bringing the total number of EVs to 40 million, closely tracking the forecast from the 2023 Global EV Outlook. EV sales in 2023 were 3.5 million higher than in 2022, a 35% year-on-year rising [1].
When EVs become mainstream, the power demand for charging will go up significantly, stressing the existing generation capacity. Widespread EV adoption would stress the power infrastructure, with varying and more intense peaks. EVs could add up to 50% to peak demand and three per cent of demand between 2017 and 2030 [2]. Researchers have made significant efforts to satisfy the electric power demand for EVs sustainably. Utilizing renewable energy sources to satisfy the energy demand of EV charging would lead to significant reduction of stress in the existing grid. At the same time, grid power usage cannot be eliminated because of the intermittent nature of renewable energy resources. An ideal EV charging station (EVCS) should be able to utilize the input power from the grid along with renewable energy sources. EVCS is power supply device that supplies electrical power for recharging plug-in EVs includes electric two-wheeler, auto, and heavy-duty vehicles. It is also known as charging point or EV supply equipment (EVSE). EVCSs are connected to the utility grid in a distribution network. In the distribution network, they are different types of bus configurations standardized by IEEE. Out of the different bus systems, IEEE 69-bus system is a widely recognized benchmark for radial distribution networks, particularly in urban areas where this study is focused on placement of EVCSs.
The optimal placement of EVCSs in a distribution network depends on various factors, including charging demand, urban infrastructure, and grid reliability. One approach involves discretising charging demand based on gas station sales, functional areas, and population density is explored in [3]. Additionally, the integration of urban transportation networks and electrical distribution networks is crucial for improving travel comfort and ensuring efficient placement [4]. To mitigate congestion and enhance grid performance, time series analysis and EV load variations are considered to minimize power loss and voltage deviations [5]. The location of the electric substation supplying the charging station also plays a significant role, as it impacts development costs, EV energy loss, and grid losses [6]. Furthermore, optimizing EVCS placement involves addressing voltage instability and power loss by improving reliability metrics such as reduced reverse margins, voltage stability index, and overall system reliability [7].
The placement of EVCSs could be viewed from two different perspectives. One is the placement of EVCSs in a distribution network to optimize energy usage, and other is about the physical placement of charging stations to optimize usage and access in an urban landscape. Physical placement of charging stations requires consideration of additional parameters, including geographical area, population density, electrical source availability, traffic pattern, traffic density, charging patterns, road topology, and land use [8, 9]. The integration of EVCSs with renewable energy could help manage EV charging during the daytime and peak hours [10]. Using renewable sources like photovoltaic (PV) arrays and wind turbine generators to charge EVs helps reduce the overload on the utility grid [11]. Placement of charging stations with renewable energy in urban areas can help to reduce the installation, operation, grid connection costs, and maintain grid stability [12]. For solar-powered EVCSs, real-time meteorological data can be utilized to manage power demand and optimize placement [13]. Planning such stations requires additional considerations, including the number of charging ports, station capacity, and urban traffic flow [14]. To address the intermittent nature of solar PV (SPV) systems, battery energy storage can be integrated, with second-life batteries offering a sustainable solution to reduce carbon emissions [15–17]. PVs and wind turbines, combined with battery energy storage, help reduce system costs, minimize reverse power flow during high distributed generation (DG) penetration, and maximize peak shaving during high demand [18].
The integration of EVCS in the modern distribution network characterized by increased penetration of randomly distributed PV systems is challenging as they can lead to excessive power losses and voltage deviations [19, 20]. Additionally, the daytime variation of solar radiation is a factor to be considered for the sizing and placement of EVCSs [21]. As the renewable-powered EVCS placement in a distribution network is dependent on multiple factors, an optimization algorithm is deployed to find out the optimal location of the charging station in a distribution network.
The optimal placement of EVCSs in the distribution network can be determined using different optimization techniques. Different optimization algorithms, such as particle swarm optimization (PSO), genetic algorithm (GA), ant colony optimization (ACO), and artificial bee colony optimization (ABCO). GA, PSO, and slap algorithm (SSA) are explored for the optimal placement of EVCSs in a distribution network. Three meta-heuristic algorithms—PSO, AVOA, and SSA—are examined with respect to statistical analysis, payback period, efficiency, and cost minimization for the placement of EVCSs [22]. ACO is explored for the optimal placement of charging stations in dense traffic to minimize the total cost of EVCSs [23]. Sizing of the EVCS with DG sources is optimized using the PSO algorithm [17]. Minimization of power losses and improvement of the voltage profile is achieved through the optimal allocation of distributed generators using the meta-heuristic algorithm, hybrid graygrey wolf optimization [24]. The hybrid bacterial foraging optimization algorithm and PSO (BFOA–PSO) technique are used for the optimal placement of EVCSs in the distribution network with a high penetration of randomly distributed rooftop PV systems [19]. The random forest algorithm (RFA) is used to address EV, traffic flow, and PV-related uncertainties for the placement of EVCSs [14, 25].
An EV docking station (EVDS) is a charging hub for hiring/dropping last-mile connectivity shared vehicles, where the fleet operator owns the entire docking station and vehicles. Charged vehicles are available at the EVDS, which eliminates the waiting time for charging. Multiple hubs are placed at frequent distances so that vehicles can be taken or dropped by unlocking them through a mobile application after the payment of the access fee. An EVDS is different from an EVCS as it consumes continuous energy to keep all the docked vehicles in fully charged condition. Additionally, docking stations have to be placed at regular distances so that users can dock/undock vehicles as per their requirements. Also, the EVDS placement has to consider multiple factors like the number of vehicles, continuous usage, travel pattern, vehicle charging level, and life of the vehicles to ensure last-mile connectivity. Although several research has been conducted relevant to the optimal placement of charging stations in a distribution network, the docking station placement require an integrated approach to consider the additional constraints imposed by the unique nature of the docking stations.
2. Methodology
2.1. Coordinated Charging in Smart Grid
- •
A typical two-wheeler ride-hailing company with docking stations for last-mile connectivity is considered and its charging profile is determined.
- •
The docking stations are modeled along with EVs based on the type and the level of charging the vehicle supports.
- •
Optimal placement of a docking station with EV charging capability in a distribution system.
- •
The optimal placement of the docking station in the IEEE 69-bus distribution system connected with PV reduces both actual power loss and reactive power loss while also decreasing peak demand.
- •
The placement also improves the voltage profile after integrating PV into the docking station.
- •
Minimizing the charging time of an EV at a docking station with coordinated charging in a smart grid.
2.2. Charging of EV Fleet
The charging station provides electrical power for charging vehicles like electric cars, bikes, and busses. The charging station is classified into supply AC and DC charging stations. In the DC charging station, only the vehicle batteries can charge. Most EVs have an in-built AC to DC converters, which are commonly known as onboard chargers. When the AC power from the grid is supplied to the onboard charger, it converts the input to DC power to charge the vehicle battery. EVCSs provide connectors with a variety of international standards. Most DC charging stations have multiple connectors to charge various EVs. Electric supply equipment has different types of adapter pins according to international standards, such as a combined charging type system (CCS) and GB/T standard as shown in Table 1. Public charging stations are typically found on the street or at retail shopping centers, government facilities, and other parking areas. Private charging stations are usually found at residences, workplaces, and hotels.
| Type | Power (kW) | Time |
|---|---|---|
| Level I | 1.4–2.4 | 8–12 h |
| Level II | 7.7–25.6 | 3–4 h |
| Level III | >26 | 30–60 min |
2.3. Modeling the EV Along With the Docking Station
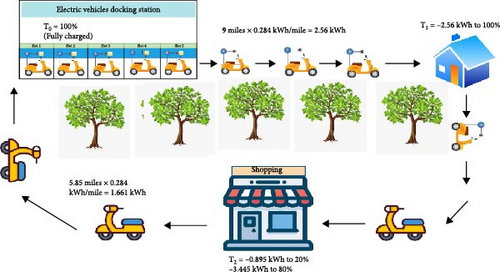
A docking station is also called a charging hub for the EV, as shown in Figure 1. Anyone can hire EVs in the docking station after completing the payment through a dedicated mobile application. After the completion of trip, the EVs can be dropped at a nearby docking station. The following user will have to unlock the vehicle through the mobile application before using it. Usually, these vehicles are designed for last-mile connectivity, and hence, the battery capacities would be lower compared to a typical electric two-wheeler. The docking station could also host charging stations/connectors to cater for the charging needs of electric two-wheelers and four-wheelers.

Docking stations for EVs are designed to provide a safe and reliable connection. The power source for charging EVs typically used in last-mile connectivity, installed at the workplace and public charging spots. The docking station provides different levels of charging, which could add 25 km of range per hour to an electric two-wheeler and 5 km per hour for an electric four-wheeler [26]. Docking stations are usually equipped with safety features, such as ground fault protection, which prevents electrocution prevention, overvoltage protection, and power surges prevention. They are also designed to be weatherproof and tamper-proof to protect the vehicle from theft or vandalism. Additionally, many docking stations are equipped with innovative features that allow the user to monitor and control the charging process remotely. The excess solar energy can be stored in batteries and utilized during peak demand times in charging stations.
- •
Number of EVDS = 10 No’s
- •
Number of slots per EVDS = 5 No’s
- •
Number of slots per EVDS = 5
- •
Capacity of one electric two-wheeler = 1.6 kW
- •
Total capacity of per docking station = Total no of electric two wheelers × capacity of EVs (50 × 1.6 = 80 kW).
2.4. Determination of Power Demand
Power demand refers to the amount of electric power required to operate the charging units that charge devices or vehicles, such as EVs, E-bikes, or other equipment’s, simultaneously. Measured in kilowatts (kW) or megawatts (MW), it represents the instantaneous rate at which electricity is consumed or needed to operate various electrical equipment, systems, or loads. The power required to install an EVDS in the distribution network can be determined by calculating the power requirements per charging unit, such as Level 1 or Level 2 chargers. To optimize the operational cost of a charging station under both uncertain conditions and deterministic scenarios, Rao-1, Rao-2, and Rao-3 algorithms are utilized. Various techniques are employed for uncertainty analysis and a probabilistic Monte Carlo simulation is applied to model the uncertainties associated with renewable resources and EV load.
The uncertainties related to the price sensitivity of EV charging and the state of charge (SoC) of EVs are considered as key factors for analysis. Despite fluctuations and unpredictability in electricity generation and consumption, the total electricity supplied by SPV, wind, and the grid is balanced with the total electricity demand of EVs [28]. Multiply the number of chargers per docking station to get the demand for each docking station’s capacity, as shown in Figure 2. Integrating solar power with a docking station is the best solution to balance the power demand between the docking station and the distribution network. Renewable energy is supplied directly by the SPV panels in the docking stations, which further reduces the power demand from the grid. SPV panels with docking stations will reduce the power demand from the grid by supplying renewable energy directly to the chargers. Installing the docking station with solar panels can generate electricity during daylight hours, offsetting the energy needed from the grid. Solar reduces power demand depending on the size of the solar array and the energy generation potential based on location, sunlight hours, and panel efficiency. Excess solar energy can be stored in batteries and utilized during peak demand times.
2.5. Significance of Time of Charging
The time taken to charge the EVs at a docking station depends on several factors, including the battery size, the charging speed of the station, and the type of connector used. For example, it can take 4–6 h to charge a battery EV (BEV) from empty level using a Level 1 charger, while a DC Fast Charger (DCFC) can charge a BEV from empty level in as little as 20 min to 1 h. Battery size also plays a role in charging time, with smaller batteries able to reach capacity faster than larger batteries. Charging stations, also known as charge points or EVSE, supply electrical power for charging plug-in EVs. Typically found at retail shopping centers, government facilities, and other parking areas, public charging stations have multiple connectors and can charge various vehicles. In contrast, private charging stations are typically found at residences, workplaces, and hotels.
3. Proposed System With Docking Stations
- 1.
Forward–backward sweep (FBS) used to perform distribution load flow analysis (DLFS).
- 2.
PSO used in the reconfiguration of tie switches for load flow analysis of the distribution system.
The allocation provides two main factors: the position of the docking charging station within the distribution and the load capacity of each docking station. A total number of 10 docking charging stations in the distribution network, each having a power capacity of 80 kW, is considered in this work. Docking stations allow more EVs to charge simultaneously, which can then be utilized and shared by the users for last-mile connectivity. In the proposed system, three different cases of placing the docking station in the distribution network are considered. One of the possible cases includes integrating a docking station with SPV for optimal placement of the docking station in a distribution system.
Various factors need to be considered to identify the optimal placement of EVDSs in the distribution network. The fixed variable is the load capacity, which is regarded as the maximum power the docking station can handle when maximum number of vehicles is charged simultaneously, as well as the charging speed.
The decision variable is the location of each EVDS within the distribution network, which minimizes the power losses and reduces the travel time of EV users. This objective can be addressed through optimization techniques like the forward–backward algorithm and PSO. PSO method is known for its faster convergence speed, ease of implementation, and robustness in solving nonlinear, constrained optimization problems in power systems. This optimization has more exploration and exploitation of the solution space, which are balanced well with minimal parameter tuning compared to other meta-heuristic methods like the GA, ACO, and differential evolution algorithm. PSO has many advantages over the GA, simulated annealing (SA), ABC, and other optimization techniques. The requirement for memory storage is less. By using this algorithm, a better solution is obtained, programming is easy, and convergence is faster than GA [17, 31–33].
- •
Objective: Optimal placement of a docking station and minimizing the charging time.
- •
Fixed variable: Load capacity of a docking station in the distribution system.
- •
Decision variable: Location of 10 EVDSs in a distribution network.
- •
Optimization method: Forward–backward algorithm, and PSO.
For the optimal placement of 10 EVDSs in a distribution network, nine different scenarios are considered as specificized in Table 2.
| Cases | Scenarios considered | Tie lines considered |
|---|---|---|
| 1 (a) | IEEE 69 bus system with standard loads | No |
| 1 (b) | IEEE 69 bus system with standard loads along with EV docking stations incorporating traveling pattern | No |
| 1 (c) | Optimal placement of solar photovoltaic (PV) IEEE 69 bus system with standard loads | No |
| 2 (a) | IEEE 69 bus system with standard loads and tie line switches | Yes |
| 2 (b) | Placement of EV docking station in IEEE 69 bus system with tie line switches incorporating traveling pattern | Yes |
| 2 (c) | Placement of EV docking station with solar PV in IEEE 69 bus system and tie line switches incorporating traveling pattern | Yes |
| 3 (a) | IEEE 69 bus system with tie line switches for loss minimization | Yes |
| 3 (b) | Placement of EV docking station in IEEE 69 bus system with tie line switches for loss minimization incorporating traveling pattern | Yes |
| 3 (c) | Placement of EV docking station with solar PV in IEEE 69 bus system and tie line switches for loss minimization incorporating traveling pattern | Yes |
Nd: number of docking station
Ne: number of EVs
Pi: power required for ith EVs
Rij: resistance between docking station j and EV i
Vij: voltage level of the network.
4. Simulation Results and Discussion
In this section, three different cases are considered for the proposed system to validate the optimal placement of EVDS with SPV. Table 2 indicates the different scenarios considered in each case.
4.1. Case 1 (a): IEEE 69 Bus System With Standard Loads
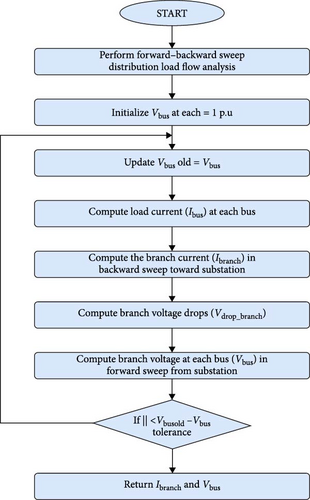
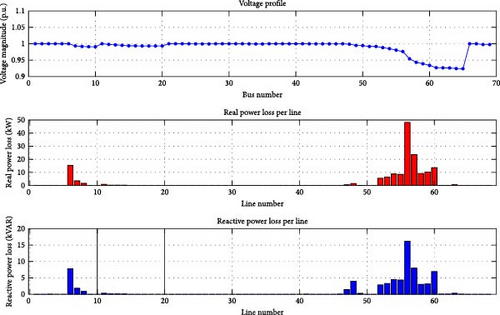
Case 1 (a): IEEE 69 distribution bus system is considered as shown in Figure 3. The distribution system uses the FBS algorithm to analyze the load flow analysis shown in Figure 4. The total power loss obtained is 227 kW in the system without the placement of the docking station.

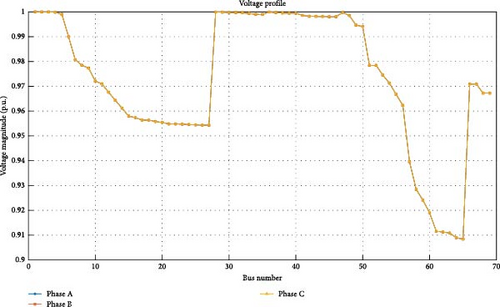
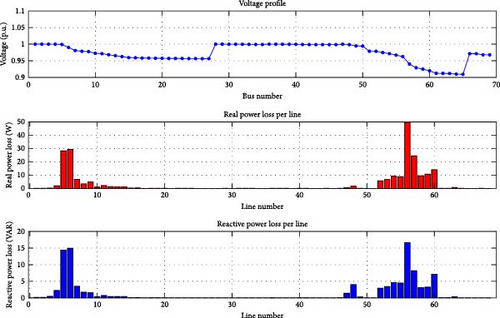
The voltage at each bus typically starts at a specified value, such as the nominal voltage is 1.0 per unit (p.u). It has been calculated using the IEEE 69 bus distributed system with standard loads. The voltage profile obtained is 0.97 p.u, as shown in Figures 5 and 6.
4.2. Case 1 (b): IEEE 69 Bus System With Standard Loads Along With EVDSs Incorporating Traveling Pattern
Case 1 (B) considers the placement of the docking station in the IEEE 69 distribution bus system considering the traveling pattern of the EV. For the initial calculation, two vehicles are assumed to have a 50% SoC and 100% SoC, respectively. These two vehicles, labeled EV1 and EV2, start from Node 1. The vehicle travels from the starting Node 1 to the subsequent nodes and covers the distance between the nodes accordingly, as specified in [25]. When the EV1 travels from Node 1 to Node 2, the SoC reduces to 30% and the distance coverage is 0.8 km. Subsequently EV1 reaches Node 4 with a SoC of 8%, covering 2.1 km. The EV1 cannot travel from Node 4 to Node 5 with a SoC of 8%. Based on the above traveling pattern of EV1, docking station 1 is placed on Node 4.
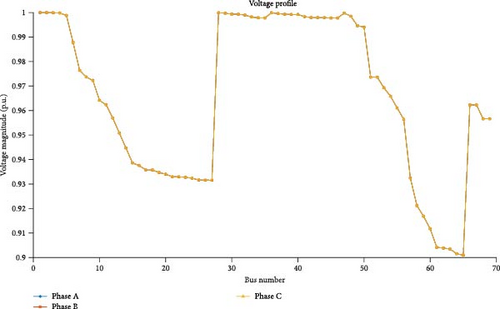
The same calculation can be extended for EV2 as well. Calculating the traveling pattern of both EVs, docking stations placed in 10 locations are 4, 8, 11, 15, 18, 22, 25, 33, 40, and 57 in the distribution system. In the docking station simultaneously, the 50 EVs can be charge. Considering the number of vehicles, the load flow analysis was conducted using the backward–forward sweep algorithm in this distribution system. The total power loss obtained is 303 kW after placing the docking station in the distribution system, as shown in Figure 7.
The voltage profile represents the magnitude of different busses across the IEEE 69 bus distribution system with an EVDS. The voltage at each bus typically starts at a specified value, where the nominal voltage is 1.0 p.u. The voltage profile was calculated using the IEEE 69 bus distributed system with 10 docking stations. The voltage profile obtained is 0.96 p.u, as shown in Figure 8.
4.3. Case 1 (c): Optimal Placement of SPV in IEEE 69 Bus System With Standard Loads
Case 1 (c) considers the placement of the EVDS in the IEEE 69 distribution bus system and considers the traveling pattern of the EV along with the SPV system as shown in Figure 9. For the initial calculation, two vehicles are assumed to have a 50% SoC and 100% SoC, respectively. These two vehicles labeled EV1 and EV2, start from Node 1.

The vehicle traverses from the starting Node 1 to the subsequent nodes and covers the distance between the nodes accordingly, as specified in [22]. When the EV1 travels from Node 1 to Node 2, the SoC reduces to 30% and the distance covered is 0.8 km. Next EV1 reaches Node 4 with a SoC of 8%, covering a distance of 2.1 km. The EV1 cannot travel from Node 4 to Node 5 with a SoC of 8%. Based on the above traveling pattern of EV1, docking station 1 is placed on Node 4.
The same calculation can be extended for EV2 as well. Calculating the traveling pattern of both EVs, docking stations placed with SPV in the 10 locations are 4, 8, 11, 15, 18, 22, 27, 33, 40, and 57 in the distribution system. In the docking station simultaneously, 50 EVs can charge. Considering the number of vehicles, load flow analysis was conducted using the backwards forward sweep algorithm in this distribution system. The total power loss obtained is 72.66 kW after placing the docking station in the distribution system as shown in Figure 10.

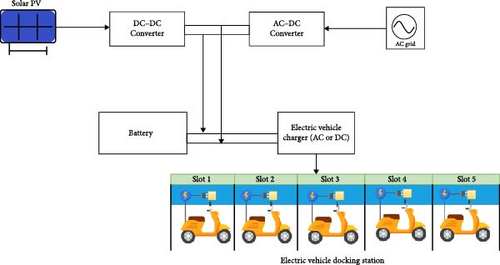
In this block diagram a SPV system is integrated with an EVDS, which includes power conversion and storage components. A SPV array generates DC power, which is then regulated by a DC–DC converter to ensure a stable supply. Battery storage is used as a backup source when solar generation is insufficient AC–DC converters can convert power from the AC grid into DC, as shown in Figure 11. Excess from the solar energy is stored in a battery system, ensuring uninterrupted power availability for charging EVs. The energy stored in the battery can be used during periods of low sunlight. The EV charger, which operates on either AC or DC power, manages and regulates the power supply to the charging slots. Electric two-wheelers are powered by five charging slots, each equipped with a charging connector. Energy stored in the battery and grid power is used to charge the electric two-wheeler continuously in the docking station.
- •
Energy demand per day = Capacity per EV × charging hours × No of EV’s.
- •
Solar system size (kW) = (Energy demand day × (1 + L)/(solar generation per day (h).
- •
Storage capacity (kWh) = Energy demand per day.
The generic integration of SPV systems with EVDSs considers the following parameters: Each electric two-wheeler has a capacity of 1.6 kW and a docking station accommodates five electric two-wheelers, resulting in a total capacity of 8 kW per docking station. Solar energy generation is available for 5 h per day and system losses are estimated to be 10%. The equations describe the modeling of the individual solar size, which can be scaled for the capacity of solar and battery.
4.4. Case 2 (a): IEEE 69 Bus System With Standard Loads With Tie Line Switches
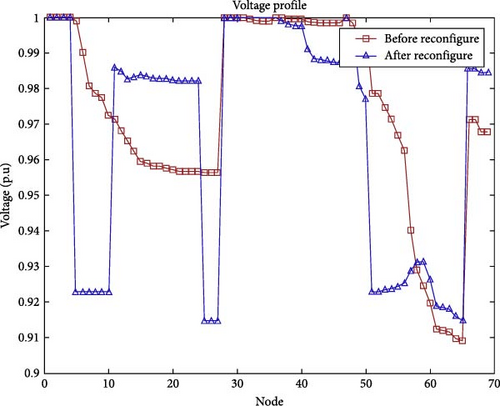
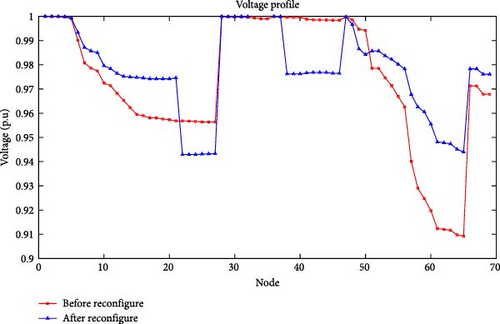
Case 2 (a) considers the tie line switches from the existing topology work without placing the docking station in the IEEE 69 distribution bus system as shown in Figure 12. The reconfiguration of tie switches is 14, 63, 56, 71, and 42 open. Then, the load analysis was conducted using PSO. The total power loss obtained while the tie switches open was 121 kW in the existing topology work.

In this case, the tie line switches from the existing topology work should be considered without placing the docking station in the IEEE 69 distribution bus system. The voltage profile was calculated before and after reconfiguration with standard loads and a tie line in the IEEE 69 bus system. The voltage profile obtained before reconfiguration without a tie switch is 0.90 p.u and after reconfiguration with tie line switches it is 0.98 p.u, as shown in Figures 13 and 14.
4.5. Case 2 (b): Placement of EVDS in IEEE 69 Bus System With Tie Line Switches Incorporating Traveling Pattern
Consider the placement of the docking station in the reconfiguration of tie line switches IEEE 69 distribution bus system considering the EV traveling pattern as shown in Figure 15. For the initial calculation, two vehicles are assumed to have a 50% SoC and 100% SoC, respectively. These two vehicles, labeled EV1 and EV2, starts from Node 1. The vehicle traverses from the starting Node 1 to the subsequent nodes and covers the distance between the nodes accordingly as specified in [34].

When the EV1 travels from Node 1 to Node 2, the SoC reduces to 30% and the distance covered is 0.8 km. Subsequently, EV1 reaches Node 4 with a SoC of 8% covering 2.1 kms. The EV1 cannot travel from Node 4 to Node 5 with a SoC of 8%. Based on the above traveling pattern of EV1, docking station 1 is placed on Node 4.
The same calculation can be extended for EV2 as well. Calculating the traveling pattern of both EVs, docking stations placed in 10 locations are 4, 8, 11, 15, 18, 22, 25, 33, 40, and 57 in the distribution system. In the docking station simultaneously, 50 EVs can be charged. Considering the number of vehicles, the load flow analysis was conducted using the FBS algorithm in this distribution system. The total power loss obtained is 158 kW after placing the docking station in the distribution system. In this case, the tie line switches from the existing topology work should be considered with placing the docking station in the IEEE 69 distribution bus system. The voltage profile was calculated before and after reconfiguration with standard loads and a tie line in the IEEE 69 bus system. The voltage profile obtained before reconfiguration without a tie switch is 0.90 p.u and after reconfiguration with tie line switches, it is 0.95 p.u, as shown in Figure 16.
4.6. Case 2 (c): Placement of EVDS With SPV in IEEE 69 Bus System With Tie Line Switches Incorporating Traveling Pattern
Consider the optimal placement of the docking station with SPV in the reconfiguration of tie line switches IEEE 69 bus distribution system considering the EV traveling pattern. For the initial calculation, two vehicles are assumed to have a 50% SoC and 100% SoC, respectively. These two vehicles, labeled EV1 and EV2, start from Node 1. The vehicle traverse from the starting Node 1 to the subsequent nodes and covers the distance between the nodes accordingly as specified in [22]. When the EV1 travels from Node 1 to Node 2, the SoC reduces to 30% and the distance coverage is 0.8 km. Subsequently, EV1 reaches Node 4 with a SoC of 8%, covering 2.1 km. The EV1 cannot travel from Node 4 to Node 5 with a SoC of 8%. Based on the above traveling pattern of EV1, docking station 1 is placed on Node 4.
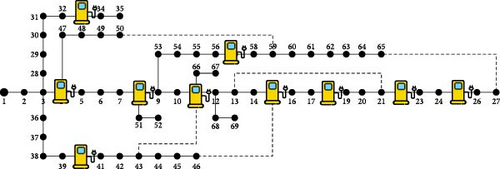
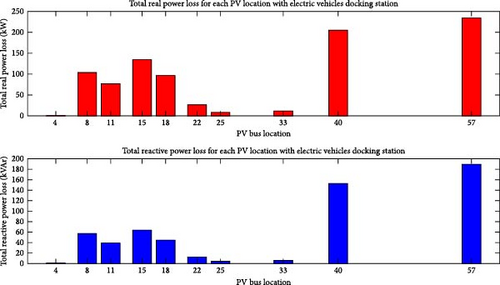
The same calculation can be extended for EV2. Calculating the traveling pattern of both EVs, docking stations with SPV placed in 10 locations are 4, 8, 11, 15, 18, 22, 25, 33, 40, and 57 in the distribution system as shown in Figure 17.

In the docking station simultaneously, 50 EVs can be charge. Considering the number of vehicles, the load flow analysis was conducted using the PSO algorithm in this distribution system. The EVDS has SPV for bus no. 18, 22, 27, 33, 37, 42, and 57. The total power loss obtained is 148 kW after placing the SPV in the docking station in the distribution system, as shown in Figure 18.
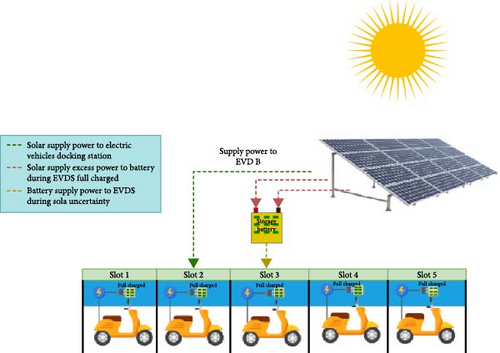
A SPV array generates DC power, which is then regulated by a DC–DC converter to ensure a stable supply. Battery storage is used as a backup source when solar generation is insufficient. Excess from the solar energy is stored in a battery system, ensuring uninterrupted power availability for charging EVs as shown in Figure 19. The energy stored in the battery can be used during periods of low sunlight. The EV charger, which operates on either AC or DC power, manages and regulates the power supply to the charging slots. Electric two-wheelers are powered by five charging slots each equipped with a charging connector. Energy stored in the battery and grid power is used to charge the electric two wheelers continuously in the docking station.
4.7. Case 3 (a): IEEE 69 Bus System With Tie Line Switches for Loss Minimization
Consider the tie line switch in the current topology work without placing the docking station in the IEEE 69 distribution bus system as shown in Figure 20. The reconfiguration of tie switches 43, 9, 17, 58, and 62 are open and load analysis was conducted using PSO. The total power loss obtained while the tie switches were open was 121 kW in the current topology work.

The voltage profile was calculated before and after reconfiguration with standard loads and a tie line in the IEEE 69 bus system. The voltage profile obtained before reconfiguration without a tie switch is 0.90 p.u, and after reconfiguration with tie line switches, it is 0.95 p.u.
4.8. Case 3 (b): Placement of EVDS in IEEE 69 Bus a System With Tie Line Switches for Loss Minimization Incorporating Traveling Pattern
Consider the placement of the docking station in the reconfiguration of tie line switches IEEE 69 distribution bus system, considering the EV traveling pattern. For the initial calculation, two vehicles are assumed to have 50% SoC and 100% SoC, respectively. These two vehicles, labeled EV1 and EV2, start from Node 1.
The vehicle traverses from the starting Node 1 to the subsequent nodes and covers the distance between the nodes accordingly, as specified in [17]. When the EV1 travels from Node 1 to Node 2, the SoC reduces to 30% and the distance covered is 0.8 km. Subsequently, EV1 reaches Node 4 with a SoC of 8%, covering a distance of 2.1 km. The EV1 cannot travel from Node 4 to Node 5 with a SoC of 8%. Based on the above traveling pattern of EV1, docking station 1 is placed on Node 4. The same calculation can be extended for EV2 as well. Calculating the traveling pattern of both EVs, docking stations placed in the 10 locations are 4, 8, 11, 15, 18, 22, 25, 33, 40, and 57 in the distribution system. In the docking station simultaneously, the 50 EVs can charge. Considering the number of vehicles, the load flow analysis was conducted using the PSO algorithm in this distribution system. The total power loss obtained is 145 kW after placing the docking station in the distribution system, as shown in Figure 21.

4.9. Case 3 (c): Placement of EVDS With SPV in IEEE 69 Bus a System With Tie Line Switches for Loss Minimization
Consider the placement of the docking station with SPV in the reconfiguration of tie line switches IEEE 69 distribution bus system as shown in Figure 22. By Considering the EV traveling pattern. For the initial calculation, two vehicles are assumed to have a 50% SoC and 100% SoC, respectively. These two vehicles, labeled EV1 and EV2, start from Node 1. The vehicle traverses from the starting Node 1 to the subsequent nodes and covers the distance between the nodes accordingly, as specified in [22]. When the EV1 travels from Node 1 to Node 2, the SoC reduces to 30% and the distance covered is 0.8 km. Subsequently, EV1 reaches Node 4 with a SoC of 8%, covering a distance of 2.1 km.

The EV1 cannot travel from Node 4 to Node 5 with a SoC of 8%. Based on the above traveling pattern of EV1, docking station 1 is placed on Node 4. The same calculation can be extended for EV2 as well. Calculating the traveling pattern of both EVs, docking stations with PV placed in different locations are 18, 22, 27, 33, 37, 42, 47, 52, 58, and 64 in the distribution system. In the SPV with docking station simultaneously, 50 EVs can be charged. Considering the number of vehicles, load flow analysis was conducted using the PSO algorithm in this distribution system. Total power loss obtained is 128 kW after placing the docking station in the distribution system, as shown in Figure 23.
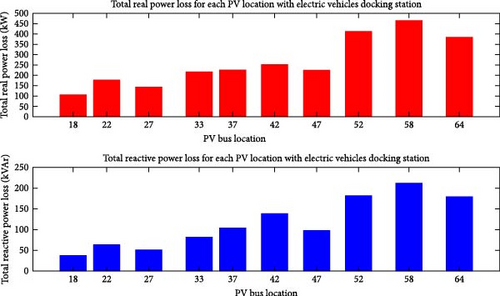
This work has considered the optimal placement of an EVDS. Docking stations are used by EVs for last-mile connectivity covering short-distance commutes. Nine different cases have been considered in the distributed system for the placement of docking station as shown in Figure 24. Load flow analysis was conducted using the FBS algorithm to find the optimal placement of SPV with a docking station in the distributed system. In the first case, the load flow analysis has been conducted before the placement of the docking station. After the placement of the docking station and the docking station with the SPV in the distributed system, total power loss had also been calculated.
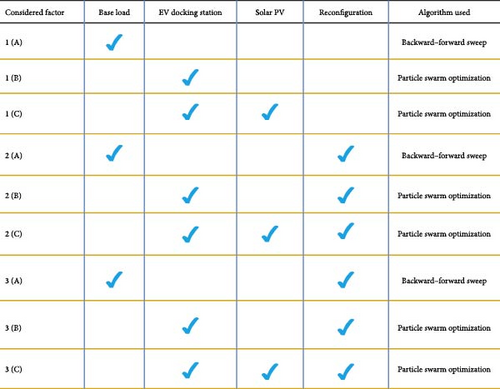
In the second case, the load flow analysis and optimal placement of docking station analysis has been conducted in the IEEE 69 bus system. By considering the tie line switches before the placement of the docking station, after the placement of the docking station and the docking station with the SPV in the distributed system the total power loss has been calculated. In the third case, the load flow analysis has taken for the optimal placement of docking station analysis were conducted in the IEEE 69 bus system. By considering another different set of tie line switches used before the placement. The docking station, after the placement of the docking station with the SPV in the distributed system, total power loss has been calculated. Comparing the three different case studies, docking station with a SPV system is the best for reducing total power loss and improving the voltage profile in the IEEE 69 bus distribution system as shown in Table 3. Interestingly, the SPV system in the system not only brings down the operational cost but also helps in operating the entire distribution system in an efficient manner. Using SPV systems with docking stations helps transition towards a cleaner and more sustainable transportation system.
| Cases | Base load losses (kW) | Actual losses (kW) | Loss increases (kW) | Loss decreases (kW) |
|---|---|---|---|---|
| 1 (a) | 228 | 228 | — | — |
| 1 (b) | 228 | 303 | 72 | — |
| 1 (c) | 228 | 72 | — | 156 |
| 2 (a) | 228 | 121 | — | 107 |
| 2 (b) | 228 | 158 | — | 70 |
| 2 (c) | 228 | 148 | — | 80 |
| 3 (a) | 228 | 121 | — | 107 |
| 3 (b) | 228 | 145 | — | 107 |
| 3 (c) | 228 | 128 | — | 100 |
5. Conclusion
This work focuses on the optimal placement of solar powered EVDSs in the IEEE 69-bus distribution network for electric two-wheelers, based on their travel patterns from a ride-hailing company to enhance last-mile connectivity. The docking station serves as a continuous charging hub for multiple two-wheelers. A SPV system with battery storage is included for backup during low solar generation periods. Nine different scenarios are analyzed, considering two initial SoCs for electric two-wheelers at various nodes, aiming to minimize power losses and improve voltage stability. This study is conducted in three phases. First, the distribution system without docking station placement, where Cases 1 (a), 2 (a), and 3 (a) are analyzed, including five tie-line switches in Cases 2 (a) and 3 (a), using the backward–forward sweep algorithm, with Case 3 (a) yielding the least power losses and best voltage profile after reconfiguration. Second, the distribution system is analyzed with docking station placement, where Cases 1 (b), 2 (b), and 3 (b) are evaluated under the same conditions, demonstrating further loss reduction and voltage improvement, with Case 3 (b) performing better with 8% reduction is power losses. Finally, the distribution system is analyzed with both docking station and SPV integration, where Cases 1 (c), 2 (c), and 3 (c) incorporate optimal SPV placement with 10 docking stations using the PSO algorithm, achieving 14% power loss reduction and improvement in voltage stability index from 0.90 to 0.96 p.u. The integration of SPV with docking stations and its optimal placement in the distribution system enhances grid stability, reliability, and efficiency while supporting a cleaner and more sustainable energy.
Conflicts of Interest
The authors declare no conflicts of interest.
Funding
The authors thank the Anusandhan National Research Foundation (ANRF), Government of India for the research grant to perform this work through the ANRF-SURE (SUR/2022/004451) scheme. Also, the authors thank the SASTRA Deemed University for the support provided.
Open Research
Data Availability Statement
The data that support the findings of this study are available from the corresponding author upon reasonable request.


