Multi-Objective Optimization of Illuminance, Heating, and Cooling Setpoints in Office Buildings Using a Fuzzy-Based Approach
Abstract
This article introduces a novel optimization approach grounded in fuzzy logic, which transforms the multi-objective optimization problem into a single-objective one. Instead of providing a Pareto front, this method delivers a final optimal point based on predefined design priorities. The proposed methodology is applied to optimize illuminance, heating, and cooling setpoints in an office building across six cities with diverse climates to assess its performance under various conditions. The multi-objective optimization of these setpoints represents a novel contribution to smart building design. Compared to the NSGA-II method, the newly introduced approach exhibits simplicity and achieves a 50% reduction in computational time. The method leverages user experiences in formulating fuzzy rules, yielding more optimal solutions compared to the NSGA-II. The proposed method combines neural network, fuzzy logic, and genetic algorithm to create an efficient and intelligent framework for fast and accurate multi-objective optimization in energy-related problems.
1. Introduction
A pivotal aspect of fossil fuel consumption and CO2 production revolves around the energy consumption within buildings. This energy is allocated for essential purposes such as heating, cooling, ventilation, hot water supply, lighting, and the provision of electricity. The simulation of energy usage in buildings is a crucial step in reducing energy consumption. Various methods have been developed in recent years to achieve this goal, with artificial intelligence (AI) emerging as a novel and potent tool within this domain.
AI, a branch of computer science, has become deeply integrated into modern society. It aims to understand intelligence and create robots with human-like cognitive abilities. As a leading science and technology field, AI simplifies tasks, opens new avenues for research and development, and drives innovation in work and production. This broad domain covers numerous topics and algorithms designed to outperform human efficiency. The main goal of AI is to replicate human capabilities and perform diverse, useful tasks. AI processes are typically simple, avoiding complex calculations to provide quick results [1–3]. This article focuses on three key AI methodologies: fuzzy logic, neural networks, and genetic algorithms (GAs).
Fuzzy logic is a system that aids decision-making when situations are not clear-cut. Rather than simply categorizing something as true or false, it allows for a range of possibilities, where things can be partially true. This makes it particularly useful in scenarios where answers are not simply black or white, such as controlling a thermostat or modeling human thinking. Fuzzy logic constitutes a methodology aimed at emulating the human mind’s capacity for logical decision-making. Central to this logic is fuzzy theory, a systematic approach for translating the expertise of an individual into a nonlinear function, representing its fundamental characteristic. Fuzzy logic is based on a set of rules derived from an expert’s knowledge and experience. Using linguistic expressions, it can solve complex problems across different fields without needing detailed mathematical models. Its advantages include simplicity, fast processing, no need for complicated calculations, and the use of expert insights [3, 4].
Neural networks mimic the human brain’s nervous system by replicating the processes of human neurons. These networks consist of neurons as processing units connected by links called weights, enabling parallel processing. During training, the weights are adjusted to align the network’s output with the desired result. Neural networks typically have an input layer, one or more hidden layers, and an output layer, mirroring the hierarchical structure of biological neural systems [3, 5].
Evolutionary optimization algorithms are computational methods inspired by natural processes. They excel at finding the best solutions to complex optimization problems and have gained significant attention over recent decades. Among these algorithms, the GA stands out as one of the most widely recognized. This algorithm, functioning as a population-based optimization approach, emulates the principles of natural biological evolution, incorporating concepts such as survival of the fittest, natural selection, and reproduction [4, 6].
The implementation of intelligent lighting control system in smart buildings is a modern approach aimed at reducing electricity consumption for illumination. Each area is equipped with controllers or dimmers that adjust lighting based on natural light levels, optimizing energy usage. This paper presents a strategy to reduce electricity consumption in various building spaces through an intelligent lighting control system and dimmable lamps. The system turns off lamps when natural light exceeds a predefined threshold, relying on daylight for illumination. When ambient brightness falls below the threshold, lamps activate, reducing overall electricity usage.
1.1. Literature Review
Neural networks and GAs have been widely used to simulate energy consumption in buildings [7–17], while the use of fuzzy logic in this field has received less attention from researchers. Shanableh and Evcil [18] estimated the energy consumption of residential buildings in Northern Cyprus using a fuzzy interface system. The input variables comprised climate zone, floor area, building type, year of construction, and the number of occupants, while the output variable encompassed energy consumption per floor area. Chaouch et al. [19] utilized fuzzy logic to mitigate energy consumption in HVAC systems and improve thermal comfort within an office building. Kathiravel et al. [20] utilized fuzzy logic to evaluate the economic and environmental impacts of various HVAC systems in net-zero residential buildings across different climatic regions in Canada. Shah et al. [21] proposed a fuzzy logic-based direct load control scheme for air conditioning systems to reduce energy consumption and manage peak demand. The approach effectively balanced user comfort with energy efficiency by adapting to real-time conditions. Arun et al. [22] introduced the fuzzy clustering rule-based building control systems (FCR-BCS), which incorporates fuzzy logic into simulations to address uncertainties in building energy use. The model significantly enhanced energy efficiency analysis (99.8%) and other performance metrics, outperforming existing methods. Hua et al. [23] developed an integrated demand response framework that combines fuzzy logic for temperature setpoint adjustments with a multi-objective model predictive control (MPC) layer to optimize thermal comfort, energy efficiency, and cost savings. Simulations demonstrated substantial results, achieving energy savings of up to 16.0% and cost reductions of 12.6%. Noor et al. [24] introduced a fuzzy logic-based decision support system for energy audits in hospital buildings. By applying fuzzy logic, the system assessed the hospital’s energy consumption as efficient. The study emphasized the effectiveness of fuzzy logic in energy management.
In recent years, multi-objective optimization has gained considerable prominence as a methodology employed to mitigate energy consumption and enhance the comfort of occupants within buildings designed for diverse purposes. Futrell et al. [25] refined a classroom’s geometry, orientation, and window properties in Charlotte using the Hybrid GPS Hooke Jeeves/PSO algorithm, optimizing for energy consumption and daylighting quality. Kim et al. [26] employed artificial neural network, GA and design of experiment methods to optimize an office building’s integrated daylighting and air conditioning system, aiming to minimize energy consumption and ensure occupant comfort. Mahdavinejad and Nazar [27] optimized geometric parameters in an office building to minimize energy consumption and maximize daylight illuminance. Zhang et al. [28] optimized a school building in China for energy efficiency, lighting, and thermal comfort in a cold climate. Fang and Cho [29] improved energy use intensity and utilization daylighting index for an American office building. Zhu et al. [30] optimized rural tourism buildings in North China for energy efficiency and indoor environmental quality. Pilechiha et al. [31] used multi-objective optimization to position and size windows in an office building for enhanced energy efficiency and visual comfort. Bakmohammadi and Noorzai [32] optimized primary school classrooms in Tehran for energy consumption and thermal comfort. Wagiman et al. [33] applied Multi-Objective Particle Swarm Optimization (MOPSO) to optimize energy consumption and visual comfort in a Malaysian office building. Lakhdari et al. [34] analyzed glazing, wall materials, and shading variables in Algerian classrooms for improved daylighting, thermal comfort, and energy consumption. Wang et al. [35] optimized layout and height parameters for high-rise residential buildings, considering lighting, visual comfort, and thermal conditions. Dong et al. [36] introduced an intelligent optimization approach for building and window dimensions, considering daylighting and energy performance. Nasrollahzadeh [37] optimized a duplex house in a Mediterranean climate for energy usage intensity, useful daylight illuminance, and PPD. Khani et al. [38] optimized parameters for an educational building in the hot and humid climate of Qeshm, considering energy consumption and visual comfort. Bagheri-Esfeh and Dehghan [39] optimized thermostat setpoints in a residential building using EnergyPlus, GMDH neural networks, and the NSGA-II algorithm. They recommended XPS insulation, a heating setpoint of 22°C, and climate-specific cooling setpoints. Zhang et al. [40] proposed a novel framework that integrates physical simulation with explainable machine learning to optimize building energy performance under climate change and urban heat island effects. They improved energy use and thermal comfort, achieving a 54% efficiency improvement. Behzadi Hamooleh et al. [41] optimized energy use and thermal comfort in residential buildings by combining phase change materials with insulation. Analysis across four Iranian cities revealed up to 99% heating energy savings and 52% cooling energy savings. Liu et al. [42] optimized daylighting and energy use in educational buildings across China’s climatic zones. They identified optimal configurations for dimensions, orientation, and window-to-wall ratios. Results showed up to 19% energy savings, 56.4% glare reduction, and 19% daylight improvement. Zahra Benaddi et al. [43] proposed a simulation-based multi-objective optimization methodology to evaluate building envelope retrofits across six Moroccan climates. Using TRNSYS and GENOPT, the study identified climate-specific solutions that significantly reduced costs, CO2 emissions, and thermal discomfort, demonstrating the effectiveness of optimization for sustainable retrofitting. Wang et al. [44] developed an optimization tool for early-stage urban building design that combines thermal load prediction, climate modification, and multi-objective optimization. The tool demonstrated high accuracy and identified strategies to balance energy efficiency and natural lighting across diverse climates, advancing sustainable urban planning methods. Wang and Gadi [45] optimized HVAC setpoints for energy efficiency and comfort in Chinese residential buildings. Using simulations and machine learning, they identified strategies that enhance comfort and minimize energy use across various climate zones. Lin et al. [46] optimized a healthy building in Shanghai by addressing energy consumption, indoor air quality, and visual comfort, combining machine learning with optimization algorithms.
1.2. Research Gap and Contributions
Prior research shows that multi-objective optimization in building energy management often uses methods like NSGA-II (Non-Sorting Genetic Algorithm-II) and SPEA (Strength Pareto Evolutionary Algorithm). These approaches generate a Pareto front, which represents a range of non-dominant optimal solutions for designers to evaluate. The “Pareto front” refers to a set of optimal solutions in a scenario where multiple objectives are being considered and improving one objective would worsen another. It represents the trade-offs between different choices, where no solution is better in all aspects. Selecting the final optimal solution from the Pareto front is a design challenge. Methods like TOPSIS are used for this purpose; however, they have certain limitations. TOPSIS requires careful normalization and weight assignment, as improper handling can distort results, allowing objectives with larger scales to dominate. Moreover, multi-objective optimization algorithms, including the selection of the final optimal solution from the Pareto front, often encounter challenges such as high computational time and implementation complexities.
A new method capable of transforming a multi-objective optimization problem into a single-objective one, yielding a final optimal solution instead of a Pareto front, can significantly simplify problem-solving, particularly in the field of energy management in buildings.
In the existing literature, some methodologies have been introduced to convert multi-objective optimization problems into formulations with singular objectives. For example, Pazuki et al. [47] employed the multi-choice goal programming (MCGP) approach to convert a three-objective optimization problem into a singular objective optimization problem, aiming to determine the most optimal energy strategy for a university building. Developing an MCGP model requires specifying multiple acceptable ranges or levels for each objective. Formulating the problem with these multiple choices can be complex. He and Zhang [48] developed a bi-objective model for public building envelope design, with the goal of reducing both energy use and costs. Using the ε-constraint method, their model successfully balances these objectives. This method transforms a multi-objective problem into a series of single-objective problems by treating other objectives as constraints. Multiple optimizations are needed to explore different solutions, and selecting appropriate constraint values can be challenging, often requiring trial and error. Developing a new method that transforms a multi-objective optimization problem into a single-objective one while incorporating expert experience can make the problem easier, more accurate, and faster to solve.
This article presents a novel method that leverages a fuzzy logic approach to convert multi-objective optimization problems into single-objective formulations. The proposed method not only simplifies the problem-solving process but also reduces computational time and enhances the accuracy of solutions. Moreover, the approach integrates expert knowledge in the formulation of fuzzy rules, ensuring solutions that are both practical and applicable. Another advantage of this methodology is its flexibility, allowing expert to dynamically adjust the importance of each objective function in an intelligent manner.
Illumination setpoints for different spaces are determined by specific lighting needs based on building function and purpose. Standards specify varying illumination ranges based on factors such as building usage and the function of the space [49]. Selecting an optimal daylight illuminance setpoint for diverse spaces within a building, especially in applications like an office building, is crucial for reducing energy consumption. Customizing lighting conditions to meet specific space requirements significantly enhances energy efficiency. A comprehensive analysis of preceding studies in the domain of energy-efficient building design reveals a prevailing focus on geometric and structural parameters, with a noteworthy absence of investigations into the daylight illuminance setpoint as a design variable. This article highlights the potential to enhance energy efficiency by integrating such a variable into the design framework. Multi-objective optimization of illuminance, heating, and cooling setpoints can effectively reduce energy consumption and enhance the thermal comfort of occupants in smart buildings.
- •
Introduction of an innovative fuzzy logic-based method for transforming multi-objective optimization problems into single-objective formulations.
- •
Integration of neural network, fuzzy logic, and GA methodologies to address and resolve multi-objective optimization problems.
- •
Utilization of expert insights in the optimization of setpoints within office buildings.
- •
Multi-objective optimization of setpoints, encompassing daylight illuminance, as well as heating and cooling, for multi-zone smart buildings.
The present study is organized as follows: First, the optimization problem is explained. Then, the solution method, which includes neural networks, fuzzy logic, and GA is discussed. Next, the results from the new fuzzy-based approach are shown and compared with those from the NSGA-II method for six cities in different climates. After presenting the results, a sensitivity analysis of the design variables in the final optimal solution is performed. Finally, the conclusions and suggestions for future research are provided.
2. Methodology
In this section, the procedures for multi-objective optimization are outlined. The architectural configuration of the office building is initially modeled using SketchUp software. Subsequently, the structural attributes, encompassing wall configurations and diverse scheduling parameters such as occupancy patterns, operational hours for air conditioning, and lighting systems, are specified within the OpenStudio software. Following this, an energy simulation of the building is executed through the utilization of EnergyPlus software. A neural network is then employed to construct a surrogate model, with the requisite training and testing data generated by the EnergyPlus software. In the subsequent phase, employing fuzzy logic, the multi-objective optimization problem is transmuted into a singular-objective framework. Ultimately, the optimization process is performed through the application of a GA for single-objective optimization. The schematic representation of the procedures is illustrated in Figure 1.

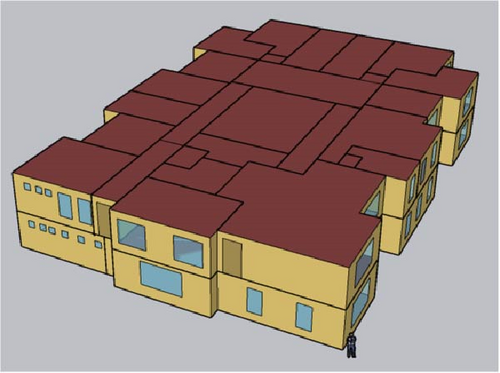
The building analyzed in this article is a two-story office structure, with its schematic illustrated in Figure 2. The total area includes 1257 m2 of air-conditioned space and 260 m2 of non-conditioned space. Each floor is divided into 21 distinct thermal zones, with individual temperature control provided by dedicated thermostats. Additionally, the illuminance in each zone is measured by a separate sensor defined in the EnergyPlus software. EnergyPlus uses the “Daylighting:Controls” object in the input file to define and configure these sensors, enabling precise simulation of daylighting performance. Table 1 presents the components of the external wall, listing their respective properties in order from the outermost layer to the innermost layer.

| Element | Thickness (m) | K (W/m.K) | ρ (kg/m3) | cp (J/kg.K) |
|---|---|---|---|---|
| External wall | ||||
| Brick | 0.02 | 1 | 1700 | 840 |
| Cement mortar | 0.03 | 0.4 | 750 | 1000 |
| Clay hollow block | 0.1 | 0.5 | 900 | 1000 |
| Polyurethane | 0.05 | 0.0245 | 24 | 1590 |
| Clay hollow block | 0.1 | 0.5 | 900 | 1000 |
| Plaster | 0.03 | 1.1 | 1300 | 1000 |
| Roof | ||||
| Waterproofing membrane | 0.005 | 0.23 | 1100 | 1000 |
| Cement board | 0.02 | 0.65 | 1800 | 1000 |
| Pumice | 0.15 | 0.12 | 400 | 1000 |
| Polyurethane | 0.05 | 0.0245 | 24 | 1590 |
| Concrete slab | 0.05 | 2.3 | 2300 | 1000 |
| Leica block | 0.3 | 0.23 | 900 | 1000 |
| Plaster | 0.03 | 1.1 | 1300 | 1000 |
The office building’s operational hours are from 7 a.m. to 4 p.m. The occupancy density is established at 0.1 person per square meter, and the power consumption attributed to electrical appliances is uniformly set at 14 W per square meter. Notably, the heating and cooling loads of the building are provided using a packaged terminal heat pump (PTHP) system, as shown in Figure 3. This system operates using electricity for both heating and cooling functions.

Various methodologies are employed to regulate the lighting within the building. As part of the daylight response strategy, each space incorporates an electricity controller or dimmer. This controller dynamically adjusts the lighting as natural light intensifies throughout the day, thereby conserving electricity. To curtail electricity consumption for illuminating different spaces, this study incorporates an intelligent lighting control system and dimmable lamps. The system operates by maintaining the lamps in an off state when the ambient brightness surpasses the predefined illuminance setpoint. In such instances, natural light suffices for the required illumination. Conversely, when the brightness falls below the illuminance setpoint, the lamps are automatically activated. This approach results in a reduction in electricity usage for interior lighting.
The illuminance setpoint for each space is determined based on its specific lighting requirements, influenced by the building’s intended purpose and spatial preferences. Notably, optimizing illuminance setpoints for various spaces within an office building is a pivotal aspect of energy management, yet it has received limited attention to date. While conventional guidelines recommend illumination ranges, no authoritative body has proposed an optimal illuminance setpoint.
To assess the efficacy of the proposed method and ascertain optimal setpoints under various weather conditions, a comprehensive investigation of the office building was conducted in six distinct cities. As delineated in Table 2, these cities are situated in diverse climatic regions of Iran, classified according to the Köppen-Geiger climate classification system [50]. The method proposed in this paper is applicable to other climates. However, the climatic conditions significantly influence the values of design variables and objective functions in the multi-objective optimization problem.
| City | Latitude (°N) | Longitude (°E) | Elevation (m) | Climate |
|---|---|---|---|---|
| Tehran | 35.7 | 51.4 | 1219 | Cold semi-arid |
| Sari | 36.6 | 53 | 132 | Hot-summer Mediterranean |
| Yazd | 31.9 | 54.4 | 1216 | Hot desert |
| Shiraz | 29.6 | 52.6 | 1585 | Hot semi-arid |
| Esfahan | 32.7 | 51.7 | 1590 | Semi-arid |
| Tabriz | 37.8 | 46.3 | 1365 | Cold desert |
The determination of optimal illuminance setpoints, coupled with the regulation of thermostat temperatures for heating and cooling systems, introduces a multi-objective optimization challenge.
This optimization effort focuses on reducing electricity consumption and improving thermal comfort for building occupants, which together form a complex multi-objective optimization problem.
2.1. Design Variables and Objective Functions
The optimization process involves minimizing two distinct objective functions: firstl, the annual CO2 emissions (ACE) resulting from the building’s energy consumption, and second, the predicted percentage of dissatisfied (PPD), which measures occupants’ thermal comfort [51]. The term “ACE ” refer to the total amount of CO2 emitted into the atmosphere each year due to the energy used by the building. This includes the energy consumed for heating, cooling, lighting, and powering appliances. The term “PPD” refers to an estimate of the percentage of people who are likely to feel uncomfortable or dissatisfied with the indoor temperature and air quality. It helps assess how effectively the air conditioning system meets the needs of the building’s occupants, based on factors such as temperature, humidity, and air movement.
Table 3 outlines the ranges of design variables, including illuminance setpoints, HVAC system setpoints, and the orientation angle of the building. The appropriate lighting levels in office spaces vary based on their functions [49]. For accounting and typing rooms, the recommended illuminance is between 300 and 700 lux (lux1), while public spaces should maintain 200–600 lux (lux2). Server rooms and archives require lower lighting levels, ranging from 100 to 400 lux (lux3), and corridors need the least illumination at 100–200 lux (lux4).
| Design variable | Range |
|---|---|
| lux1 (lux) | 300–700 |
| lux2 (lux) | 200–600 |
| lux3 (lux) | 100–400 |
| lux4 (lux) | 100–200 |
| HSP (°C) | 17–22 |
| CSP (°C) | 22–27 |
| θ (deg) | 0–360 |
2.2. Neural Networks
The primary goal of incorporating a neural network in this study is to establish a surrogate model for simulating objective functions in the building during the optimization process. A surrogate model serves as a cost-effective alternative to the original high-cost model. These models are constructed by formulating a mathematical representation based on data acquired from simulations. Their primary aim is to enhance efficiency by reducing costs while maintaining adequate accuracy. Various methods can be used to create surrogate models; however, this research employs a neural network, given its effectiveness in approximating system behavior. The ultimate goal is to replace the EnergyPlus software in the optimization process, achieving a balance of cost reduction, increased speed, and accurate representation of the objective functions.
A feed-forward backpropagation neural network has been employed to construct the surrogate model, emulating the behavior of the EnergyPlus software [52]. The neural network consists of an input layer, an output layer, and two hidden layers with 20 and 2 neurons, respectively, as shown in Figure 4. The input layer includes 7 design variables, while the output layer represents the two objective functions. To train the neural network, 5000 sample points were generated using the EnergyPlus software, with 80% of the data used for training and 20% for testing.

To assess the precision of the surrogate model, two statistical metrics for objective functions are calculated and presented in Table 4. These metrics encompass R2 (the absolute fraction of variance) and MSE (Mean Squared Error), as defined below:
| Objective parameter | ACE | PPD |
|---|---|---|
| R2 | 0.998 | 0.996 |
| MSE | 0.0001 | 0.0001 |
In these equations, y, , and n represent true values, predicted values, and the number of data points, respectively. As depicted in Table 4, MSE for both objective parameters approaches zero, and R2 approaches one. As a result, the surrogate model produces results close to those from EnergyPlus simulations.
After confirming the satisfactory accuracy of the developed neural network, a comparison of computational time between the neural network and the EnergyPlus software is conducted. With a consistent set of inputs, EnergyPlus takes 113 s to compute the objective functions, while the surrogate neural network completes the same task in just 1.13 s, reflecting a remarkable 99% reduction in time. This outcome demonstrates the successful achievement of the goals behind creating the surrogate model, balancing both accuracy and significant computational efficiency.
2.3. Fuzzy Logic
As outlined, leveraging the expertise and skills of an expert is a crucial element of fuzzy logic. In this article, expert knowledge is incorporated into the optimization process using fuzzy rules. Additionally, a multi-objective optimization problem is transformed into a single-objective optimization problem through fuzzy logic, improving both the speed and accuracy of the optimization process.
The procedural sequence involves entering the objective functions derived from the surrogate model into the fuzzy system as input parameters. The fuzzy system then generates a fuzzy objective function, illustrating the behavior of the two objective functions as output. It is worth noting that the variability of the resultant function ranges from zero to one, with values closer to one indicating better performance of the fuzzy objective function. This phenomenon is illustrated in Figure 5.

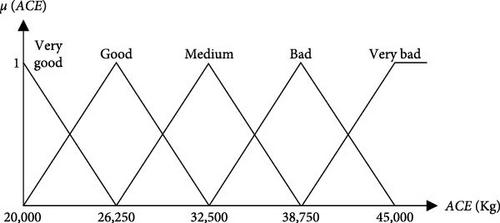
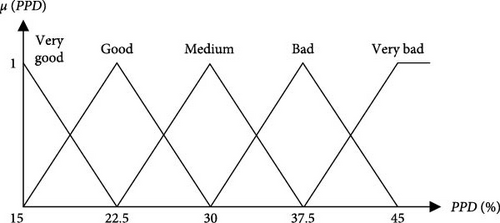
To formulate the fuzzy objective function, the expert begins by identifying the minimum and maximum values for each objective function. The range between these extremes is then divided into multiple regions, which the expert defines and describes using linguistic terms, based on their experience and the optimization objective. For instance, in the context of a minimization problem, the region proximate to the minimum value of the objective function is deemed the optimal area, and conversely for maximization. This procedural methodology, illustrated in Figure 6 for a minimization scenario, is reiterated for each subsequent objective function within the optimization problem.

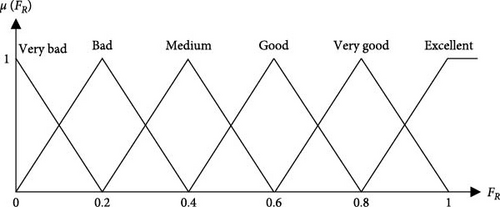
In the subsequent step, an analogous procedure is applied to the output of the fuzzy system. In this step, the expert partitions the range between zero and one into distinct areas, leveraging his expertise. Notably, the proximity of the fuzzy system’s output to one is indicative of superior numerical values for the objective functions, while conversely, a closer proximity to zero suggests less favorable numerical outcomes. Essentially, a numeric value of one signifies that the behavior of the objective functions aligns more closely with the ideal state, as perceived through the lens of optimization goals and expert insights. This process for an optimization problem is illustrated in Figure 7.

To enhance comprehension regarding the formulation of a fuzzy objective function, an exploration of the operational procedure of a fuzzy system is undertaken. Figure 8 illustrates this procedural sequence. It is evident from the diagram that fuzzy systems comprise four integral components, namely: a fuzzifier, a fuzzy rule base, an inference engine, and a defuzzifier. The role of the fuzzifier is to convert input values into corresponding fuzzy sets. Subsequently, these sets are fed into the inference engine, wherein, based on pre-established fuzzy rules, decisions pertaining to the given input are determined. Generally, fuzzy rules are created based on the experience of experts, as there are no fixed methods for their development. Experts formulate these rules using their knowledge of the system. The fuzzy inference engine is a mathematical process used to combine fuzzy rules and make decisions. However, since the outputs of the fuzzy inference engine are not directly applicable in the real world, they must be converted into a crisp form. This conversion is performed by the defuzzifier.

This process strategically incorporates the expertise and knowledge of the expert. Transforming a multi-objective optimization problem into a single-objective framework greatly simplifies implementation complexity. An additional advantage of this methodology lies in its flexibility, as the expert can readily adjust the degree of importance (weight) assigned to each objective function. Through the modification of fuzzy rules, the expert can apply insightful adjustments during the optimization process.
In this equation, represents the center of the fuzzy set, μ denotes the membership function, m signifies the number of fuzzy rules, which is 25 in this study, n corresponds to the number of inputs, set at 2, x signifies the inputs of the fuzzy system (ACE and PPD), and A is the notation used to characterize the considered fuzzy sets. The membership functions associated with both the primary objective functions and the resultant fuzzy objective function within their specified ranges are visually presented in Figure 9. Figure 9 a, b show the membership functions of the primary objective functions (as inputs for the fuzzy logic system), while Figure 9 c illustrates the membership function of the resultant fuzzy function (as output of the fuzzy logic system). The ranges of the primary objective functions and the resultant fuzzy function are divided into five and six segments, respectively, based on expert knowledge and experience.
A notable advantage of the employed methodology is the designer’s capacity to adjust the degree of importance assigned to each objective function based on the experiential insights. To illustrate this capability, three distinct sets of fuzzy rules have been formulated, and optimization has been conducted for each one.
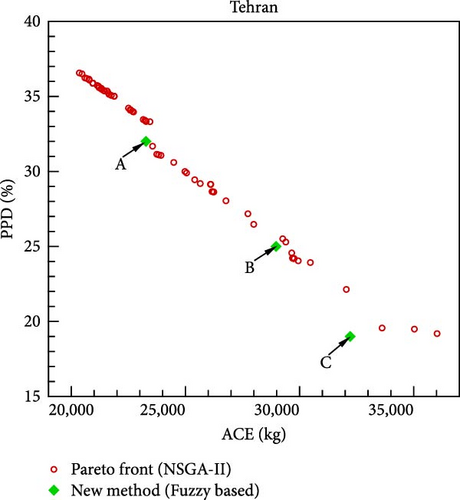
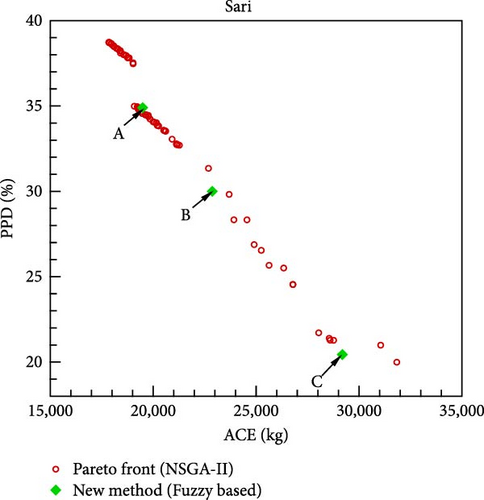
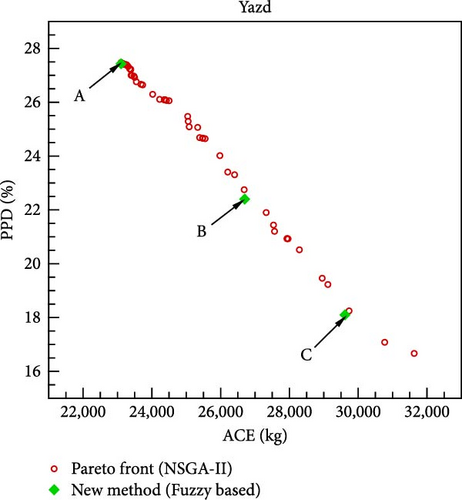
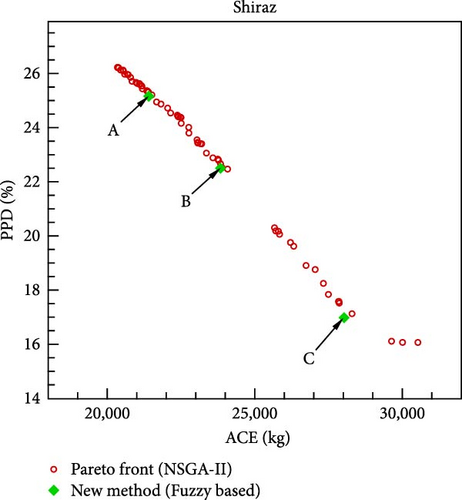
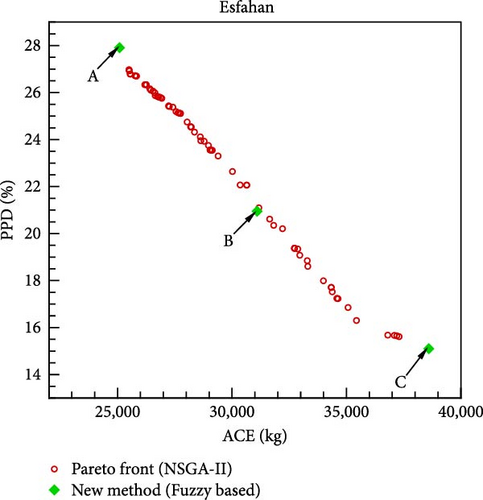
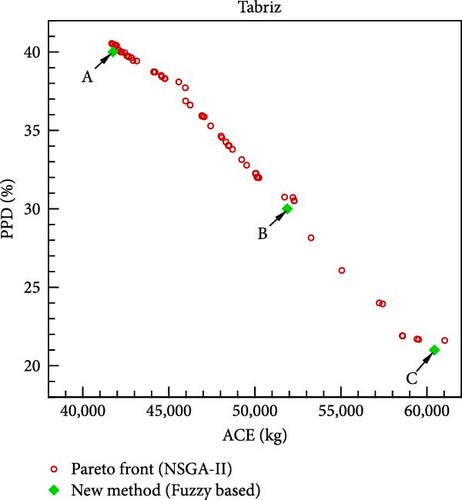
In the first set of fuzzy rules, emphasis is placed on the objective function of ACE, signifying that, from a planning perspective, optimizing annual CO2 emissions takes precedence over optimizing the thermal comfort of residents. This emphasis is marked by point A in Figure 10. In the second set of fuzzy rules, an equal degree of importance is assigned to both objective functions. In essence, this scenario denotes that the CO2 emissions resulting from building energy consumption and the thermal comfort of residents are deemed equally significant by the designer. This equal importance is marked by point B in Figure 10. In the third set of fuzzy rules, priority is given to the objective function of PPD, emphasizing the thermal comfort of residents. This prioritization is represented by point C in Figure 10. The corresponding sets of fuzzy rules for the city of Tehran are presented in Tables 5–7, respectively.
| PPD | ACE | ||||
|---|---|---|---|---|---|
| Very good | Good | Medium | Bad | Very bad | |
| Very good | Excellent (1) | Excellent (1) | Very good (0.6) | Good (0.4) | Medium (0.2) |
| Good | Excellent (1) | Excellent (0.8) | Good (0.6) | Good (0.4) | Medium (0.2) |
| Medium | Very good (1) | Very good (0.8) | Medium (0.6) | Medium (0.4) | Medium (0.2) |
| Bad | Medium (0.8) | Medium (0.8) | Medium (0.4) | Bad (0.2) | Bad (0) |
| Very bad | Medium (0.8) | Bad (0.8) | Bad (0.4) | Very bad (0.2) | Very bad (0) |
| 1. If ACE is very good and PPD is very good then fuzzy cost function is excellent (1). | |||||
| 2. If ACE is very good and PPD is good then fuzzy cost function is excellent (1). | |||||
| 3. If ACE is very good and PPD is medium then fuzzy cost function is good (1). | |||||
| 4. If ACE is very good and PPD is bad then fuzzy cost function is medium (0.8). | |||||
| 5. If ACE is very good and PPD is very bad then fuzzy cost function is medium (0.8). | |||||
| 6. If ACE is good and PPD is very good then fuzzy cost function is excellent (1). | |||||
| 7. If ACE is good and PPD is good then fuzzy cost function is excellent (0.8). | |||||
| 8. If ACE is good and PPD is medium then fuzzy cost function is very good (0.8). | |||||
| 9. If ACE is good and PPD is bad then fuzzy cost function is medium (0.8). | |||||
| 10. If ACE is good and PPD is very bad then fuzzy cost function is bad (0.8). | |||||
| 11. If ACE is medium and PPD is very good then fuzzy cost function is very good (0.6). | |||||
| 12. If ACE is medium and PPD is good then fuzzy cost function is good (0.6). | |||||
| 13. If ACE is medium and PPD is medium then fuzzy cost function is medium (0.6). | |||||
| 14. If ACE is medium and PPD is bad then fuzzy cost function is very medium (0.4). | |||||
| 15. If ACE is medium and PPD is very bad then fuzzy cost function is bad (0.4). | |||||
| 16. If ACE is bad and PPD is very good then fuzzy cost function is good (0.4). | |||||
| 17. If ACE is bad and PPD is good then fuzzy cost function is good (0.4). | |||||
| 18. If ACE is bad and PPD is medium then fuzzy cost function is medium (0.4). | |||||
| 19. If ACE is bad and PPD is bad then fuzzy cost function is bad (0.2). | |||||
| 20. If ACE is bad and PPD is very bad then fuzzy cost function is very bad (0.2). | |||||
| 21. If ACE is very bad and PPD is very good then fuzzy cost function is medium (0.2). | |||||
| 22. If ACE is very bad and PPD is good then fuzzy cost function is medium (0.2). | |||||
| 23. If ACE is very bad and PPD is medium then fuzzy cost function is medium (0.2). | |||||
| 24. If ACE is very bad and PPD is bad then fuzzy cost function is bad (0). | |||||
| 25. If ACE is very bad and PPD is very bad then fuzzy cost function is very bad (0). | |||||
| PPD | ACE | ||||
|---|---|---|---|---|---|
| Very good | Good | Medium | Bad | Very bad | |
| Very good | Excellent (1) | Excellent (1) | Very good (0.8) | Good (0.6) | Medium (0.4) |
| Good | Excellent (1) | Excellent (1) | Good (0.6) | Good (0.6) | Bad (0.2) |
| Medium | Very good (0.8) | Good (0.6) | Good (0.6) | Medium (0.4) | Bad (0.2) |
| Bad | Good (0.6) | Good (0.6) | Bad (0.2) | Medium (0.4) | Bad (0.2) |
| Very bad | Medium (0.4) | Bad (0.2) | Very bad (0) | Bad (0.2) | Very bad (0) |
| PPD | ACE | ||||
|---|---|---|---|---|---|
| Very good | Good | Medium | Bad | Very bad | |
| Very good | Excellent (1) | Excellent (1) | Very good (1) | Good (0.8) | Good (0.6) |
| Good | Very good (1) | Very good (1) | Very good (0.8) | Medium (0.6) | Medium (0.4) |
| Medium | Good (0.8) | Medium (0.8) | Medium (0.6) | Very bad (0.2) | Bad (0) |
| Bad | Medium (0.6) | Bad (0.6) | Very bad (0) | Very bad (0) | Bad (0) |
| Very bad | Bad (0.2) | Bad (0.2) | Very bad (0) | Very bad (0) | Very bad (0) |
2.4. Optimization Algorithm
Following the conversion of the multi-objective optimization problem into a single-objective formulation, the subsequent resolution of this problem necessitates the application of a suitable optimization method. In this research, the GA has been selected as the optimization method due to its effectiveness in solving complex optimization problems [54]. GA is a powerful tool for solving real-world and practical optimization problems, renowned for its ability to explore complex and large search spaces, find global optima, and handle diverse objective functions, whether differentiable or non-differentiable, convex or non-convex. It is versatile, robust, and well-suited to various problem domains, particularly when the search space is noisy or poorly understood. The parameters configured for GA is this paper are delineated in Table 8.
| Parameters | Value |
|---|---|
| Population | 100 |
| Generation | 80 |
| Mutation rate | 0.1 |
| Selection rate | 0.5 |
- 1.
The number of segments chosen for the initial objective functions affects the complexity of the solution. Increasing the number of segments results in a higher number of fuzzy rules, which in turn lengthens the solution process.
- 2.
The neural network requires a sufficient amount of training data to achieve adequate accuracy. However, exceeding the necessary amount of data increases both the cost and the time needed for data collection.
- 3.
Defining fuzzy rules requires significant expert knowledge and experience. If these rules are not accurately defined, the proposed method’s accuracy will be compromised.
3. Results and Discussions
3.1. Multi-Objective Optimization of the Objective Functions
Upon optimizing the fuzzy objective function through the utilization of a GA, the outcomes for various scenarios and cities are delineated in Figure 10. The distinctive points A, B, and C shown in this diagram are derived from the application of fuzzy rules defined in Tables 5–7, respectively. The corresponding values of the design variables and objective functions at these three points are listed in Table 9. Notably, in the formulation of the fuzzy objective function, design emphasis is placed on the ACE objective function at point A and on the PPD objective function at point C, while equal priority is given to both objective functions at point B. If minimizing CO2 emissions from the building’s energy consumption is prioritized as the design goal, point A is considered the optimal solution. Conversely, if the primary focus is on residents’ comfort, point C becomes the best choice. In this study, point B is identified as the final optimal solution, as it assigns equal importance to both objective functions.
| Point | lux1 | lux2 | lux3 | lux4 | θ (deg) | HSP (°C) | CSP (°C) | ACE (kg) | PPD (%) |
|---|---|---|---|---|---|---|---|---|---|
| (a) Tehran | |||||||||
| A | 361.79 | 351.02 | 246.03 | 113.6 | 78.25 | 18.35 | 26.21 | 26211 | 28.59 |
| B | 685.17 | 200.26 | 383.17 | 101.06 | 69.6 | 20.15 | 26.97 | 28972 | 25 |
| C | 693.4 | 210.56 | 360 | 101.48 | 71.93 | 21.2 | 26.6 | 31775 | 21 |
| (b) Sari | |||||||||
| A | 506.27 | 434.8 | 150.2 | 177.04 | 104.21 | 17.13 | 26.98 | 19484 | 34.9 |
| B | 300.29 | 200.96 | 107.2 | 100.26 | 63.03 | 19.56 | 26.8 | 22868 | 30 |
| C | 623.36 | 201.09 | 104.07 | 100.56 | 70.36 | 21.99 | 26.15 | 29191 | 20.44 |
| (c) Yazd | |||||||||
| A | 318.66 | 201.1 | 110.79 | 100.64 | 3.83 | 17.1 | 26.98 | 23106 | 27.43 |
| B | 507.4 | 202.2 | 333 | 101.68 | 2.75 | 19.95 | 26.98 | 26700 | 22.4 |
| C | 655.4 | 202.75 | 116.8 | 101.4 | 295.1 | 21.3 | 26.97 | 29615 | 18.1 |
| (d) Shiraz | |||||||||
| A | 534.75 | 202.44 | 170.4 | 100.14 | 76.4 | 17.8 | 26.66 | 21409 | 25.16 |
| B | 699 | 201.4 | 274.05 | 100.5 | 75.73 | 19.44 | 26.5 | 23840 | 22.5 |
| C | 554.67 | 201.08 | 313.4 | 100.45 | 72.55 | 21.99 | 26.99 | 28028 | 16.98 |
| (e) Esfahan | |||||||||
| A | 323.1 | 203.58 | 122.16 | 101.54 | 0.265 | 17.02 | 26.99 | 25084 | 27.91 |
| B | 679.29 | 201.68 | 101.54 | 100.69 | 76.29 | 20.17 | 26.99 | 31097 | 20.95 |
| C | 681.1 | 591.5 | 260.78 | 100.01 | 359.3 | 21.99 | 25.75 | 38600 | 15.1 |
| (f) Tabriz | |||||||||
| A | 323.89 | 200.71 | 107.34 | 100.4 | 48.48 | 17 | 26.99 | 41755 | 40 |
| B | 388.15 | 436.02 | 172.63 | 111.26 | 65.36 | 20.07 | 26.84 | 51884 | 30 |
| C | 484.05 | 595.71 | 393.98 | 198.51 | 74.11 | 21.98 | 25.68 | 60433 | 21 |
To evaluate the effectiveness of the proposed methodology, the multi-objective optimization problem is solved using the NSGA-II method, and the resulting Pareto front for different cities is shown in Figure 10. Since the primary design goal is to minimize the objective functions, the method yielding lower objective function values at the design point is deemed more suitable. As shown in Figure 10, the novel fuzzy-based method consistently outperforms the NSGA-II approach in identifying optimal design points across all cities. A key advantage of the proposed methodology is its ability to present three designated design points, rather than a Pareto front for each city, allowing the selection of a single final optimal point based on design priorities. Additionally, the implementation time for the novel fuzzy-based and NSGA-II methods is 61 s and 122 s, respectively. Consequently, the newly introduced methodology demonstrates a superior computational efficiency.
According to the findings presented in Table 9, at the final optimal point across all cities (denoted as B), the heating setpoint closely approximates 20°C, while the cooling setpoint is in proximity to 27°C. Moreover, the optimal orientation angle of the building (θ) and the optimal illuminance setpoint (lux) depend on the specific climatic conditions of each city and the degree of natural sunlight utilization. The minimum value of θ is associated with the city of Yazd, characterized by a hot desert climate, and amounts to 2.75°. Notably, in Yazd, the optimal building orientation aligns closely with the north-south axis. Conversely, in other cities, θ approximates 70°, specifically measuring around 75° in Shiraz and Esfahan, and ~65° in Sari and Tabriz.
According to the data in Table 9, the illuminance level, lux1, is ~700 lux in Tehran, Shiraz, and Esfahan, while in Sari, it is closer to 300 lux. The lux2 value is around 200 lux across all cities except Tabriz, where it is ~400 lux. The lux3 value is close to 100 lux in Sari and Esfahan, whereas in Tehran, it reaches around 400 lux. Finally, lux4 remains consistent at ~100 lux in all the cities analyzed.
Establishing the optimal illuminance setpoint, similar to heating and cooling setpoints, in each space and city requires a multi-objective optimization approach. This is essential because it has a dual impact: it affects electricity consumption and annual CO2 emissions while also playing a key role in ensuring the thermal comfort of residents.
The results indicate that, in terms of the PPD parameter, the new fuzzy-based method outperforms NSGA-II in Tehran, achieving a maximum reduction of 3.9% at point A. Similarly, for the ACE parameter, the method demonstrates optimal performance in Sari, reducing the ACE value by 6% at point C compared to NSGA-II. If PPD and ACE parameters are considered equally important in the design process, the efficacy of the new method is highest in Tehran. At point B in Tehran, the method achieves a 2% reduction in PPD and a 1% reduction in ACE compared to the NSGA-II method. As a result, the new method reduces the building’s annual energy consumption and CO2 emissions while improving residents’ thermal comfort.
Analyzing Table 9, it is evident that the highest thermal comfort level is associated with point C in Esfahan, where the corresponding PPD value (15%) is lower than other locations. Conversely, the lowest thermal comfort level is attributed to point A in Tabriz, with a PPD of 40%. Regarding annual CO2 production, the least amount is linked to point A in Sari, totaling 19,484 kg, while the highest corresponds to point C in Tabriz, reaching 60,433 kg. This is attributed to Tabriz’s cold desert climate, resulting in higher annual energy consumption for heating compared to other cities.
The new method presented in this article can also be applied to different types of buildings, more complex layouts, or additional thermal zones. However, for buildings where the HSP and CSP values differ across spaces (such as hospitals), the number of design variables increases. This results in greater complexity in implementing the method and extends the time required for training the neural network and completing the optimization process. One of the main challenges for neural networks is ensuring access to sufficient and accurate data for training. If this data can be provided using appropriate software or other techniques, this challenge can be effectively addressed. For fuzzy logic, the primary challenge lies in the availability of expertise for creating fuzzy rules. With such expertise, no significant challenges are anticipated.
3.2. Sensitivity Analysis
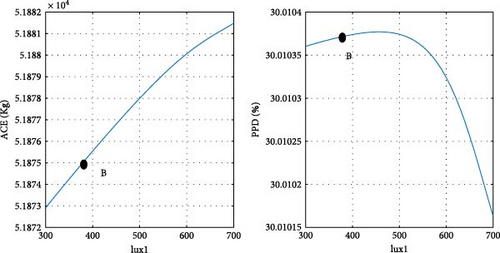
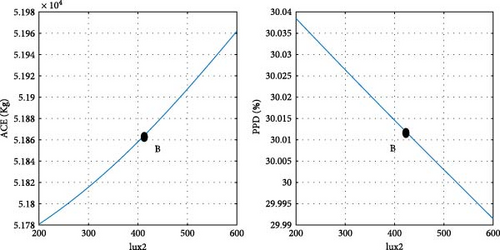
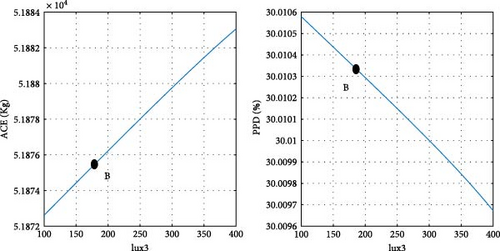
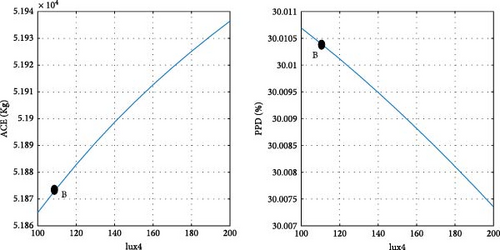
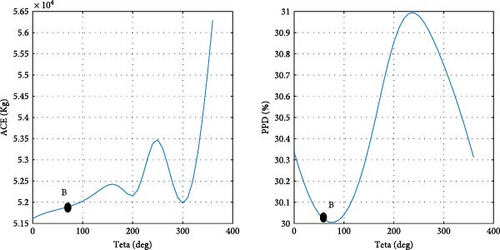
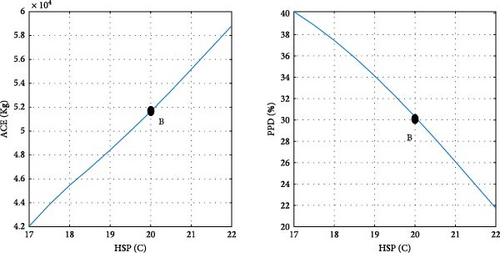
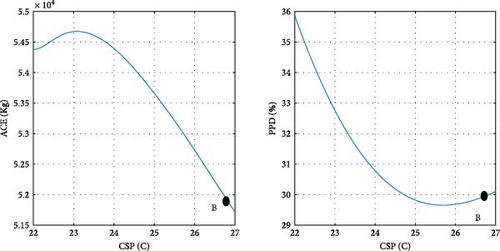
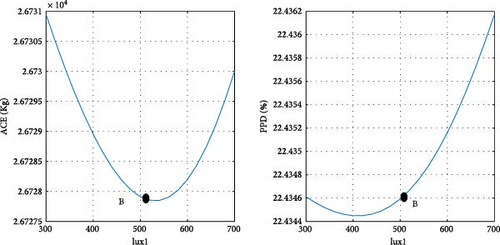
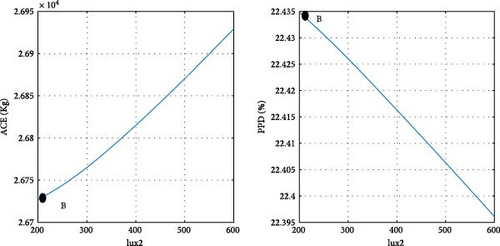
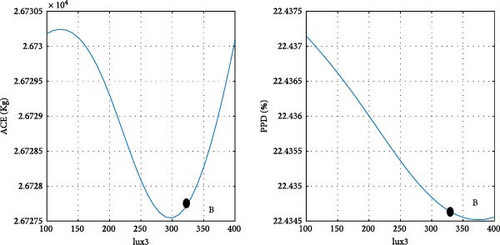
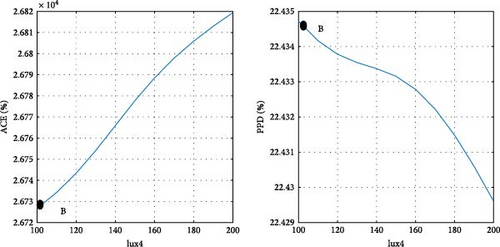
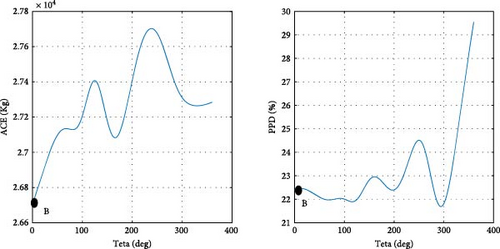
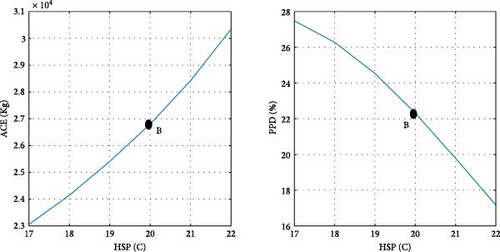
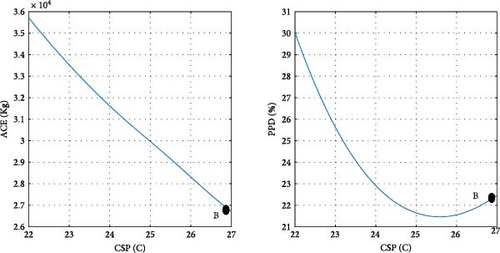
After determining the optimal design point, it is advantageous to evaluate the magnitude of changes in the objective functions concerning the design variables. Figure 11 illustrates the ACE and PPD functions in relation to the design parameters at point B, specifically pertaining to the city of Tehran. Point B, as depicted in Figure 10 a, is also visually represented in Figure 11. As previously noted, at the optimal point B, both objective functions are given equal priority. Details regarding the design variables and objective functions associated with point B in Tehran are provided in Table 8.

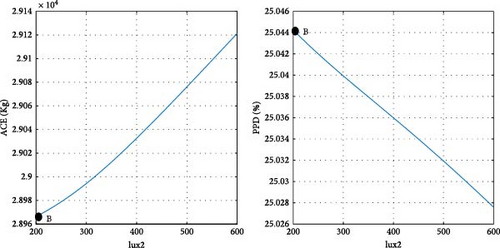
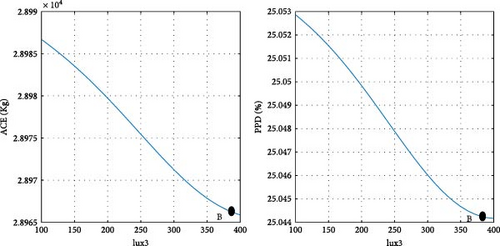
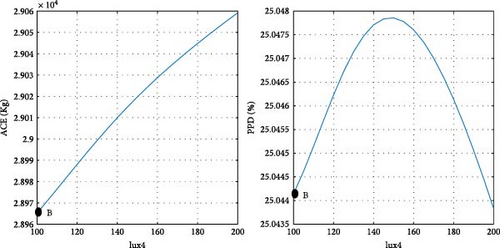
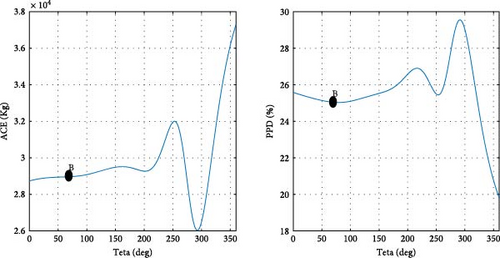
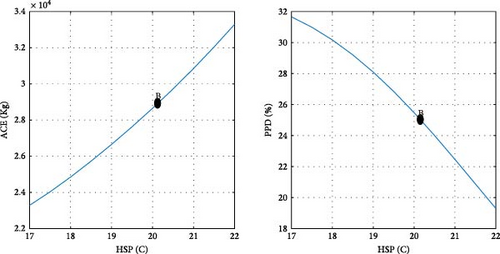
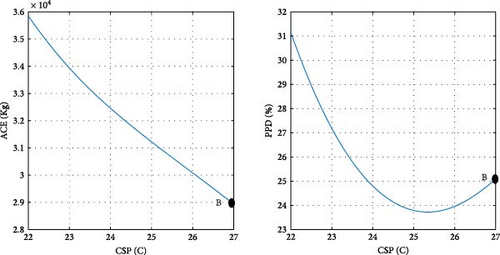
To clarify the impact of design variables on the objective functions at point B, a systematic approach is employed. The values of the design variables are held constant, except for one, which is varied within its predefined range at each step. The resulting effects on the objective functions are then observed and carefully analyzed.
According to the findings illustrated in Figure 11, the heating setpoint (HSP) exerts the most significant influence on the objective functions compared to other design parameters. In Tehran specifically, as the HSP increases from 17 to 22, the ACE value exhibits a 41.9% increase, while the PPD value undergoes a 39% decrease. Furthermore, the impact of cooling setpoint (CSP) on the objective functions is comparatively lesser than that of the HSP. With the increase of the CSP parameter from 22 to 27, both ACE and PPD values register a decrease of 19%. The influence of the variable θ’ on the objective functions is more pronounced than that of the CSP and less significant than the HSP. As θ increases from 0 to 355°, there is a 30% increase in ACE, and concurrently, a 20% decrease in PPD. Among the design variables, it is noteworthy that lux1 exhibits the minimal impact on the objective functions, amounting to less than 1%.
The performance of the new fuzzy-based method in determining the final optimal point (B) is illustrated in Figure 11. As previously emphasized, the goal of the multi-objective optimization in this article is the minimization of the ACE and PPD. Due to the inherent characteristics of the problem, simultaneous optimization of the objective functions is not feasible.
In the case of parameters lux1 and lux3, the new method selects point B toward the end of the range. This decision aligns with the decreasing trend of the objective functions concerning these design variables. Regarding the cooling setpoint parameter, despite a slight upward trend in the PPD chart toward the end of the range, the new method advocates for point B near the end of the range due to the downward trend in ACE. For the lux4 parameter, where ACE increases with the design variable and PPD initially rises, point B is considered at the beginning of the range. In the case of the lux2 parameter, despite the ascending trend of ACE and the descending trend of PPD with the design variable, point B at the beginning of the range is chosen, as the impact of lux2 on ACE is deemed more significant than its effect on PPD. Concerning the heating setpoint parameter, where ACE exhibits an ascending trend and PPD a descending trend with the design variable, point B is proposed between the range to ensure equal prioritization of both objective functions. As for the parameter θ, since the minimum value of the objective functions does not occur at a singular point, the proposed method selects point B between the range to optimize both objective functions to an equal extent. The graphical representation in Figure 11 demonstrates the soundness of the results achieved by the new method in identifying the final optimal point (B). To conduct a more comprehensive sensitivity analysis, Figures 12 and 13 illustrate the impact of design variables on the objective functions for the cities of Tabriz and Yazd, which have climates different from Tehran. The results indicate that the influence of design variables on the objective functions in these two cities is consistent with Tehran, with the highest impact observed for HSP and the lowest for lux1.
4. Conclusions
- •
The novel method integrates expert knowledge in formulating fuzzy rules, which contributes to the improvement of the results.
- •
The fuzzy-based approach outperforms the NSGA-II method across all cities. In Tehran, for instance, the new method reduces PPD and ACE values by 2% and 1%, respectively, compared to the NSGA-II method at the final optimal point.
- •
The proposed fuzzy-based method proves to be more straightforward than alternative multi-objective optimization techniques such as NSGA-II, concurrently achieving a 50% reduction in computational time.
- •
The surrogate model, employing neural network technology to estimate objective function values, exhibits a negligible error of less than 1% relative to EnergyPlus software output. This surrogate model significantly reduces the time required for objective function estimation by 99% compared to EnergyPlus software, serving as a pivotal input to the fuzzy logic component.
- •
The optimization results, derived by prioritizing specific objective functions, yield three distinct points—A, B, and C—based on predefined fuzzy rules. In this paper, point B is designated as the final optimal point, reflecting equal priority given to both reducing CO2 emissions and improving residents’ thermal comfort.
- •
The HSP parameter is the most influential among the design variables, whereas the lux1 parameter has the least impact on the objective functions.
The integration of neural networks, fuzzy logic, and GAs offers a robust framework for tackling multi-objective optimization problems, especially in the field of energy management in buildings. Future work could explore the inclusion of additional objective functions, such as the discomfort glare index (DGI), broadening the scope of this methodology to handle three-objective optimization problems.
Conflicts of Interest
The authors declare no conflicts of interest.
Funding
No funding was received for this research
Open Research
Data Availability Statement
The data will be made available by the corresponding author upon reasonable request.


