System Optimization of Multistack and Multimotor Powertrain for Fuel Cell Electric Vehicles
Abstract
Multistack and multimotor powertrain systems have significant potential for improving the efficiency and performance of fuel cell electric vehicles (FCEVs) compared to conventional powertrain systems. To achieve a superior powertrain system, the major components such as the stack, motor, and transmission of the multistack and multimotor systems should be optimized. To analyze the energy efficiency and dynamic performance of the FCEV, an FCEV analysis model was developed. This model included a two-stack and two-motor powertrain system (2S2M) employing a stack power and motor torque distribution strategy. An optimization problem was formulated with stack transition power, motor torque distribution, and transmission gear ratios as the optimization variables and hydrogen consumption and acceleration time as the objectives for efficiency and performance measures, respectively. An artificial neural network (ANN) model-based optimization method was used to address the computational burden of multiobjective optimization. The optimization results highlighted the Pareto front for the FCEV employing 2S2M, showing a trade-off relationship between the efficiency and performance of the FCEV. Compared to the conventional powertrain system, the 2S2M can reduce hydrogen consumption and acceleration time by up to 7.9% and 6.2%, respectively. An analysis of the distribution of optimal solutions and a comparison of the Pareto fronts for each optimization variable highlighted the necessity for the proposed system optimization method. Furthermore, a comparison between the FCEV and ANN models in terms of computational time for the optimization demonstrated the effectiveness of the ANN model-based multiobjective optimization.
1. Introduction
Owing to increasing CO2 emissions, the vehicle market has been focusing on the development of electric vehicles (EVs) [1], such as battery electric vehicles (BEVs) and fuel cell electric vehicles (FCEVs). BEVs have the shortcomings of heavy battery mass and long charging time, whereas FCEVs have the advantages of a light hydrogen fuel tank mass and shorter charging time than BEVs [2]. In addition, since using liquid fuel systems has the advantages of higher energy density and simpler refueling processes than battery-based systems, hydrogen-based systems are acceptable for the industry of energy storage fields [3]. Therefore, FCEVs are considered an essential part of future EV development despite the disadvantages of high vehicle and hydrogen prices and a lack of hydrogen charging stations [4]. In general, powertrain systems significantly affect the main driving requirements, such as energy efficiency and dynamic performance. The powertrain system of an FCEV can be classified into two parts: (i) energy sources and (ii) traction components. The energy sources comprise a fuel cell stack and high-voltage battery, and the traction components comprise a motor and transmission. Therefore, optimization that considers each part of the powertrain system is required to maximize FCEVs’ energy efficiency and dynamic performance.
For energy sources, most previous works have studied various energy management strategies between stack and battery. Here, several studies focused on single-stack fuel cells for use in FCEVs. However, multistack fuel cell systems, comprising two or more stacks, offer several advantages over their single-stack fuel cell systems in terms of price, life, modularity, sudden failure, and energy density [5]. In addition, this system can enhance the output power, life cycle cost, and remaining useful life [6]. For traction components, numerous studies have been conducted on single-motor with single-speed transmission for FCEVs. However, multimotor with multispeed transmission systems have advantages, such as optimal motor operation, rapid acceleration, and high maximum speed [7]. As such, optimizing multistack and multimotor powertrain systems is expected to improve FCEVs’ efficiency and performance.
A review of recent studies on optimizing FCEVs suggests the following: First, while some studies have explored the use of multistack systems in FCEVs [5, 6, 8–11], these studies on FCEV optimization have thus far focused on single-motor and single-speed traction systems. Although some studies have been conducted on multimotor FCEVs [12, 13], these studies only focused on improving motor performance and did not perform the optimization. Second, they optimized the energy management strategy between the stacks and the battery in an energy storage system (ESS) without considering the motor and transmission of the traction system. Third, these studies primarily employed hydrogen energy efficiency as the objective, and several studies also considered the lifetime of fuel cells and batteries. Although dynamic performance metrics such as acceleration ability, ascendable gradient, and maximum vehicle speed are as critical as energy efficiency, they were not typically considered in previous studies, because they are related to traction systems and not to ESSs. This review identifies three key requirements for FCEVs that were not considered in previous studies: (i) new traction systems (multimotor and multispeed), (ii) additional optimization components (motor and transmission), and (iii) additional objectives (dynamic performance).
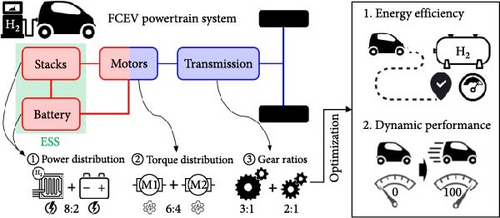
To achieve the aforementioned key requirements for FCEVs, it is appropriate to consider the studies for system optimization of BEVs. Several studies have optimized the dual-motor and multispeed (two [14–16], three [17], and four speeds [18, 19]) powertrain systems for BEVs. Although a single-motor and multispeed system has widely been studied for BEVs, a dual-motor and two-speed system has several advantages compared to the single-motor and multispeed system. This system may not require a gear-shifting function because each motor is connected to each gear. Therefore, it has the advantages of no torque interruption owing to gear-shifting and high transmission efficiency because there is no separate gear-shifting device [15]. In addition, since this system can independently control each motor to operate the high-efficiency region according to the vehicle driving conditions, the energy efficiency of EVs can be improved [7]. For the optimization parameters of multimotor and multispeed systems, previous studies have mainly adopted the motor torque distribution between two motors [14, 15, 17–19] and each speed gear ratio of the transmission [15]. In addition, while the aforementioned studies have mainly focused on improving the energy efficiency of EVs, some have also focused on enhancing their dynamic performance. In summary, system optimization should be performed to achieve a superior powertrain system for FCEV, as shown in Figure 1.
To enhance the efficiency and performance of FCEVs, it is important to consider the trade-off relationship between these two objectives during the optimization. This is because high-efficiency powertrain systems often exhibit low performance and vice versa [20]. Therefore, a single-objective optimization method that provides only one optimal solution would not be appropriate for this problem. Instead, a multiobjective optimization method is more suitable as it can provide multiple optimal solutions. Considering both objectives, this method appropriately handles the trade-off relationship by exhibiting a Pareto front. However, solving multiobjective optimization problems involves an excessive computational burden compared to single-objective optimization. Alternatively, several studies used an artificial neural network (ANN) model, which predicts the relationship between inputs and outputs from sample results for the various fields of vehicle optimization. ANN models with high predictive accuracy allow for efficient optimization using only sample results.
- •
While previous studies have only focused on single- or multistack with single-motor and single-speed traction systems for FCEVs, this study proposes a multistack with a multimotor and multispeed traction system to improve the efficiency and performance of FCEVs. An FCEV analysis model was also developed, including the proposed powertrain system to analyze FCEV quantitative measures.
- •
Previous studies on FCEV only optimized energy management strategies between fuel cell stacks and high-voltage batteries of ESSs to improve energy efficiency. This study proposes an ESS power and motor torque distribution strategy based on the component efficiencies of the motors, inverters, and stacks to further enhance the FCEV energy efficiency.
- •
This paper proposes an optimization problem that includes the optimization variables of the stack, motor, and transmission, unlike the optimizations that focused only on the stacks in previous studies. The optimization results demonstrate the need for multiobjective optimization for both the efficiency and performance of FCEVs. The superiority of the proposed system for FCEVs was compared to previous powertrain systems.
2. Multistack and Multimotor FCEV Modeling
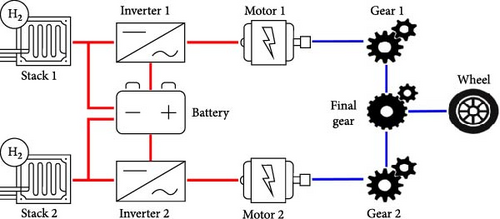
The detailed powertrain configuration of the multistack and multimotor FCEV is shown in Figure 2. Each stack supplies DC power to its respective inverter, which performs DC/AC conversion and transfers AC power to its corresponding motor. The motors then convert electric power into mechanical torque and deliver it for each speed gear. The speed gears multiply the input torque of each motor, and these resulting torques are transmitted to the final gear, which further multiplies the torque and delivers it to the wheels. In addition, a high-voltage battery supplies electric power to each motor through inverters and is charged by the stack power and regenerative motor braking power. Here, the motor, inverter, and stack specifications were identical on both sides. The hydrogen consumption and vehicle speed values of the FCEV were used to evaluate energy efficiency and dynamic performance, respectively. The detailed equations for the FCEV model used to calculate these measures are provided below.
2.1. Electrical Power
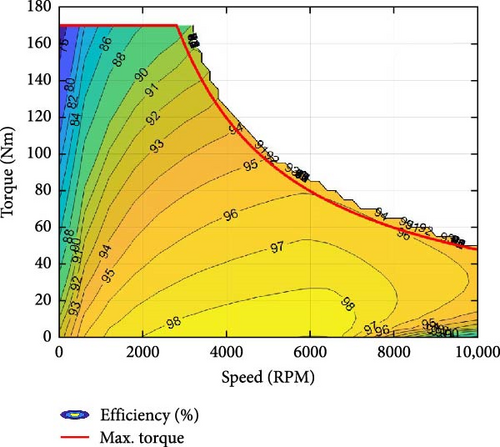
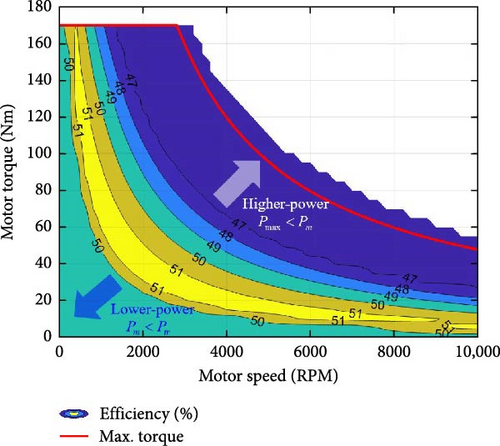
Subscripts 1 and 2 represent the first- and second-motor sides, respectively. Here, the efficiency of each motor and inverter depends on the motor’s torque and speed, as shown in Figure 3. Therefore, operating motors in high-efficiency areas is advantageous in terms of energy.

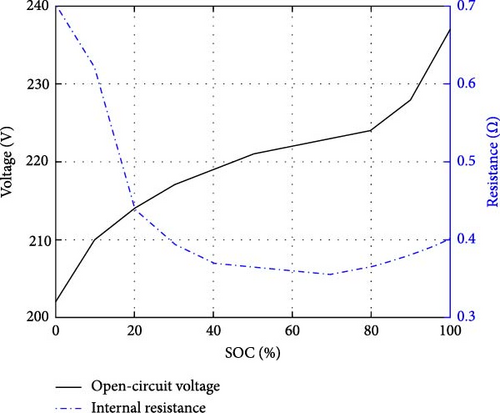
Here, the values of VOCV and Rin vary with the state of charge (SOC) of the battery, as shown in Figure 5 [5]. The SOC can be calculated by integrating the battery current (Ib) as follows:
Although the battery performance depends on the working temperature in the real-world, this study regards the battery analysis to be conducted under a constant nominal working temperature.
2.2. Mechanical Torque
Consequently, the calculated results of Equations (2) and (9) can quantitatively evaluate the energy efficiency and dynamic performance of the reference FCEV. The specifications of the reference FCEV are listed in Table 1 [5, 20].
| Item | Specification | |
|---|---|---|
| Stack (1/2) | Maximum power | 30 kW |
| Motor (1/2) | Maximum torque | 170 Nm |
| Maximum power | 50 kW | |
| Maximum speed | 10,000 RPM | |
| Battery | Nominal voltage | 237 V |
| Capacity | 1.02 kWh | |
| Vehicle | Total mass | 1605 kg |
| Frontal area | 2.27 m2 | |
| Drag coefficient | 0.29 | |
| Rolling coefficient | 0.01 | |
| Tire radius | 0.31 m | |
| Speed gear ratio | 1.725 | |
| Final gear ratio | 4.058 | |
3. ESS Power and Motor Torque Distribution Strategy
To minimize energy consumption during FCEV driving, the stacks and motors should operate efficiently. Thus, a power and torque distribution strategy should account for the integrated efficiency of both. First, the ESS power distribution strategy determines the stack power that satisfies the required driving power while maintaining the SOC of the battery. Second, the motor torque distribution strategy determines the motor torque that satisfies the required wheel torque. The details are given below.
3.1. ESS Power Distribution
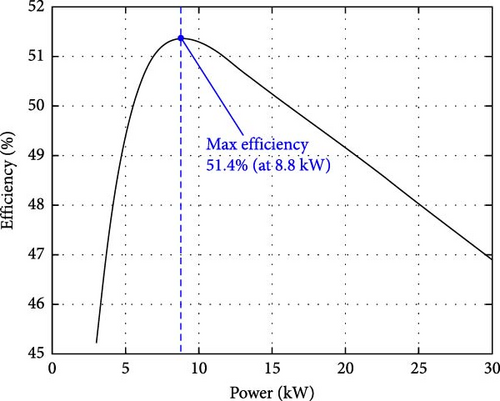
The power distribution strategy can be classified into five conditions based on the required motor power and battery SOC, as shown in Figure 6. Ptr is the transition power that determines the conditions under which stack power is supplied to the motor. Peff is the maximum efficient power (8.8 kW, Figure 4) of the stack, and Pmax is the maximum stack power (30 kW).
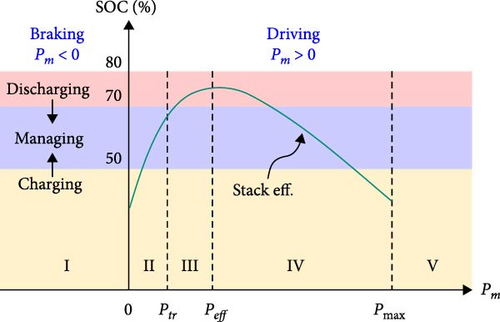
The battery manages the SOC value between 50% and 70% considering the battery characteristics, such as the open-circuit voltage (VOCV) and internal resistance (Rin) values (Figure 5). When the SOC value exceeds 80%, the battery discharges unconditionally. The stack maximizes its efficiency by managing the required power. When the motors regenerate braking power (Pm < 0, Case I), only the battery charges itself. If the required motor power is lower than the transition power (0 < Pm < Ptr, Case II), the stack turns off (no charging is required) or operates to charge the battery at the maximum efficient power (Peff). When the required motor power is lower than the maximum efficient power and higher than the transition power (Ptr < Pm < Peff, Case III), the stack either supplies the motor with power matching Pm (no charging is required) or operates on Peff to provide power to both the motor and battery. When the required motor power exceeds the maximum efficient power (Peff < Pm, Case IV), the stack supplies the motor with Pm. Here, when Pm is higher than the maximum stack power (Pmax < Pm, Case V), the battery provides an additional supply of insufficient power. Based on the required motor power, this strategy is applied independently to each stack. The corresponding stack (Ps) and battery powers (Pbat) for each required motor power (Cases I to V) are summarized in Table 2.
| Case | Motor power | Battery | |
|---|---|---|---|
| Charging | Discharging | ||
| I | Pm < 0 | Ps = 0 | — |
| Pbat = Pm | |||
| II | 0 < Pm < Ptr | Ps = Peff | Ps = 0 |
| Pbat = Pm − Peff | Pbat = Pm | ||
| III | Ptr < Pm < Pmax | Ps = Peff | Ps = Pm |
| Pbat = Pm − Peff | Pbat = 0 | ||
| IV | Peff < Pm < Pmax | — | Ps = Pm |
| Pbat = 0 | |||
| V | Pmax < Pm | — | Ps = Pmax |
| Pbat = Pm − Pmax | |||
The power distribution between the stacks and the battery is determined by the transition power values of both stacks (Ptr1 and Ptr2), among other parameters. If the transition power is close to the maximum efficient power (Peff), the stack can operate efficiently. However, this may lead to increased charging and discharging times for the battery, compared to setting to a significantly lower Ptr than Peff. Because long-term battery use negatively affects the system efficiency, it is crucial to determine optimal values for Ptr1 and Ptr2 based on the operating conditions of each motor and stack.
3.2. Motor Torque Distribution
This equation implies that when Tm1 is determined, Tm2 is determined from the values of r1, r2, and Tout.
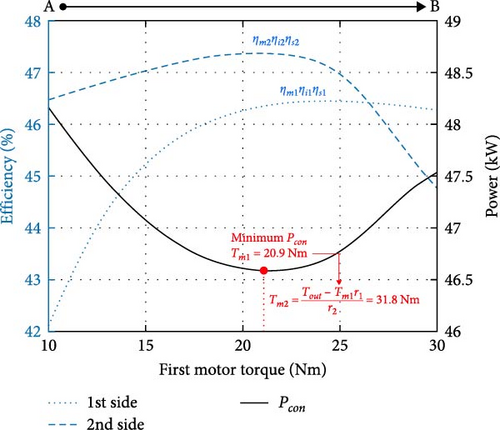
To minimize energy consumption in Equation (12), the values of Pcon according to the vehicle speed (v) and request output torque (Tout) should be minimized. To maximize the multiplied efficiency (ηmηiηs) of each motor side, it is necessary to determine the torque values of the two motors. The motor and inverter efficiencies depend on the motor torque and speed, as shown in Figure 3, and the stack efficiency is a function of the required motor power (Pm). The stack efficiency (ηs) in Figure 4 can be converted into the efficiency of the motor torque and speed using Equation (11) to calculate the multiplied efficiency according to the motor torque and speed. When the required motor power is greater or less than the maximum stack power (Pmax < Pm) or the transition power (Pm < Ptr), the stack outputs a constant maximum stack power or zero, and the battery supplies insufficient power under these conditions. Therefore, the stack efficiencies at Pm and Ptr are considered equivalent stack efficiencies according to the motor torque and speed for the higher (Pmax < Pm) and lower power areas (Pm < Ptr), respectively, and the stack efficiency can convert a 1-D graph (Figure 4) to a 2-D map using the equivalent efficiencies. Figure 7 shows the stack efficiency according to the motor torque and speed for calculating the multiplication efficiency.
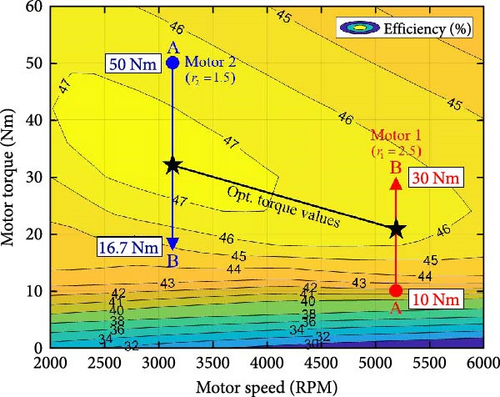
To minimize energy consumption on both motor sides, it is necessary to determine the torque values separately, as maximizing efficiencies for both sides simultaneously is challenging. Figure 8 shows torque distribution between two motors under a specific condition based on their multiplied efficiencies (ηmηiηs). The difference in the first- and second-side efficiencies and the power consumption (Pcon), based on torque distribution from A to B, suggests that an optimal torque distribution exists for a given vehicle speed (v), request output torque (Tout), and gear ratios (r1, r2). Within the available v and Tout, the optimal torque distribution depends on the gear ratio because the torque and speed of the two motors differ depending on the gear ratios at the same v and Tout. Therefore, torque distribution should be optimized by changing the gear ratio design.
4. ANN Model-Based Multiobjective System Optimization Process
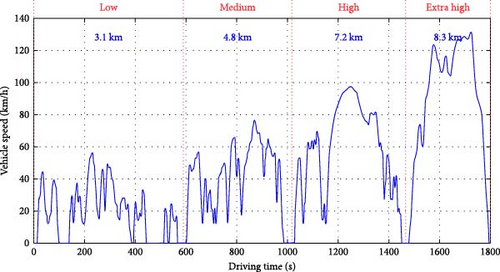
In order to optimize the FCEV powertrain system, it is necessary to first identify the objectives and variables. This study aims to consider both energy efficiency and dynamic performance as the objectives, using hydrogen consumption value (H2con) and acceleration time (tacc) as the efficiency and performance measures, respectively. The hydrogen consumption value is evaluated under the condition that the FCEV follows the Worldwide Harmonized Light-Duty Vehicles Test Procedure (WLTP), as shown in Figure 9. The acceleration time represents the time it takes for the vehicle to reach 100 km/h from zero under the full acceleration conditions (APS = 1). In general, there is a trade-off between these objectives; thus, implementing a multiobjective optimization method is appropriate.
4.1. Formulation of Multiobjective Optimization Problem
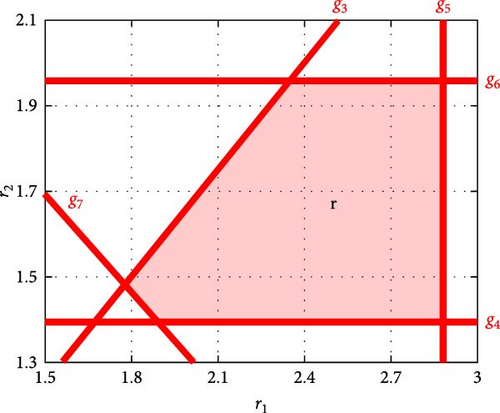
Here, the value of Tm2.max is the maximum torque at the maximum speed, as shown in Figure 3. From the step ratio constraint shown in Equation (20), the minimum first-gear ratio can be determined using the minimum second-gear ratio.
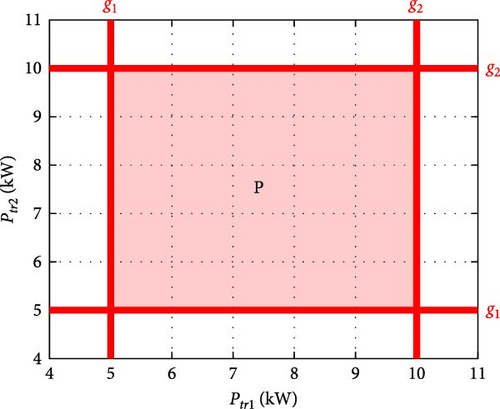
Based on the constraints of Equation (25), the feasible region of optimization variables is depicted as in Figure 10.
4.2. ANN Model-Based Optimization
The multiobjective optimization method provides a set of optimal solutions known as the Pareto front. Therefore, this method requires the iterative and simultaneous updating of multiple solutions during optimization. The nondominated sorting genetic algorithm (NSGA) [21] has been widely used in various studies to solve the multiobjective optimization problem. However, because the NSGA utilizes a genetic algorithm, performing multiobjective optimization requires excessive computational effort. Alternatively, some studies on vehicle system optimization have proposed ANN model-based optimization methods.
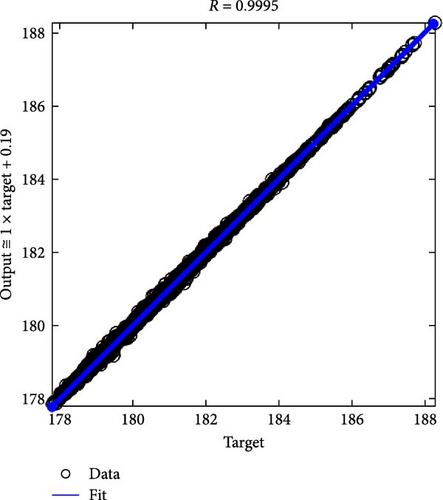
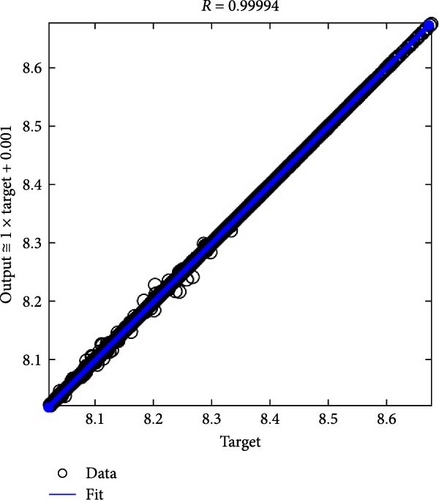
From the specific sample results, well-trained ANN models can accurately predict output values (objectives) using input values (variables) [22]. This study conducted the FCEV analysis of the output values (H2con, tacc) according to the input values (P, r) from the sample points. It is appropriate for the distribution of sample points to be evenly spaced in the feasible region. To obtain ~3000 sample points, this study employs optimal Latin hypercube sampling with a maximin distance design method [23]. For each output, an ANN model was developed using the neural network toolbox in MATLAB. The used parameter settings for the ANN model are presented in Table 3, and the configuration of ANN model is as shown in Figure 11. Figure 12 shows the correlation coefficients (R) between the target (FCEV analysis) and the output (ANN model). As the value of each R is significantly close to 1, the ANN models can appropriately predict the FCEV analysis results given the input values. Because ANN models evaluate each objective function value without performing FCEV simulation and motor torque distribution optimization, ANN model-based optimization is an effective method that can significantly reduce the excessive computational burden during the optimization [24].

| Parameter | Setting |
|---|---|
| Number of hidden layers | 2 (fully connected) |
| Nodes in each layer | 20 |
| Training algorithm | Bayesian regularization |
| Activation function | |
| Hidden layer | Sigmoid |
| Output layer | Linear |
| Sample ratio | |
| Training | 70% |
| Validation | 15% |
| Testing | 15% |
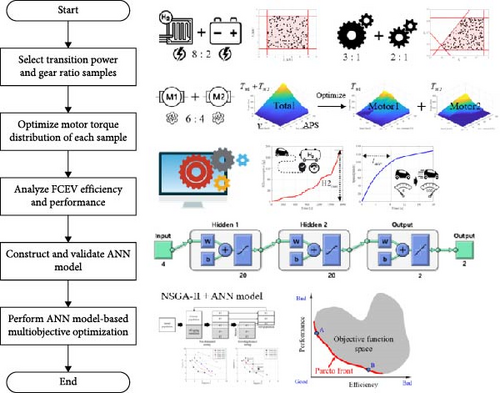
The overall optimization process is illustrated in Figure 13. First, the sample points were selected in a feasible region of the stack transition power and transmission gear ratios, and the motor torque distribution between the two motors for each sample was optimized by Equation (18). Next, the FCEV efficiency and performance were analyzed using the transition power and gear ratio samples and optimal torque distribution, and the ANN models were built using the FCEV simulation results. Finally, a multiobjective optimization was conducted using the NSGA and the ANN models to obtain the optimal solutions.
5. Results of ANN Model-Based Multiobjective Optimization
This study conducted an ANN model-based multiobjective optimization using the constructed ANN models for hydrogen consumption (H2con) and acceleration time (tacc). To assess the superiority of the two-stack and two-motor powertrain system (2S2M) for the energy efficiency and dynamic performance of the FCEV, the results of the single-stack and single-motor powertrain system (1S1M) are compared with the 2S2M. Therefore, it is necessary to determine the specifications of a stack and motor for 1S1M. To match a total maximum stack power and motor torque with the 2S2M, the power and torque values for 1S1M leverage twice the power (30 kW) and torque (170 Nm) of the stack and motor as presented in Table 1. The efficiency values for a single-stack are twice those of the power values on the x-axis in the efficiency graph in Figure 4. Similarly, the efficiency of each motor and inverter for 1S1M utilizes the efficiency values that double the y-axis (torque) values of the efficiency maps in Figure 3. Since 1S1M has a single-motor and a single-speed gear, this multiobjective optimization does not require a combination of optimal gear ratios and the optimal torque distribution of the two motors. In addition, because each stack power for 1S1M (60 kW) and 2S2M (30 kW) is different, it is not appropriate to compare the optimal stack transition power values of the two systems equally. Therefore, this study employed the appropriate values of the gear ratio (r = 1.725) and stack transition power (Ptr = 17.6, maximum efficient power value) for 1S1M to compare the results of the two powertrain systems. Furthermore, there may be a difference in powertrain mass between 2S2M and 1S1M because of the increase in the electric motor, controller, and stack. However, since the total output power of each system is the same, this effect on FCEV efficiency and performance is much smaller than the FCEV system change effect, and it does not directly influence the optimal solutions. Therefore, the difference in powertrain mass between the two systems is not considered in this study.
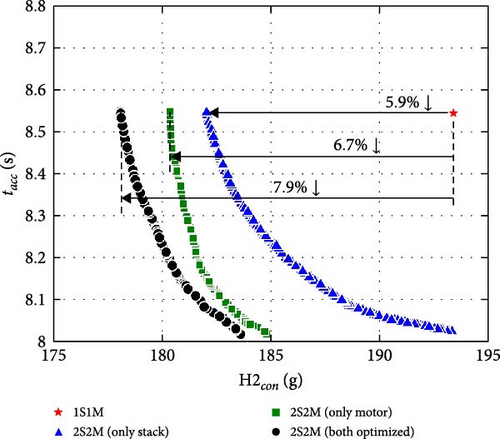
Figure 14 displays the Pareto front for 2S2M, containing a set of 200 optimal solutions for H2con and tacc based on the optimization results. The results of H2con ( = 193.4 g) and tacc ( = 8.55 s) for 1S1M were employed as the additional constraints on the objective values in Equation (17) to obtain optimal solutions that are always superior to 1S1M. To assess the quantitative improvement in the efficiency and performance of the proposed FCEV, the optimal result of 2S2M was compared to the reference FCEV that used 1S1M. Because the distribution of the Pareto optimal solutions demonstrates a trade-off relationship between the two objectives, this result represents the suitability of multiobjective optimization that provides multiple solutions for the FCEV powertrain system. Compared to 1S1M, 2S2M can reduce hydrogen consumption (H2con) and acceleration time (tacc) by up to 7.9% and 6.2%, respectively. The optimization results show that 2S2M has significant potential to enhance the energy efficiency and dynamic performance of FCEVs compared to existing powertrain systems.
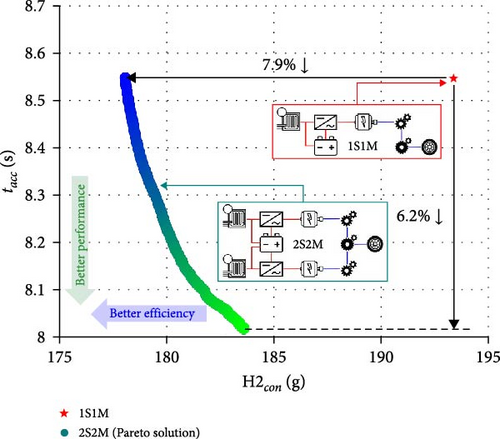
Figure 15 shows the optimal solution distributions for the gear ratios (r1, r2) and stack transition powers (Ptr1, Ptr2) at the Pareto front. The results in respective Figures 14 and 15 for the objectives and solutions were depicted using the gradation plot to identify the optimal solutions corresponding to each objective value. When a specific solution is close to the blue or light green color, it indicates that the solution is advantageous for efficiency or performance, respectively. Based on the gear ratios shown in Figure 15a, our results generally indicate that utilizing low- and high-gear ratios is advantageous for enhancing energy efficiency and dynamic performance, respectively. This is reasonable for improving dynamic performance because high-gear ratios can significantly increase motor torque. Meanwhile, the gear ratios affect energy efficiency by adjusting the motor’s operating points and optimal torque distribution. Because the evaluation of hydrogen consumption under the WLTP driving cycle depends on various factors, the optimal gear ratios that consider both efficiency and performance were not distributed in an evident pattern. Moreover, the distribution in Figure 15b represents that the optimal stack transition power has various values, indicating that the optimal solutions for energy efficiency have no specific patterns. Therefore, utilizing appropriate optimization methods is essential for improving the energy efficiency of FCEVs because it is difficult to predict the effect of system parameters on energy efficiency. Thus far, the optimization result exhibits the various system solutions for each weighted objective. It indicates that the Pareto solutions demonstrate the effectiveness of multiobjective optimization to identify the best system specifications according to each engineer’s requirement.
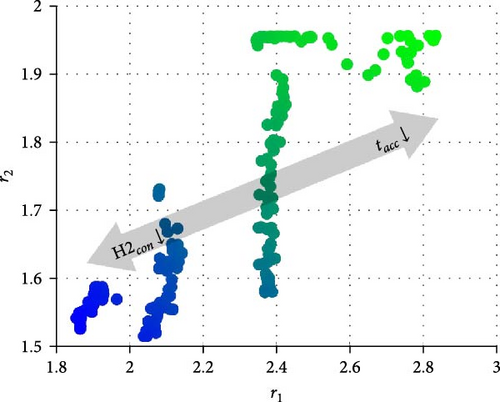
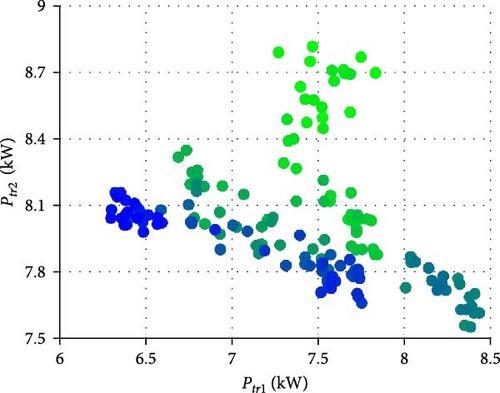
Figure 16 shows a comparison of the Pareto fronts when considering each optimization variable: (i) only the stack transition power (Ptr1, Ptr2), (ii) only the motor torque distribution (T1, T2), and (iii) both variables. Here, the constant values of T1, T2 and Ptr1, Ptr2 in cases (i) and (ii) utilize equal values (T1:T2 = 50%:50%) for the motor torque distribution and 8.8 kW (Ptr1 = Ptr2 = 8.8; the maximum efficient power) for the stack transition power, respectively. In addition, because only the gear ratio affects the dynamic performance, all cases commonly include gear ratios as the optimization variables to obtain Pareto fronts for each case. This comparison of the Pareto fronts indicates the significance of both components (stack and motor) in enhancing the energy efficiency of FCEVs. Furthermore, an optimization of the entire system, considering all major components, showed a significant improvement in energy efficiency compared to cases, where only certain components were optimized. This demonstrates the importance of system optimization for novel powertrain systems in FCEVs.
This study compares the objective values between the FCEV and ANN models by performing simulations of the FCEV model using the optimal solution in Figure 15 to confirm the prediction accuracy of the ANN models for the optimization results. Figure 17 shows the comparison of results for the hydrogen consumption (H2con) and acceleration time (tacc). The average errors of H2con and tacc are ~0.07% and 0.02%, respectively, and their correlation coefficients are derived as 0.994 and 0.997, respectively. Therefore, the prediction accuracy of each ANN model is acceptable.
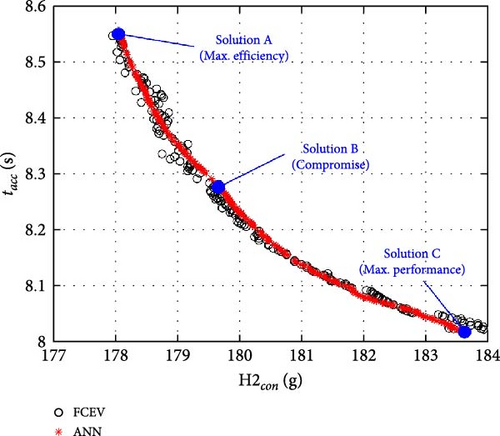
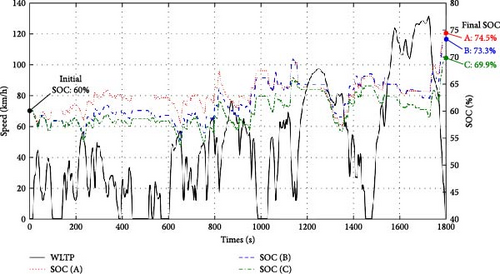
The results of the three representative solutions in Figure 17 (Solutions A, B, and C) are summarized in Table 4. Figure 18 shows the SOC variations for each solution during the WLTP driving cycle. The SOC values are managed between 50% and 70%, as mentioned in Figure 6. The final SOC values for each solution exceed the initial SOC value (60%) because of the regenerative braking in the final deceleration region of the WLTP (over 1700 s). Therefore, the excess SOC value is converted to the equivalent hydrogen value based on LHV, and the hydrogen consumption is evaluated by reflecting its value.
| Solution | Variables | Objectives | ||||
|---|---|---|---|---|---|---|
| r1 | r2 | Ptr1 (kW) | Ptr2 (kW) | H2con (g) | tacc (s) | |
| A (efficiency) | 1.865 | 1.526 | 6.452 | 8.043 | 178.09 | 8.55 |
| B (compromise) | 2.079 | 1.724 | 7.577 | 7.777 | 179.62 | 8.28 |
| C (performance) | 2.834 | 1.957 | 7.835 | 8.697 | 183.62 | 8.02 |
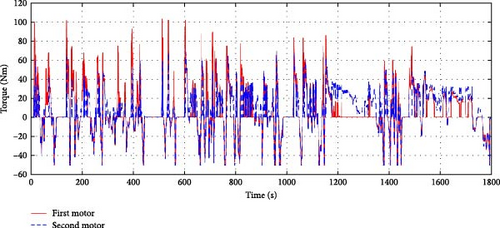
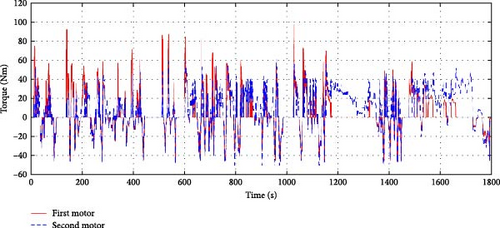
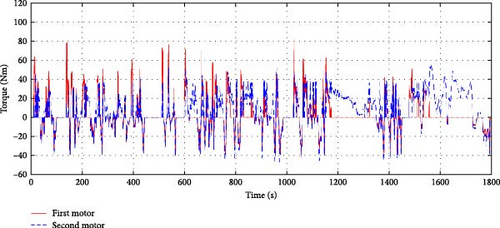
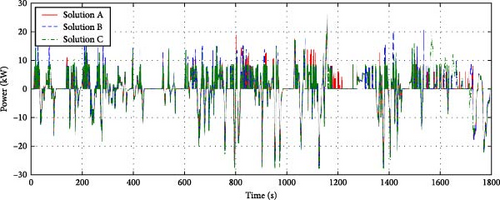
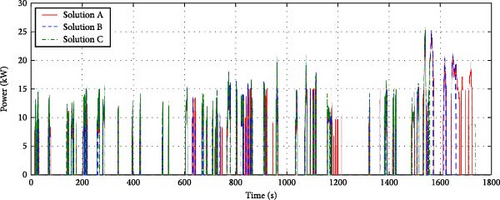
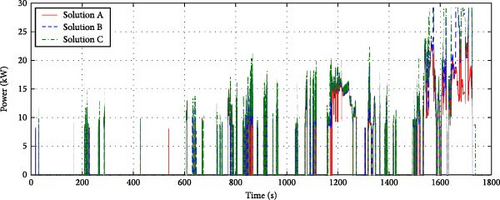
Figure 19 shows the motor torque values for each solution during the WLTP driving cycle. All cases present adequate torque values, and the overall torque values decrease as the change from Solution A to Solution C because the gear ratios gradually increase (Figure 15a). Figure 20 shows the battery and stack power values for each solution during the WLTP driving cycle. In the case of battery power, the changes in power values among the solutions are similar under the same required power of the FCEV because this system uses a single battery. However, the stack power values present some differences: especially the output power under the extra high-speed region of WLTP (over 1400 s: Figure 9). In general, the second-stack power is significantly higher than the first-stack power in this condition. Similarly, the second-motor torque is generally greater than the first-motor torque (Figure 19). Since using the second motor is higher multiplied efficiency (ηmηiηs) than using the first motor in this condition, a motor torque distribution strategy is optimized to further drive the second motor.
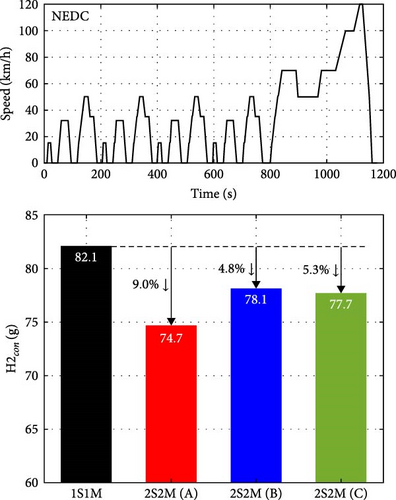
To confirm that the optimum solutions are robust to changes in different driving conditions, the hydrogen consumption results based on three optimal solutions for 2S2M (Solutions A, B, and C) and 1S1M configuration were compared using the standard driving cycles: (i) the New European Driving Cycle (NEDC) and (ii) a combination of the Urban Dynamometer Driving Schedule (UDDS) and the Highway Fuel Economy Test (HWEFT), as shown in Figure 21. Since the optimal solutions of 2S2M exhibit superior efficiency to the 1S1M configuration, these solutions have robust efficiency under various driving cycles despite being obtained from the optimization based on the WLTP cycle.
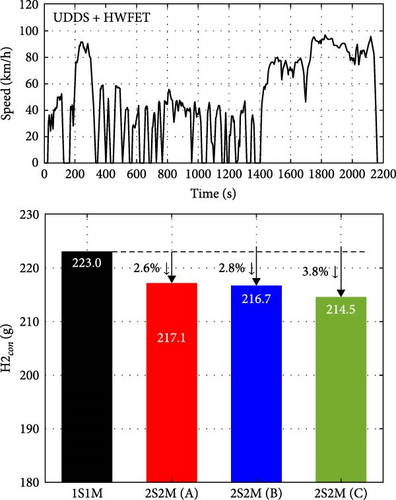
To verify the effectiveness of the ANN model-based multiobjective optimization method, this study compares the times required to perform the optimization based on the ANN and FCEV models, respectively. From the optimization results for 2S2M shown in Figure 14, 115,000 calculations were required for each objective function (H2con and tacc) when NSGA was used to obtain the Pareto front. To evaluate the efficiency and performance of the FCEV, the FCEV analysis model needed around 3 min to process a single case in our computing environment, with the majority of the time allocated to optimizing the motor torque distribution. Therefore, it is expected that it will take about 8 months to perform this optimization using NSGA based on the FCEV analysis model. However, the time for optimization based on the ANN model was approximately a week, and most of the time was for training the ANN model. Since the ANN model can predict the objective function value without vehicle simulation and optimizing the motor torque distribution, the excessive amount of calculations caused by performing NSGA has little effect on the time required for the proposed optimization process as shown in Figure 13. This comparison demonstrates the need for ANN models to optimize complex powertrain systems of FCEVs.
6. Conclusion
This study proposed a practical multiobjective optimization method for a novel FCEV powertrain system. Furthermore, an analysis model of the FCEV comprising 2S2Ms was developed by considering the characteristics of powertrain components such as the stack, battery, inverter, motor, and transmission. Subsequently, the study introduced an ESS power and motor torque distribution strategy that minimized hydrogen consumption in FCEVs. This strategy based on multiplied efficiency showed that the energy efficiency of the FCEV was maximized. Here, the optimization process allows the stack transition power to be optimized independently; however, the motor torque distribution can be optimized depending on the given transmission gear ratios.
A multiobjective optimization method was used to optimize the 2S2M to address the trade-off between energy efficiency and dynamic performance of the FCEV. An optimization problem was formulated using stack transition power, motor torque distribution, and gear ratios, as the optimization variables, with the objective to minimize hydrogen consumption and acceleration time. This approach is effective for the proposed powertrain system because it considers both the efficiency and performance objectives of the FCEVs and various optimization variables of the system. However, it is computationally exhaustive to solve such an optimization problem. Therefore, an ANN model-based multiobjective optimization process was proposed as an alternative to overcome this limitation.
The optimization results of the FCEV employing 2S2M exhibited a Pareto front, indicating the trade-off between the efficiency and performance of the FCEV. The results show that the 2S2M is significantly superior in efficiency and performance to the 1S1M because it could reduce hydrogen consumption and acceleration time to a maximum of 7.9% and 6.2%, respectively. This indicates that the 2S2M is a powerful system that enhances the energy efficiency and dynamic performance of FCEVs compared to conventional powertrain systems. Moreover, the distributions of the optimal solutions and a comparison between the Pareto fronts for each optimization variable highlight the importance of the proposed system optimization method. A comparison between the FCEV and ANN models regarding the computational burden during the optimization process verified the effectiveness of the proposed ANN model-based multiobjective optimization method. As a limitation of this research, because these system optimization results were obtained under a specific driving cycle, applying these results in the real driving condition may be limited in this study. Therefore, the practical system optimization method suitable for various driving conditions will be addressed to obtain better solutions for FCEVs with multistack and multimotor systems.
Nomenclature
-
- Tm:
-
- Motor torque (Nm)
-
- ωm:
-
- Motor speed (rad/s)
-
- ηm, ηi, ηs:
-
- Motor, inverter, and stack efficiencies (%)
-
- Ps, Pbat:
-
- Stack and battery power (W)
-
- H2con:
-
- Hydrogen consumption value (g)
-
- LHV:
-
- Lower heating value of hydrogen (kJ/g)
-
- Vb:
-
- Voltage of battery (V)
-
- Ib:
-
- Current of battery (A)
-
- VOCV:
-
- Open-circuit voltage of battery (V)
-
- Rin:
-
- Internal resistance of battery (Ω)
-
- SOCi:
-
- Initial state of charge (%)
-
- Cb:
-
- Nominal battery capacity (kWh)
-
- Tdrv:
-
- Driving torque at wheels (Nm)
-
- r1, r2:
-
- First and second speed gear ratios
-
- rd:
-
- Final gear ratio
-
- ηt:
-
- Constant transmission efficiency (%)
-
- Tres:
-
- Resistance torque at wheel (Nm)
-
- cd:
-
- Drag coefficient
-
- ρ:
-
- Air density (kg/m3)
-
- Af:
-
- Frontal area (m2)
-
- v:
-
- Vehicle speed (m/s)
-
- M:
-
- Vehicle total mass (kg)
-
- g:
-
- Gravitational acceleration (m/s2)
-
- µr:
-
- Rolling resistance coefficient
-
- θ:
-
- Road slope (rad)
-
- Rt:
-
- Effective tire radius (m)
-
- αw:
-
- Rotational wheel acceleration (rad/s2)
-
- Jeq:
-
- Equivalent vehicle inertia at wheel (kgm2)
-
- Jm:
-
- Motor inertia (kgm2)
-
- Jw:
-
- Inertia of wheels (kgm2)
-
- Tbrk:
-
- Total braking torque (Nm)
-
- Tbrk.m:
-
- Mechanical braking torque (Nm)
-
- Pm:
-
- Required motor power (W)
-
- Ptr:
-
- Transition power between stack and battery (kW)
-
- Peff:
-
- Maximum efficient stack power (kW)
-
- Pmax:
-
- Maximum stack power (kW)
-
- Econ:
-
- Driving energy consumption (J)
-
- Pcon:
-
- Driving power consumption (W)
-
- APS:
-
- Accelerator pedal sensor value
-
- Tout:
-
- Request output torque (Nm)
-
- Tm.max:
-
- Maximum motor torque according to motor speed (Nm)
-
- ev:
-
- Speed error (m/s)
-
- Kp, Ki, Kd:
-
- Proportional, integral, and derivative gains
-
- tacc:
-
- 0 to 100 km/h acceleration time (s)
-
- ωmax:
-
- Maximum motor speed (rad/s).
Disclosure
A preprint has previously been published [25].
Conflicts of Interest
The authors declare no conflicts of interest.
Author Contributions
Kihan Kwon: conceptualization, methodology, software, formal analysis, investigation, visualization, writing–original draft. Sang-Kil Lim: methodology, formal analysis, investigation, resources, data curation. Jung-Hwan Lee: writing–review and editing, supervision, project administration. Kihan Kwon and Sang-Kil Lim contributed equally to this work.
Funding
This research was supported by the Basic Science Research Program through the National Research Foundation of Korea (NRF) funded by the Ministry of Education (RS-2023-00239986).
Acknowledgments
The authors have nothing to report.
Open Research
Data Availability Statement
The data that support the findings of this study are available from the corresponding author upon reasonable request.


