Data-Driven Prediction of Li-Ion Battery and PEM Fuel Cell Performance Degradations for Balanced Optimal Energy Management of Electrified Propulsion Systems
Abstract
With the increasing pace of commercialization, the proton exchange membrane fuel cell (PEMFC) system-powered fuel cell electric vehicles/vessels (FCEVs) present a highly efficient, zero tailpipe emission propulsion solution. A battery energy storage system (BESS) is normally integrated with the PEMFC system to improve its performance, energy efficiency and operational life. However, both the PEMFC system and the BESS suffer from relatively short operation life and high replacement costs. Optimal energy management strategies (EMSs) become essential to improve their working conditions, thus extending their working life based on their distinct performance degradation behaviours and achieving the minimum lifecycle costs (LCCs). Extending from the present static modelling approach, this research introduces three new methods for dynamically updating the performance and degradation models of lithium-ion (Li-ion) batteries and PEMFCs using real-time operation data of a fuel cell–battery hybrid electric propulsion system. The combined methods more accurately capture the performance and capability of each specific fuel cell hybrid propulsion system’s BESS and PEMFC system. This enables precise performance tracking, degradation assessment and optimal energy management. A new integrated approach to the hybrid electric propulsion system’s component sizing design optimization and optimal energy management is introduced using these new modelling schemes, minimizing the LCC by balancing the propulsion system performance, fuel economy and the BESS and PEMFC system degradations. These modelling and optimization methods are applied to a medium-sized vehicle and passenger ferry to produce the optimal fuel cell–battery hybrid propulsion system design and EMS to strike the best balance between fuel efficiency and the PEMFC and BESS operation life.
1. Introduction
Proton exchange membrane fuel cells (PEMFCs) offer numerous advantages in heavy-duty propulsion systems, including zero tailpipe emissions, high efficiency and high power. However, they mainly excel at providing stable power output and struggle with extremely low or high loads and rapid load fluctuations common in heavy-duty vehicular and ship propulsions. To address this issue, integrating an additional battery energy storage system (BESS) or hybridizing with batteries can bolster the propulsion system responsiveness, capitalizing on fuel cells’ benefits while mitigating their limitations and extending their operation life with reduced lifecycle costs (LCCs).
Despite their advantages, PEMFCs and the commonly used lithium-ion (Li-ion) batteries have costs and degradation issues. Accurate performance degradation models are pivotal for the hybrid propulsion system’s design optimization and optimal energy management strategy (EMS) to avoid poor performance and life-shortening deteriorations that lead to high LCCs [1–4]. Given their different degradation rates, balanced propulsion system design and controls are vital, ensuring optimal propulsion performance and system longevity.
Over the past years, considerable efforts have been devoted to PEMFC performance and degradation modelling. Frequently changing load conditions are the main cause of PEMFCs’ degradation. Due to the dynamically shifting operation conditions, voltage fluctuations on PEMFCs’ outputs negatively impact PEMFC materials and composing elements. The starting, stopping, idling and dynamically varying load operation modes are found to be closely associated with accelerated PEMFC performance degradation [5]. The transient current load changes will cause frequent fluctuations in the PEMFCs’ reactant gas pressure, temperature, humidity etc., resulting in mechanical damage. More robust materials may improve PEMFC life, but it becomes difficult to see progress after decades of research and development. Introducing BESS to form a PEMFC-BESS hybrid power system and optimizing the hybrid system design and EMS can reduce the PEMFC systems’ unfavourable operation conditions, thus delaying the attenuation and prolonging PEMFC life.
These optimizations can only be achieved by knowing exactly how the PEMFC performance degrades under different operation conditions. Widely studied in recent years, the data-driven modelling approach often has difficulty adapting to the degenerating behaviour of the PEMFC due to poor algorithm consistency. The lack of data requires more complex models to adapt to changing observations, resulting in large uncertainties and extensive computational costs. A data-driven prediction method has been proposed in [6], with less learning data fitting. As a result, the PEMFC ageing prediction was more robust, making the application easier. Based on the analysis of the variance method, the influence of different parameters of a novel ANN paradigm was analysed in [7], and three sets of parameters with greater impact on PEMFC voltage were identified. A method based on an adaptive neuro-fuzzy inference system has been proposed in [8] to predict the PEMFC’s output voltage.
The performance and degradation of the Li-ion BESS also have to be considered due to its high costs and limited operation life. Their modelling shares considerable similarities to the PEMFC system performance and degradation modelling. The latest research on Li-ion battery health monitoring and prediction was reviewed in [9], summarizing the technologies, algorithms and projections of the remaining useful life (RUL), state of charge (SOC), current and voltage, energy capacity and power of the BESS. The monitoring methods of battery charge status, capacity, impedance parameters, available power, health status and remaining service life were reviewed in [10], and the advantages and drawbacks of these online or real-time methods were compared. Various estimation methods were classified in [11] according to their underlying models and algorithms of big data analysis and related computing tools. The advantages and limitations of these estimation methods were also discussed. The battery state of health (SOH) assessment methods were classified according to the signals used to extract health indicators and the supporting theories [12], with further discussions on their advantages and drawbacks. Model-based battery performance and SOH prediction methods use a combined equivalent circuit and electrochemical models to improve prediction accuracy [13]. Establishing the form of the performance and degradation models and determining the parameters of these models using experimental or operation data are two essential tasks. Furthermore, dynamically updating the identified model parameters using continuously acquired BESS operation data is critical to ensure accurate real-time optimal power control and energy management.
The PEMFC and battery hybrid propulsion system and its EMS can be optimized for a given statistical data-derived driving cycle or operation profile offline using an extensive global optimization search, such as dynamic programming (DP). Recent research has tried to balance the propulsion system’s energy efficiency and overall LCCs using the PEMFC’s fuel efficiency and either the PEMFC’s or Li-ion battery’s degradation model. The main causes of PEMFC degradation were identified in [14], and a model was generated to estimate the impact of EMS on PEMFC degradation. A stochastic DP controller minimized the PEMFC system’s hydrogen fuel consumption and degradation costs by avoiding transient loads on the PEMFC system. Due to the difficulty in capturing the PEMFC’s and Li-ion battery’s performance and capacity degradation behaviours, simple and less accurate models were adopted. An EMS that simultaneously considers fuel consumption and degradations of PEMFC and Li-ion battery ESS was introduced in [15] to optimize fuel cell/battery hybrid powertrains using a simplified PEMFC electrochemical model and an empirical model of Li-ion batteries. The propulsion system’s EMS and PEMFC system and BESS sizes in a hybrid electric bus were optimized, and the influence of driving mode on the bus optimization results was investigated [16]. Our team’s recent work formulated a two-level nested optimization problem to determine the optimal powertrain component size and EMS by combining powertrain system design and control optimization. An advanced agent-based global optimization method was used to solve the complex global optimization problem with improved system energy efficiency and reduced LCC of PEMFCs [17]. However, the offline preoptimized PEMFC and BESS hybrid propulsion system and its EMS cannot assure optimal system efficiency and minimum LCC in real-time, as the actual operations of the PEMFC-BESS hybrid system depart from the statistical driving cycle or operation profile. Extensive research has been devoted to various real-time optimal control strategies, including equivalent cost minimization (ECM), Pontryagin’s maximum principle (PMP), model predictive control (MPC) and reinforcement learning (RL), to improve the fuel cell hybrid electric propulsion systems’ performance and fuel economy. However, the PEMFC and Li-ion BESS degrade differently under varying operations compared to the results obtained offline based on the statistical operation profile and lab data-based degradation models. Although research has been devoted to monitoring their changing SOH, the observed changes have not been incorporated to dynamically update the PEMFC and BESS’ degradation models to improve the real-time optimal power control and EMS, causing less ideal system performance and harm to PEMFC and BESS operation life, resulting in increased LCC of the fuel cell electric vehicles/vessels’ (FCEVs) propulsion system.
- •
Firstly, this research introduced new methods for dynamically updating Li-ion batteries’ performance and degradation models from the present static and laboratory data-based battery performance and degradation modelling methods. The internal resistance of the battery performance model and the empirical parameters of the battery degradation models are dynamically updated using BESS’s real-time operation data. The data-driven modelling and prediction methods, Gaussian process regression (GPR), backpropagation (BP) and support vector machine (SVM), are tested to predict the varying internal resistance of the battery. A Kalman filter-based method is used to periodically update the parameters of the battery degradation model in real-time.
- •
Secondly, extending from the present static and laboratory data-based PEMFC performance degradation model, this research introduced a new method for dynamically updating the key PEMFC degradation parameter, the active area, using real-time operation data of the PEMFC. Again, three different machine learning estimation algorithms, GPR, BP and SVM, were tested, and SVM presented the highest prediction accuracy among the algorithms.
- •
Thirdly, an innovative and comprehensive approach has been developed to integrate the hybrid electric propulsion system’s component sizing design optimization and optimal energy management using the new modelling schemes, minimizing the LCC by balancing the system performance, fuel economy and the degradations of the PEMFC and Li-ion batteries.
- •
Finally, the new modelling and optimization methods are applied to a medium-sized vehicle and passenger ferry to develop the optimal fuel cell–battery hybrid propulsion system design and energy management, striking the best balance between fuel efficiency and the PEMFC and BESS operation life and demonstrate the benefits of the introduced approaches.
2. Battery Performance and Degradation Modelling
In recent years, the LiFePO4 (LFP) battery became the primary type of Li-ion battery used in electrical propulsion. This research modelled the performance and degradation behaviours of the LFP batteries under different use patterns utilizing the battery lifecycle test data used in [18, 19]. The technical parameters of the LFP batteries are shown in Table 1.
| Model | HP-NE-3R2-180A |
|---|---|
| Shell material | AL3003 |
| Rated voltage | 3.2 V |
| Rated capacity | 18 Ah |
| Weight | 620 ± 30 g |
| Internal resistance | ~3.0 mΩ |
| Weight energy density | ~120 Wh/kg |
| Volume energy density | ~225 Wh/L |
| Power density | ≥1500 W/kg |
| Charge cut-off voltage | 3.6 V |
| Discharge cut-off voltage | 2.5 V |
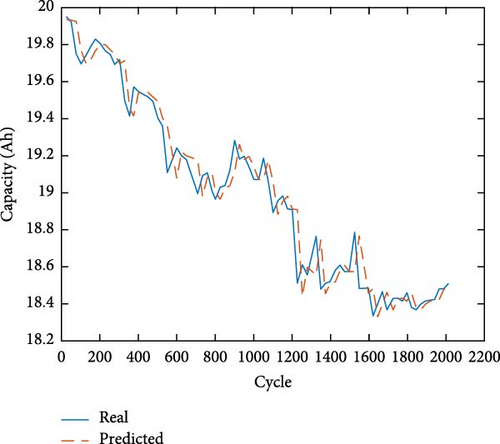
At each instant, the battery’s measured output voltage and current show its power performance and the amount of electrical energy stored in the batteries between a full charge and discharge, indicating its energy-holding capacity. Both battery performance and capacity influence the operation of an electrified propulsion system, and these capabilities decrease with time at different rates under different operation patterns. During the cycle life tests, the batteries underwent repeated charge–discharge cycles in an environmental chamber at a controlled temperature of 25°C to measure the battery’s capacity degradation. During each cycle, the batteries were first charged at a constant current, and when the voltage reached 3.6 V, they were then charged at a constant voltage until the current dropped to zero. After a 20-min rest, the batteries were discharged at a constant current until they reached the cut-off voltage of 2.5 V and rested for 20 min. Cycling tests were performed at 1 C charge and 2 C discharge, with a capacity test of 1/3 C charge and 1/3 C discharge approximately every 26 cycles. The declining trend of battery capacity is shown in Figure 1. An instrument recalibration was done at 1200 cycles.
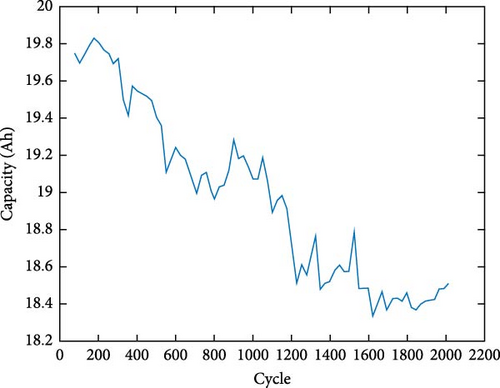
The purpose of battery performance and degradation modelling is to capture the characteristics of battery performance and degradation. These models can be categorized into electrochemical, empirical and semiempirical models. The generic electrochemical model is based on the battery’s internal reactions during operations and ageing. However, accurately modelling the battery’s complex electrochemical reactions under different operation conditions is extremely difficult. On the other hand, the empirical models built using test data directly reflect the behaviour of a specific battery under a particular operation and time, with limited value for broader electric propulsion applications. As a result, the semiempirical models that use theoretical model formulas and experimentally determined model parameters combine both advantages and become the most commonly used modelling platform.
2.1. Battery Performance Model
2.1.1. Dual-Polarization Equivalent Circuit Model
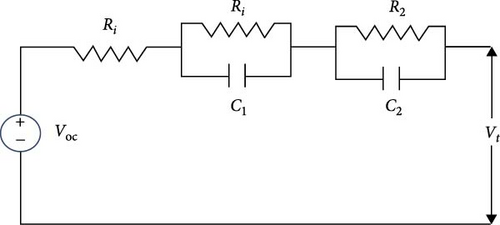
The widely used dual-polarization equivalent circuit modelling approach is adopted to represent the LFP battery performance due to its better accuracy, impedance test attainable model parameters and ease of use in electric propulsion system design and control. The equivalent circuit model simulates the battery’s concentration and electrochemical polarization processes. As shown in Figure 2, the model has an open-circuit voltage source, Voc; an internal resistor, Ri; and two resistance–capacitance circuits with R1, C1 and R2, C2. These model parameters need to be determined.
2.1.2. Dynamic Update of Performance Model
The performance of the Li-ion batteries, in terms of output voltage, will gradually decrease as the material deterioration causes its internal resistance to increase, reducing the battery’s current output capability. This power performance degradation is not captured if the same dual-polarization equivalent-circuit model is used. Using this less accurate fixed model in designing and operating the electrified propulsion system with BESS will lead to less optimal system design and energy management, failing to reach the full potential of the electrified propulsion system.
Therefore, dynamic adjustments to the parameters of the equivalent-circuit model are needed. To address this source of modelling error, we identify a way to capture the change of the internal resistance, Ri, in the equivalent-circuit model to reflect the power performance degradation of the battery. Based on previous literature [18, 20] and our modelling tests using the battery test data, we found that changes in the short-term and long-term effects of battery dynamic responses, V1 and V2, of the model are minimal, thus assuming capacitances C1 and C2 and resistances R1 and R2 remain unchanged during the battery’s operation life. The obvious upward trend of Ri as the battery ages is captured using continuously obtained battery operation data.
Model parameters can be determined using four approaches [21]: analytical equations, least-square-based methods, heuristic optimization algorithms and Kalman filter-based methods. In this work, we utilize the least-square-based methods and heuristic optimization algorithms to determine the parameters of the battery model.
A robust and efficient particle swarm optimization (PSO) global optimization search method is used. The variation trend of the battery’s internal resistance Ri, obtained using PSO, is shown in Figure 3.
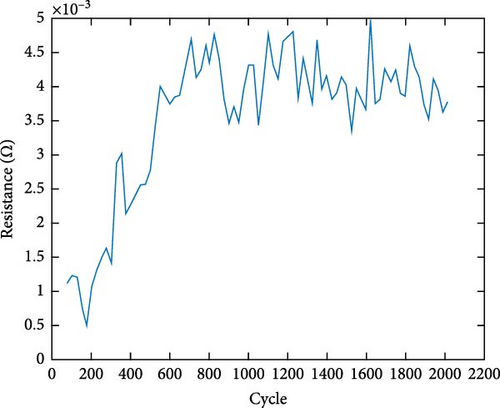
The periodic update of the BESS performance model in operating the electrified propulsion system is conducted directly using real-time operation data, thus improving the optimal energy management of the hybrid electric propulsion system.
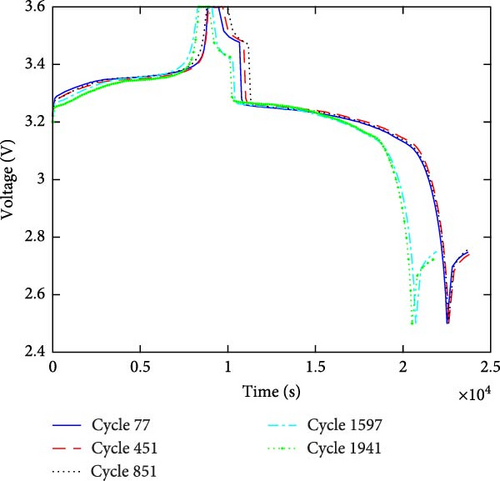
Several specific capacity cycle test data under capacity test cycles are shown in Figure 4. With increased cycle numbers, the charging and discharging time declines, indicating a gradual decrease in the battery’s maximum energy storage capacity.
Since the offline global optimization requires extensive computation and time, it is not conducive to the real-time estimation of the battery’s SOH. The battery voltage exhibits a continuous change in operation, and voltage values at various times are used in this work as features to estimate and predict the capacity and resistance of the battery.
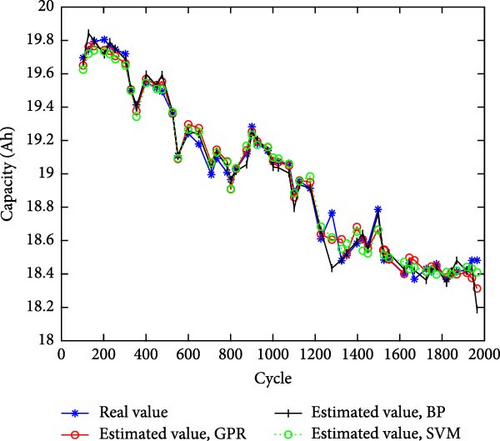
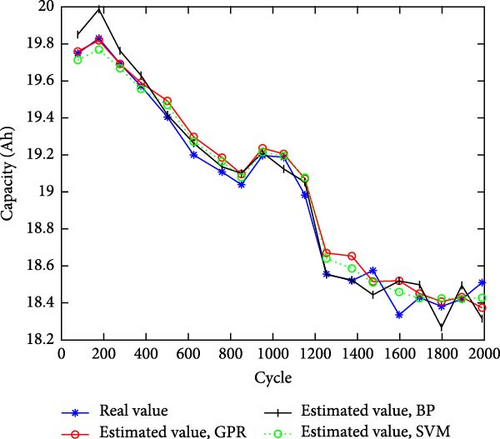
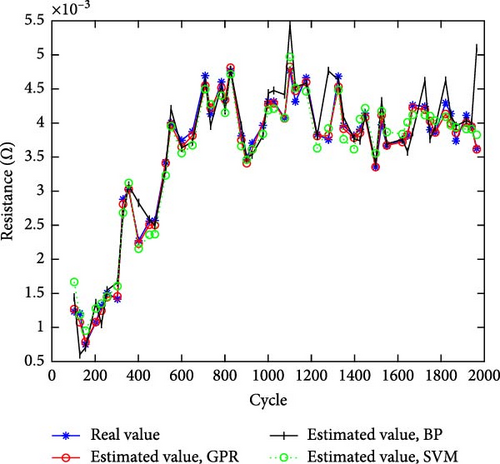
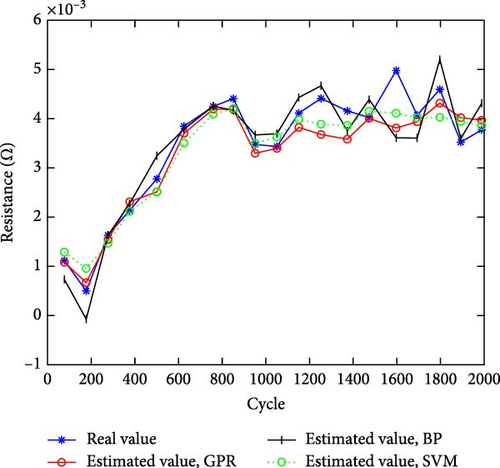
The data-driven modelling and prediction method uses historical data to predict the battery’s ageing trend without fully understanding the ageing mechanism and expansion law. Furthermore, this method does not build a specific physical model but a statistical or machine learning model using data. Since the data-driven method avoids the complex form identification and parameter fitting processes in theoretical and semiempirical modelling, the approach is more flexible and easier to use, thus attracting widespread attention from researchers worldwide. The tested data-driven modelling and prediction methods include GPR, BP neural network and SVM. The accuracy of the three data-driven methods is relatively high. Comparing the conclusions in Table 2 and Figures 5 and 6, GPR has the highest accuracy in the training set and takes 0.5 s on a regular Windows PC, which is much shorter than BP and SVM. The BP accuracy is relatively low, taking 0.7 s, and it is a comparatively efficient method. SVM has the highest accuracy in the test set, but it takes 2.7 s, which is longer than the other two algorithms.
| Testing object | RMSE | MAE | R2 |
|---|---|---|---|
| Train_GPR_Cap | 0.058710 | 0.002234 | 0.984227 |
| Train_BP_Cap | 0.073021 | 0.002247 | 0.975131 |
| Train_SVM_Cap | 0.053577 | 0.002267 | 0.986612 |
| Test_GPR_Cap | 0.081044 | 0.003346 | 0.973332 |
| Test_BP_Cap | 0.098060 | 0.004325 | 0.963013 |
| Test_SVM_Cap | 0.060300 | 0.002677 | 0.985237 |
| Train_GPR_R | 0.000076 | 0.019895 | 0.994817 |
| Train_BP_R | 0.000331 | 0.073684 | 0.900441 |
| Train_SVM_R | 0.000174 | 0.055141 | 0.972568 |
| Test_GPR_R | 0.000394 | 0.087962 | 0.893481 |
| Test_BP_R | 0.000477 | 0.162650 | 0.852312 |
| Test_SVM_R | 0.000341 | 0.116310 | 0.920083 |
- Abbreviations: BP, backpropagation; GPR, Gaussian process regression; MAE, mean absolute error; RMSE, root mean square error; SVM, support vector machine.
Compared with directly using the optimization algorithm that takes more than 2000 s, the data-driven method is more conducive to real-time updating of battery parameters during use, slowing down battery decay and prolonging battery life.
2.2. Battery Degradation Model
2.2.1. Empirical Battery Capacity Correction Model
The degradation of Li-ion batteries consists of energy capacity loss and power performance loss. The energy capacity loss of the batteries over their operational cycles is commonly observed over time at different operating temperatures. This capacity loss has a power–law relationship with time or charge throughput. The battery’s charge/discharge capacity degrades over its operational life of around 2000 full charge and discharge cycles. The speed of degradation depends upon many factors, including the use pattern (charge/discharge current [ ∗C], the depth of charge [DOC], the frequency of use and the use of the battery at almost full and almost empty) and operating temperature. The power output performance of a battery also slowly deteriorates over time but is less captured. In principle, the battery performance model for each charge/discharge cycle differs due to the SOH decay. These would lead to different equivalent-circuit battery performance models over the battery’s operation life. These changes can be captured using varying parameters of the dual-polarization model.
By adding this battery capacity correction term, the battery’s gradually degrading energy holding capacity, or capacity degradation, is captured. For a fresh battery, the five parameters of the equivalent circuit model, Ri, R1, C1, R2 and C2, were determined by fitting the battery test data with minimum root mean square error (RMSE) between the measured and model output voltage.
2.2.2. Updating Battery Capacity Degradation Model
As each specific BESS in an electrified propulsion system will undergo a unique operation cycle, the laboratory battery cycle life test determined the baseline degradation model parameters that need to be adjusted. As different hybrid electric propulsion systems go through variant operation conditions, the same batch of batteries will present the same degradation trend with some differences in deterioration characteristics and speed. Again, using this less accurate fixed model in operating the electrified propulsion system with BESS will lead to less optimal energy management, failing to reach the full potential of the electrified propulsion system.
Therefore, the parameters of the battery degradation model should be adjusted accordingly with battery ageing. With fixed and predetermined degradation model parameters, a specific BESS’s true performance and capacity capabilities will depart from the predicted values. A way to dynamically update these parameters using online acquired battery voltage and current data is introduced in this work. Specifically, we use Kalman filter-based methods to periodically update the parameters of the battery degradation model in real-time using battery operation data. The optimal energy management of the hybrid electric propulsion system is thus improved due to the more accurate battery performance and degradation models, as discussed in Section 2.1.2. and the following.
The extended Kalman filter (EKF) is an extension of the traditional Kalman filter that handles the challenges of nonlinear systems. While the standard Kalman filter provides optimal performance for linear systems, many real-world applications involve complex, nonlinear dynamics that demand more advanced estimation techniques. The EKF addresses this need by enabling reliable state estimation even when the system model includes nonlinearities. In this chapter, we utilize the EKF to account for the nonlinear behaviour in our degradation model. By linearizing the system around the current state estimate, the EKF approximates the nonlinearities, thus preserving the Kalman filter’s ability to minimize estimation error and enhance tracking accuracy.
| Cycles | A | B | C | D |
|---|---|---|---|---|
| 50 | 0.30 | −15,162 | 1516 | 0.77 |
| 1000 | 0.35 | −15,162 | 1516 | 0.80 |
| 2000 | 0.38 | −15,162 | 1516 | 0.83 |
3. PEMFC Performance and Degradation Modelling
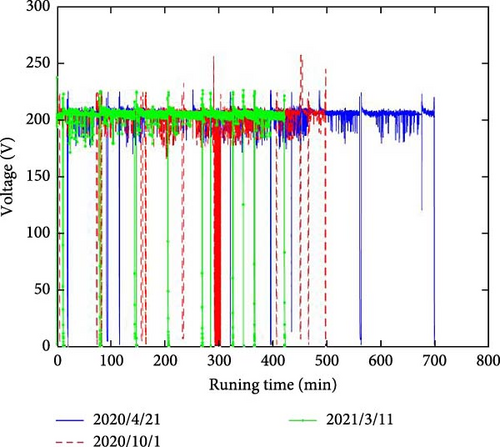
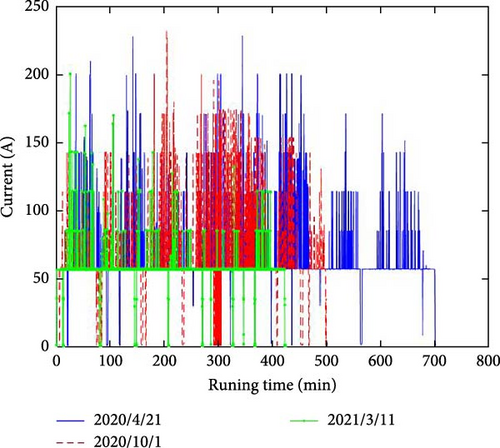
The FCEV operation data used in this study were recorded from operating a PEMFC and LFP BESS hybrid city bus. During the 1-year (361 days) operation, the PEMFC system worked 1908 h, and the FCEV travelled 50,935 km. The data sampling interval is 10 s. The voltage and current data of the PEMFC stack at different times are shown in Figure 8. The valuable real PEMFC operation data allow this work to build more accurate PEMFC performance and degradation models.
3.1. Semiempirical PEMFC Performance Model
The output power of the PEMFC system showed an obvious downward trend, and the corrosion of the electrocatalyst layer is an important factor affecting the durability and life of the PEMFC [22]. Catalyst degradation is due to platinum agglomeration and oxidation. Sustained degradation reduces the available catalyst surface in the anode and cathode, leading to power loss [22, 23].
The polarization curves of the PEMFC at different periods over 2 years are generated to observe and compare the SOH of the PEMFCs. The PEMFC system model is based on the semiempirical generalized steady-state electrochemical model (GSSEM) that can reliably predict the performance of a PEMFC system [24–26]. The polarization curves at different SOH were fitted to determine the parameters of the GSSEM models.
3.2. PEMFC Degradation Model Using Operational Data
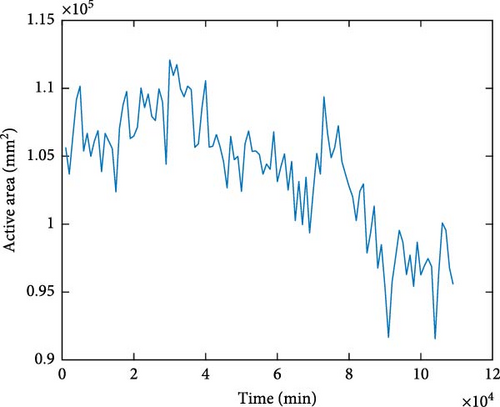
Compared to the previous work that used the observed voltage drop and nonlinear methods for predicting PEMFC lifetime [28, 29], the GSSEM model, if incorporated with this accurate PEMFC active area variation, can improve modelling accuracy by 54%. Furthermore, if the model simply accounts for the linear or nonlinear voltage decrease trend of the PEMFC rather than modelling the variation of the PEMFC’s active area, hydrogen consumption and PEMFC decay cannot be accurately estimated for different power outputs. The predetermined, fixed degradation model also cannot truly reflect the varying SOH of different PEMFC systems experiencing variant operation loads. Periodic updates of the PEMFC’s active area loss using online-acquired, recent PEMFC operation data present a more promising alternative.
This research is not aimed at investigating the detailed mechanism of PEMFC degradation but at taking the new findings and incorporating PEMFC degradation into the optimal design and control of the fuel cell hybrid propulsion system to improve system performance and extend PEMFC life.
3.3. Periodic Update of the PEMFC Degradation Model Using Machine Learning
In this work, the experiment data derived from the PEMFC active area, as shown in Figure 9, are used as the initial value of A in the model. Rather than directly using the recorded A value over the whole year of operation or the linear/nonlinear trend model derived from these data, for a similar PEMFC system, we use the acquired PEMFC operation data to obtain the value of A over a sliding window of 3 days, to update its value dynamically. The size of this window satisfies the slow change of A value and reduces computation time.
During the operation of the PEMFC, the current and voltage can be measured in real-time. Different current and corresponding voltage values and usage time are inputs to calculate the PEMFC’s active area estimate, A. Three different machine learning estimation algorithms are applied and compared: BP, GPR and SVM. The results are shown in Figure 10. The R2 for the three algorithms, BP, GPR and SVM, are 0.853, 0.901 and 0.902, respectively. These results show that SVM offers the highest prediction accuracy among the algorithms, closely followed by GPR. The strong performance of these data-driven models, particularly SVM, indicates that the active area can be reliably predicted, with minimal deviation between predicted and actual values.
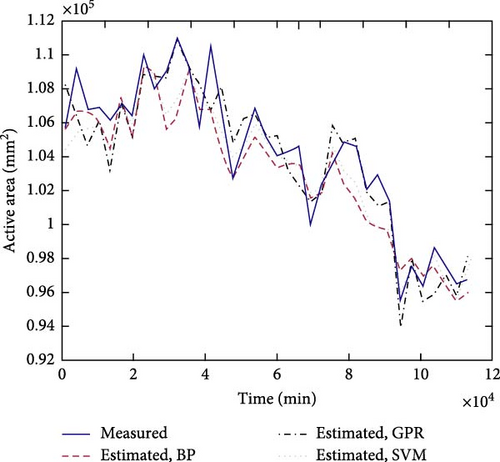
As an important parameter of the PEMFC performance and degradation models, the predicted active area indicates the PEMFC’s performance and level of degradation. This parameter is updated dynamically for each PEMFC system during operation. The more accurate PEMFC performance and degradation model supports more accurate optimal power control and EMS.
We applied the stated finding and used the new models in the PEMFC hybrid electric propulsion system design and control optimizations.
4. Optimal EMS for Hybrid Propulsion System
The PEMFC system and BESS are the two key components of the hybrid electric propulsion systems. With the accurate and updated performance and degradation models of the BESS and PEMFC, their actual operational lives under a specific operating sequence of the hybrid electric vessel (or vehicle) can be precisely predicted. The optimal propulsion system design and its optimal EMS can be obtained by identifying the best powertrain configuration, component sizes and, most importantly, the well-coordinated PEMFC and BESS system operations. As a result, the best balance between fuel consumption reduction and low impact on PEMFC and BESS operation life can be obtained to achieve the minimum LCC of the FCEV. This section uses the optimal EMS development of a PEMFC hybrid electric ferry to demonstrate the application of the newly introduced BESS and PEMFC system performance and capacity degradation models in FCEV propulsion system design and control optimizations.
4.1. Test Case—A Hybrid Electric Marine Vessel
Marine vessels are typical heavy-duty propulsion applications that require significant propulsion power and energy. A PEMFC and BESS hybrid propulsion system presents an ideal clean marine propulsion, overcoming many critical drawbacks of pure battery electrical systems. A real vehicle and passenger ferry is used to demonstrate the introduced new methods.
4.1.1. Vessel Operation Profile
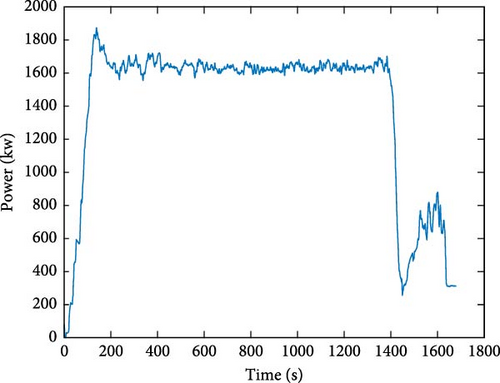
The PEMFC and BESS hybrid electric propulsion system of a medium-sized vehicle and passenger ferry (Figure 11) operated by BC Ferries in British Columbia, Canada, was used as a test bed. The ship travels between Salt Spring Island (Fulford Harbour) and Victoria (Swartz Bay), with the technical specifications in Table 4. The representative required propulsion power of the ferry during the round-trip voyage is shown in Figure 12.

| Max speed | 15.3 knots |
| Length | 110 m |
| Displacement | 2942 tones |
| Vehicle/passenger capacity | 92/450 |
| Rated power of FC module | 400 kW |
| Energy capacity of battery cell | 57.6 Wh |
4.1.2. PEMFC-BESS Hybrid Propulsion System for the Vessel
The hybrid electric propulsion system of the proposed PEMFC-BESS ferry is shown in Figure 13. Hybrid electric propulsion improves fuel economy and propulsion efficiency with zero-tailpipe emissions.

This research aims to improve the optimal EMS of the hybrid electric propulsion system to more precisely count the BESS and PEMFC performance and capability degradations and resulting operation life loss under the ship’s specific operation on this route. Improving the globally optimal EMS aims to improve fuel efficiency and extend the BESS and PEMFC systems’ operation lives simultaneously to achieve the minimum LCC of the ferry’s hybrid electric propulsion system. Furthermore, building on top of the EMS optimization, the optimal sizing of the propulsion system’s key components can also be conducted, as in our team’s recent work [17, 21].
The LCC minimization formulation of Equation (13) determined the optimal PEMFC system and BESS sizes in the hybrid electric ship propulsion system and the system’s baseline optimal EMS. The global optimization problem is formulated with two levels and solved simultaneously, with the component size design optimization at the top and the EMS optimization using DP at the bottom. Our earlier work in [4, 17] discussed details on the implementation and solution method. This work primarily focuses on the dynamic updates of the BESS and PEMFC system’s performance and degradation models and the use of these models to update the optimal EMS of the FCEV to support this global optimization with considerably improved results.
The PSO algorithm was used to solve the formulated global optimization problem. The resulting optimally sized LFP BESS has a nominal capacity of 18 Ah, 270 cells in series and 100 cells in parallel, and the PEMFC system has five 400 kW subsystem modules.
4.2. Optimal Vessel EMS Considering LCC
4.2.1. Battery and PEMFC Degradation and LCC
To meet the need to accurately predict battery performance degradation under various operating conditions and allow the model to be used for real-time optimal energy management with moderate computational requirements. Battery capacity loss is a function of operation conditions, including operating temperature, overall amp-hours and discharge rate. This work uses the semiempirical performance degradation and operation life model for LFP batteries [30, 31] as indicated in Equation (5).
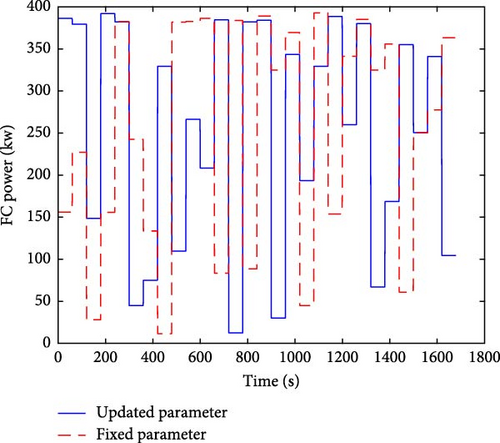
The model parameters, A, B, C and D, influence the propulsion system’s performance and warrant adjustments to achieve and maintain the optimal power control and EMS. These data-fitted parameters are updated through the Kalman filter using continuously acquired operation data in this work. Our modelling and simulations proved the necessity of updating the PEMFC system and BESS’s degradation model parameters. In Figures 14 and 15, the power allocations to the PEMFC system and BESS in the fuel cell hybrid electric system are shown by the blue solid curves. The red-dotted curves, on the other hand, presented different optimal power allocation results using the dynamically adjusted degradation model parameters. The optimal power control and distribution using degradation models with dynamically adjusted parameters can reduce the top-level LCC by 1.03%. For different vehicles or vessels under variant operations, updates of the performance and degradation model parameters as their PEMFC and BESS age with different SOH become essential.

4.2.2. Fuel Efficiency
4.2.3. Globally Optimal System Design and Operation
The optimal EMS seeks to minimize the overall costs, including hydrogen fuel consumption and degradations of both the PEMFC system and BESS, over the operation cycle while satisfying given constraints. During the ferry operation, the SOH of the PEMFC and BESS are adjusted regularly as shown in Figure 16. When the SOH changes, the control and EMS will be modified accordingly.

When a ferry operates on the same route, its propulsion power is assumed to largely follow a statistical operation profile, and the optimal sizes of the PEMFC system and BESS and the baseline optimal EMS of the propulsion system can be identified through the global optimization solved using PSO. However, during the actual vessel operations, the instant ship operation profile will slightly depart from its norm; the PEMFC system and BSS will thus work differently, leading to variant performance and capacity degradations. Therefore, the optimal EMS must be adjusted using the dynamically updated degradation models. Not updating these models and using the same baseline optimal EMS will likely accelerate BESS and PEMFC system degradations due to their overuse and increase hydrogen fuel consumption due to departing from the true optimal system efficiency.
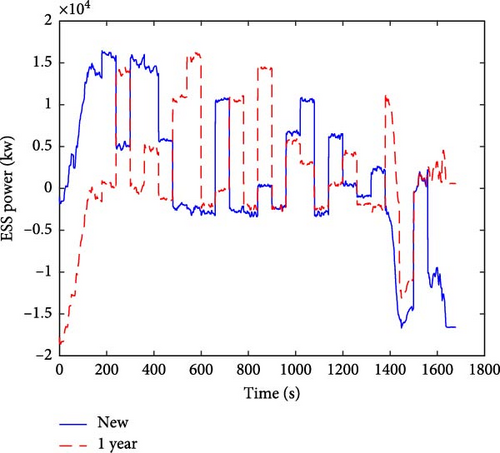
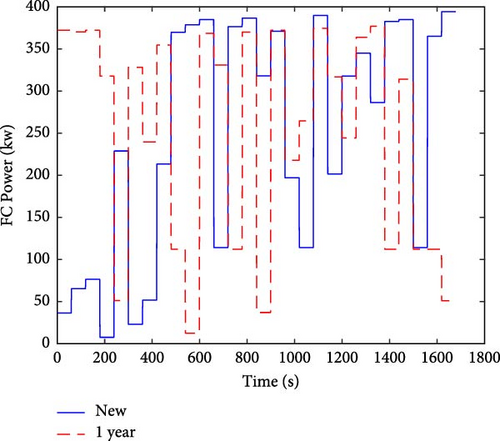
For the new and 1-year-old BESS and PEMFC systems, the amount of propulsion power provided by the BESS under the optimal EMS is shown in Figure 17. There is a marked difference in how the energy is distributed. When the ESS and PEMFC systems are new, the PEMFC has excellent SOH and strong performance capability. When there is a high propulsion power demand, the PEMFC system can independently supply power at a higher efficiency without battery assistance (e.g. 500–650 s in Figures 17 and 18). After 1 year of use, the performance of PEMFC declined. If the PEMFC system provides the same high power, it will have accelerated performance degradation. Therefore, a reduced PEMFC power allocation with more battery power assistance can produce less system LCC, resulting in a minor accelerated degradation of the BESS. This needed shift is due to the different contributing costs and cost sensitivities of the PEMFC system and BESS. The global optimization automatically identifies the best balance to achieve a minimum LCC.
To better illustrate the effects of the optimal EMS, considering different contributing factors, incorporating or ignoring the PEMFC system and BESS ageing and dynamically updating the ageing parameters, the ferry sailing crossing costs of various cases are shown in Table 5. The cost consideration is limited to the fuel consumption cost of the PEMFC, FCop, the cost associated with the degradation of the PEMFC system, FCdeg, and the cost associated with the degradation of the BESS, ESSdeg.
| SOH | Case 1 | Case 2 | Case 3 and SOH | ||
|---|---|---|---|---|---|
| New | New | New | 1YrOPT | 1YrNDC | |
| FCop | 161.06 | 179.95 | 180.09 | 186.68 | 241.00 |
| FC deg | 434.47 | 68.93 | 68.66 | 83.93 | 279.32 |
| ESS deg | 18.64 | 20.14 | 19.92 | 28.00 | 29.70 |
| Total | 614.16 | 269.01 | 268.67 | 298.61 | 550.00 |
| Rel. value | 2.290 | 1.001 | 1 | 1.111 | 2.047 |
- •
In Case 1, only hydrogen fuel consumption is minimized, as in the past research approach.
- •
In Case 2, as in many recent publications, hydrogen fuel consumption and PEMFC degradation are considered simultaneously without considering BESS degradation.
- •
In Case 3, balanced hydrogen fuel consumption, PEMFC degradation and battery degradation were found. In these comparisons,
- •
The New condition means that both the PEMFC system and BESS are new.
- •
The 1YrOPT condition means that the PEMFC system and BESS have been used for 1 year—the best result to be further explained.
- •
The 1YrNDC condition means that changes in the performance and capacity degradation model parameters of the PEMFC system and BESS are not considered. After being used for 1 year, the propulsion system’s optimal power control and EMS are still based on the same static PEMFC system and BESS performance and degradation models.
- •
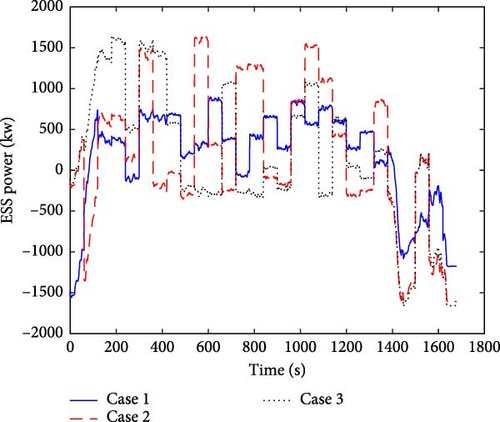
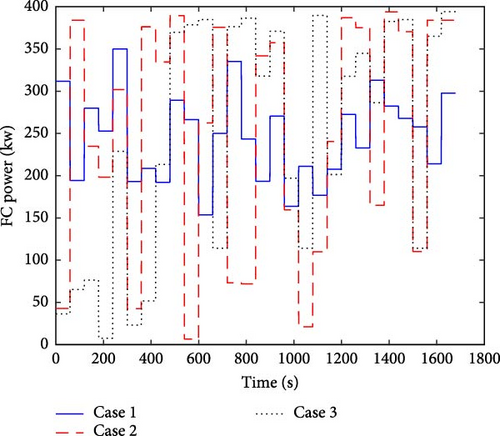
In Case 1, substantial harm is inflicted upon the PEMFC system despite significantly reducing hydrogen consumption, emphasizing the pivotal importance of PEMFC degradation considerations. In Case 2, although hydrogen consumption slightly increased, the PEMFC decay diminished to 16%, leading to a 56.2% reduction in each ferry crossing cost. Case 3 incorporates additional battery attenuation, curbing LCC by 56.3%.
Upon 1 year of PEMFC system and BESS usage, notable attenuation emerges, as shown by the three conditions of Case 3. If control strategies remain static postageing, crossing cost surges to over twice the PEMFC system and BESS’ initial state from $268.67 to $550 or 205%, hastening system ageing. However, by proactively accounting for the PEMFC system and BESS degradation dynamics, ferry crossing costs only increased by 11% of the original value after 1 year of use. The crossing cost was reduced by 45.7% compared to the unadjusted attenuation parameter scenario. According to industry standards, automotive fuel cells are expected to have a service life of ~5000 h under typical vehicle operating conditions [5]. Adhering to this criterion, it is reasonable to calculate the LLC of PEMFC systems and BESS based on a 2-year operational period. The method in this study has demonstrated its effectiveness in reducing the LLC of PEMFC systems and BESS. Our results show that the LLC can be reduced by at least $2,936,235 (US) over the 2-year operational period, meeting commercial requirements while maximizing cost savings.
For the new PEMFC system and BESS, the amount of propulsion power provided by the BESS under the optimal EMS in different cases is shown in Figures 19 and 20. In Case 1, since only the hydrogen fuel consumption is considered, the PEMFC has been operating near the highest efficiency point to minimize the fuel consumption, and the decay of PEMFC is fast. In Case 2, since the degradation of the BESS is ignored, the power fluctuation on the battery is larger compared to Case 3, resulting in a larger attenuation. The best result with the minimum crossing cost after 1 year of use is $298.61, as shown under the “1YrOPT” condition of Case 3 in Table 5. The corresponding BESS and PEMFC system power outputs, controlled by the dynamically optimized EMS, are shown in Figures 19 and 20 under Case 3.
5. Conclusion
This study introduced advanced performance and degradation models for Li-ion batteries and PEMFCs, enhancing the EMS by updating PEMFC and BESS model parameters with real-time current and voltage data. A comprehensive optimization method was proposed for power system component sizing and EMS strategy to achieve the lowest LCC, taking into account hydrogen fuel consumption, as well as PEMFC and BESS capacity and performance degradation. A novel Li-ion battery and PEMFC degradation modelling approach improved the universal optimal EMS for FCEVs, reducing the LCC of the PEMFC–battery hybrid electric ship propulsion system by $2,936,235.
Conflicts of Interest
The authors declare no conflicts of interest.
Funding
The Qanittaq Clean Arctic Shipping Initiative of the Canada First Research Excellence Fund (CFREF) and the Natural Sciences and Engineering Research Council (NSERC) supported this work.
Acknowledgments
The Qanittaq Clean Arctic Shipping Initiative of the Canada First Research Excellence Fund (CFREF) and the Natural Sciences and Engineering Research Council (NSERC) supported this work. FCEV operation data from Ning Zhou of the South China New Energy Automotive Industry Promotion Center are gratefully acknowledged.
Open Research
Data Availability Statement
The authors will supply the relevant data in response to reasonable requests.


