Highly Efficient DC–DC Boost Converter Achieved With Improved MPPT-Based Raspberry Pi for Enhancing Photovoltaic System Generation
Abstract
The operation of photovoltaic (PV) panels in partial shade (PS) conditions (PSCs) lowers the quantity of energy generated due to the hot spots that increase the power loss. In this scenario, a maximum power point tracker (MPPT) is necessary to monitor the power–voltage curve, which features multiple local peaks in addition to one global peak (GP). The GP could not be extracted from the panel at PSCs using traditional MPPT techniques such as hill climbing (HC), perturb and observe (P&O), and incremental conductance (IC). Therefore, this paper proposes a new construction of MPPT simulated via a Raspberry Pi 4 controller programed through a recent bald eagle search (BES) algorithm. Because of its substantially enhanced diversification, which aids in avoiding local peaks, the suggested BES can capture the global power of PV during PSCs. The Raspberry Pi 4-BES MPPT in the recommended hardware adjusts the direct current (DC)–DC boost converter’s duty cycle based on its inputs, which are the voltage and current from the PV panel output. Eight shade patterns are studied, and the fetched results through the proposed BES are compared to other programed approaches of skill optimization algorithm (SOA), gray wolf optimizer (GWO), and particle swarm optimization (PSO). Additionally, the proposed tracker’s Simulink model is created and evaluated in relation to the experimental hardware. Moreover, the power errors and efficiencies of all considered approaches are calculated in both simulation and experimental analyses. The results revealed that the least errors are 0.0018% and 0.296% obtained through the proposed Raspberry Pi 4-BES MPPT in simulation and experimental, respectively. Also, in the simulation and experimental setting, the recommended tracker yielded the highest efficiencies of 99.99% and 99.92%, respectively. The suggested Raspberry Pi 4-BES MPPT is praised for being a useful tracker for monitoring the GP of PV panels at various PSCs.
1. Introduction
Recently, the renewable energy systems, especially photovoltaic (PV), have gained more attention due to environmentally friendly and their abundant characteristics. The generation of PV system is altered by meteorological situations like temperature and irradiance. The relation between the PV output voltage and generated power is nonlinear with one peak power; it is essential to insert a control circuit for operating the PV array at the voltage resulting in the peak point. This can be accomplished via direct current (DC)–DC converter controlled with a maximum power point tracker (MPPT); conventional technologies of MPPT, like hill climbing (HC), incremental conductance (IC), and perturb and observe (P&O), are the most widespread and easy to implement. However, there are some problems with using these traditional technologies, especially when the PV system operates at partial shade (PS); in such cases, the power–voltage (P–V) curve comprises many local peaks and unique global peak (GP). During this circumstance, the traditional technologies may catch one of the local peaks, thinking that it is the global one; in such cases, the output power loss is increased, causing lower utilization of the PV generation. Therefore, it is essential to utilize approaches with high search ability to prevent extracting the local peak from the system [1, 2]. These approaches are known as global MPTTs (GMPPTs), and they can be categorized into direct search approaches, two-stage approaches, and artificial intelligence (AI) approaches.
A modified bat approach was introduced to monitor the PV system global power at different PS conditions (PSCs) [3]; the authors used initial values of bats close to the position of peaks in the P–V curve to mitigate the convergence time. Moreover, the algorithm has been reinitialized and the memorized GP was updated to improve the approach performance. A skipping scheme approach was utilized to design MPPT with a PV system at rapidly variable PS conditions [4]. Both approaches were compared in terms of voltage track, transient efficiency, and convergence speed. Moreover, an experimental setup using TMS320F240 DSP on the dSpace DS1104 platform was conducted. A smart MPPT has been simulated using a nested bat algorithm to capture the GP from the PV system at PS [5]; the presented algorithm is composed inner loop representing the MPPT and the outer loop simulating the fitness function. Makhloufi and Mekhilef [6] tried to solve the problems associated with particle swarm optimization (PSO)-based MPPT in PV system through introducing a logarithmic PSO tracker. The presented technique mitigated the power oscillation at the search process and hurried the tracking convergence speed. A bio-inspired whale optimization approach (WOA) was presented to monitor the GP harvested from the PV system at PSC [7], the presented approach was reinitialized to improve its performance during tracking the GP. A control scheme representing MPPT integrated between a fractional P&O tracker and fractional proportional–integral controller has been established in [8] to enhance the PV system generated power at rapidly variable PS conditions. Moreover, the parameters of the presented controller have been identified using hunter–pray optimizer. Fathy et al. [9] introduced a modified tunicate swarm algorithm to enhance the PV system operation through tracking the point of GP. They incorporated two random numbers in the updating process of the approach to enhance its search ability. A tracker based on a fly search agent approach has been presented to detect the PV system GP at PS conditions via comparing the anticipated peak with the global one [10]. Additionally, benchmark shading patterns have been analyzed to assess the established tracker. The problem of long-time tracking associated with the use of the traditional power feedback method in detecting the maximum power from the PV module/array has been solved through introducing an improved version of the algorithm, which is available during rapidly changes in weather [11]. An adaptive sequential Monte Carlo tracker was introduced to enhance the operation of the PV system through predicting the GP during PS operation [12]. The established tracker has been validated under rapid changes in solar irradiances and temperatures. Chao and Zhang [13] and Chao and Zhang [14] enhanced the operation of the PV module/array operated at PS condition through developing a high voltage (HV) step-up converter controlled using an improved firefly algorithm. The GP of a partially shaded PV system has been tracked using PSO with Arduino Uno and DC–DC boost converter [15]. The presented tracker has been assessed via conducting a comparison with conventional approaches like IC and P&O. Artetxe et al. [16] overcame the problem of rapid oscillation around the GP of PV system generating from the use of conventional trackers through employing reinforcement learning control of deep deterministic policy gradient. A methodology incorporated a dandelion optimizer was developed to present MPPT in a PV system for detecting its GP under PSCs [17]. The generation of grid integrated PV system was enhanced through MPPT designed using the Takagi–Sugeno Fuzzy technique-based sliding mode controller [18]. A single-phase inverter used for PV array has been designed using LabView software while the array maximum power has been detected using the P&O approach [19]. Also, the authors designed a low pass filter for mitigating the harmonics at the established inverter output. The duty cycle of the DC–DC converter linked to the PV terminals has been controlled to its optimum value with the aid of values of load resistance and its value at MPP [20]. The load resistance has been calculated using two sensors, while the value of demand at the point of maximum power was estimated using an artificial neural network (ANN). A comparison between type 2 Fuzzy logic and P&O approaches used as MPPT with PV system has been conducted during three distinct scenarios of temperature, irradiance, and environment factors [21]. A salp swarm insisted moth flame algorithm has been utilized to monitor the GP of PV system at PSCs through adapting the duty cycle of the converter [22]. The performance of the P&O tracker used for detecting the GP of PV generator has been enhanced through inserting power lock conditions [23]. A convolution neural model was developed in [24] to enhance the generation of PV system via predicting its GP. The solar PV system’s GP was tracked using a robust antlion optimizer [25]. The study in [26] focused on the application of machine learning-based ANN and support vector regression algorithms to forecast the irradiance in PV system and facilitate the task of MPPT in quickly exploiting the best decision. Many approaches employed as MPPTs for PV system during PSCs have been reviewed with clarifying their pros and cons [27]; they have been classified as conventional, improved, and AI approaches. Mitigating the cost of MPPT with PV system at PSCs was the target of work presented in [28], and it has been achieved through introducing a modified current sensorless methodology. Also, a buck-boost converter controlled via dSpace DS1104 was established to evaluate the presented tracker experimentally. The operation of grid-connected solar PV system has been improved using an optimized multilayer feed-forward ANN tracker through a metaheuristic approach of ant colony optimizer [29]. An adaptive Fuzzy PI controller was introduced as MPPT to get the GP from PV system operated at PSCs [30], and the tracker parameters have been estimated using PSO. A gray wolf optimizer (GWO) tracker has been introduced to improve the generation of PV system at PSC, and the controller performance has been evaluated via calculating the root mean square error and global efficiency [31]. The behavior of the P&O approach during monitoring the maximum power of PV system has been improved through integrating a finite-set model predictive control scheme [32]. Many modern metaheuristic approaches employed in detecting the GP of PV system under PSCs have been studied and assessed through the Monte Carlo technique [33]. Also, the authors presented a variable vortex search approach with variable step size to improve the operation of MPPT with PV system. An optimized Fuzzy logic controller through the Cuckoo search algorithm was established to get the GP from PV system in nonuniform weather conditions [34]. The GP of PV array has been obtained using an optimized fractional nonlinear synergetic controller [35]. A mayfly optimizer has been used to design MPPT for PV system to improve its harvested energy [36]. A modified P&O approach was introduced in [37] to improve the PV system efficiency. A hybrid MPPT technique of genetic algorithm (GA) and fractional open circuit voltage was presented to improve the PV system efficiency [38]. A Fuzzy logic tracker optimized via an improved farmland fertility optimizer has been established with PV system to track its GP [39]. A hybrid teaching–learning and artificial bee colony technique has been used to detect the GO of PV system [40]. The Raspberry Pi 4 controller was programed by two approaches of PSO and Cuckoo search to monitor the GP from PV panel under eight distinct shade patterns [41]. Raj and Naik [42] used an adaptive neuro Fuzzy inference system to predict the duty ratio at GP of PV system at PSCs. A voltage scanning method was developed to improve the PV system conversion efficiency [43]. An overview of some AI-based approaches employed to design MPPT for PV system is given in Table 1; the authors were interested in the algorithms’ search ability at PSCs, complexity, convergence speed, oscillation around the GP, and efficiency.
| Approach | Search ability at PS | Complexity | Convergence speed | Oscillation around GP | Efficiency | Demerits |
|---|---|---|---|---|---|---|
| Modified bat [3] | High | High | Fast | High | High | Large memory size is required |
| Skipping scheme [4] | High | Average | Fast | Average | High | Only one shade pattern was analyzed |
| Nested bat [5] | High | High | Average | Low | High | Low convergence rate at the last stage |
| Logarithmic PSO [6] | High | High | Fast | Low | High | Computational complexity is high |
| Whale optimization [7] | High | Average | Slow | Low | High | Slow convergence speed and high probability of falling in local optima |
| Fractional P&O [8] | High | High | Slow | Average | High | Low convergence rate |
| Modified tunicate swarm [9] | High | High | Fast | Average | High | Computational complexity is high |
| Fly search agent [10] | High | High | Slow | Average | High | Consumed time is large |
| Improved power feedback method [11] | Poor | High | Slow | High | Poor in PS | High probability of capturing local peak |
| Adaptive sequential Monte Carlo [12, 33] | Average | High | Average | High | Average |
|
| Improved firefly [13, 14] | High | High | Fast | Low | High | |
| PSO [15, 41] | Average | Low | Fast | High | Average | High probability of falling in local optima |
| Deep deterministic policy gradient [16] | Average | High | Fast | Low | Average | Computational complexity is high |
| Dandelion optimizer [17] | Average | Average | Fast | Low | Average | Large consumed time and high probability of falling in local optima |
| Fuzzy logic [18, 21, 30, 34, 39] | Poor | Average | Average | Low | Poor in PS | Inaccurate due to linguistic variables |
| P&O [19, 23, 32, 37] | Poor | High | Fast | Average | Poor in PS | Efficiency is low at PS operation |
| Salp swarm insisted moth flame [22] | Average | High | Average | Low | Average | Computational complexity is high |
| ANN [24, 26, 29] | Poor | Average | Average | Low | Poor in PS | Large datasets are required |
| Antlion optimizer [25] | Average | Average | Fast | Low | Average | High probability of falling in local optima |
| Gray wolf optimizer [31] | Poor | High | Average | High | Poor in PS | Computational complexity is high |
| Mayfly optimizer [36] | Poor | Average | Fast | Low | Poor in PS | Convergence accuracy is low |
| GA [38] | Average | High | Fast | Low | Average | Early convergence is high |
| Teaching–learning and artificial bee colony [40] | High | High | Slow | Low | High | Computational complexity is high |
| ANFIS [42] | High | High | Average | High | High | Computational complexity is heavy and consumed time is large |
| Voltage scanning [43] | High | High | Average | High | High | Computational complexity is high |
| Proposed | High | Low | Fast | Low | High | - |
- Abbreviations: AI, artificial intelligence; ANFIS, adaptive neuro-fuzzy inference system; GA, genetic algorithm; GP, global peak; MPPT, maximum power point tracker; P&O, perturb and observe; PS, partial shade; PSO, particle swarm optimization; PV, photovoltaic.
Numerous documented methods face difficulties in ensuring the highest quality PV system generation under PSCs; certain approaches necessitated enormous memory sizes in addition to lengthy implementation times. Furthermore, a few reported methods have slow convergence, which makes tracking extremely challenging. Additionally, because of their high early convergences and low efficiency, the others have a significant likelihood of entering local optima without collecting GP.
The motivation of proposing a new bald eagle search (BES) strategy as an MPPT for PV system is bridging gaps raised via the published approaches; the BES is able to locate new positions and promote diversification through movement in a spiral direction. Furthermore, it can elude local solutions and has a quick convergence rate. These advantages allow the proposed BES to quickly obtain the GP of the PV system under any PSC. The suggested BES–MPPT is simulated using Simulink/MATLAB, while an experimental setup using Raspberry Pi 4 embedded board is conducted for PV panel operated at distinct PSCs. The proposed algorithm is assessed via comparison with the skill optimization algorithm (SOA), GWO, and particle swarm algorithm (PSO).
- •
A new Raspberry Pi 4-based MPPT programed through a recent BES algorithm is suggested to extract the GP of PV panel at PS.
- •
The proposed tracker is assessed on PV panel installed inside the College of Engineering Building, Jouf University, Saudi Arabia, under eight shade patterns.
- •
A comparison of SOA, GWO, and PSO is conducted.
- •
The results proved the strength of the proposed Raspberry Pi 4-based BES–MPPT.
The paper is arranged as follows: Section 2 presents the PV panel model, while Section 3 handles the main aspects of the BES approach. The embedded MPPT system-based Raspberry Pi is explained in Section 4. Section 5 presents the results and discussions, while the conclusions are handled in Section 6.
2. PV Panel Model
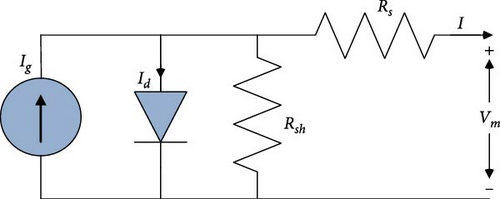
A single-diode model equivalent circuit shown in Figure 1 is used to simulate the PV panel; it represents the most popular PV model as it good straightforward; the panel output current can be expressed as follows:
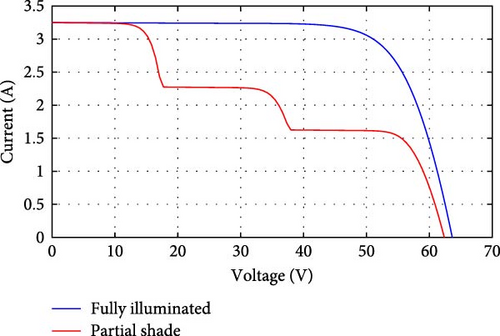
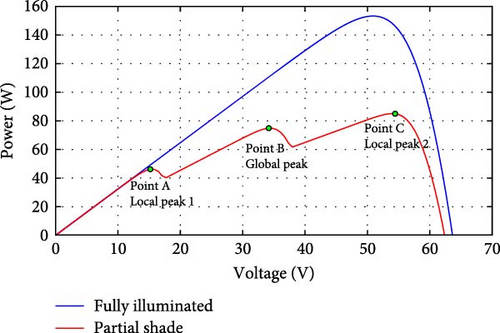
The PV panel curves at fully illuminated, and PSCs are shown in Figure 2. The current–voltage curves for normal and PSCs are shown in Figure 2a while when the PV panel operates at normal conditions, fully illuminated, its P–V curve has one GP, as shown in Figure 2b. On the other side, at PS operation the P–V curve has several peaks, points A and C in Figure 2b, and one GP, point B in Figure 2b, which is the best operating point for the panel. The GP can be tracked through installing MPPT that controls DC–DC converter based on the panel output voltage and current. The study described in [44] included thorough explanations of the difficulties associated with partial shading and how it affects MPPT performance.
3. BES Algorithm
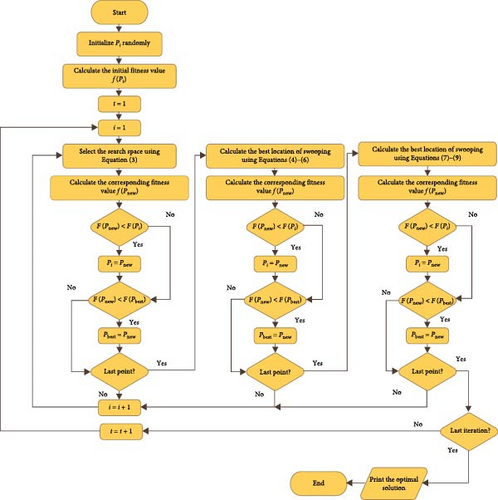
BES is a nature-inspired algorithm that represents the hunting strategy of bald eagles to lure the prey (fish) [45]. In this approach, three phases are conducted: search space selection, searching phase, and swooping. In the first stage, the search area is selected on the basis of the number of fishes, and the prey moves toward the area with the largest number of fishes in the second stage. Finally, the bald eagle turns from the best location predicted in the second stage to the prey position for attacking it.
3.1. Search Space Selection
3.2. Searching Phase
3.3. Swooping Phase
-
Algorithm 1: Pseudo code of the suggested BES-based MPPT.
-
1: Enter the BES number of iterations (tmax) and population size (N).
-
2: Input the data of PV panel and DC–DC converter.
-
3: Fort = 1:tmaxdo
-
4: Fori = 1:N do
-
Selection phase
-
5: Set the duty cycle of the converter at random.
-
6: Measure the PV panel’s initial power output (f (Pi)).
-
7: Choose the search area using Equation (3).
-
8: Determine the comparable power generated by PV panel (f (Pnew,i)).
-
9: iff (Pnew,i) >f (Pi) then
-
10: Pi = Pnew,i
-
11: iff (Pnew,i)>f (Pbest,i) then
-
12: Pbest,i = Pnew,i
-
13: end if
-
14: end if
-
15: i = i + 1
-
16: end for
-
Search phase
-
17: Fori = 1:N do
-
18: Apply Equations (4)–(6) to figure out the optimal swooping position.
-
19: Measure the comparable power generated by PV panel (f (Pnew,i)).
-
20: iff (Pnew,i)>f (Pi) then
-
21: Pi = Pnew,i
-
22: iff (Pnew,i)>f (Pbest,i) then
-
23: Pbest,i = Pnew,i
-
24: end if
-
25: end if
-
26: i = i + 1
-
27: end for
-
Swooping phase
-
28: Fori = 1:N do
-
29: Apply Equations (7)–(9) to figure out the optimal swooping position.
-
30: Measure the comparable power generated by PV panel (f (Pnew,i)).
-
31: iff (Pnew,i)>f (Pi) then
-
32: Pi = Pnew,i
-
33: iff (Pnew,i)>f (Pbest,i) then
-
34: Pbest,i = Pnew,i
-
35: end if
-
36: end if
-
37: i = i + 1
-
38: end for
-
39: t = t + 1
-
40: end for
-
41: Print the PV panel’s ideal duty cycle and the associated power it produces.
4. The Embedded MPPT System-Based Raspberry Pi
The component of the embedded MPPT system is given in Figure 4. The heart of this system is the Raspberry Pi 4 board [46], which is selected for its performance, the important number of input and output pins, and the flexible development environment. In fact, the Raspberry Pi 4 Model B is a versatile single-board computer featuring a powerful Broadcom BCM2711 quad-core Cortex-A72 processor clocked at 1.5 GHz, making it significantly faster than its predecessors. It offers multiple RAM options, with choices of 2, 4, or 8 GB LPDDR4-3200 SDRAM, catering to various computing needs. Equipped with dual micro-high-definition multimedia interface (HDMI) ports, this minicomputer supports resolutions up to 4K at 60 Hz, providing excellent multimedia capabilities. Its connectivity features include Gigabit Ethernet, dual-band Wi-Fi (2.4 and 5 GHz), and Bluetooth 5.0. With universal serial bus (USB) 3.0 and USB 2.0 ports, a microSD card slot for storage, and 40 general-purpose input/output (GPIO) pins for interfacing with external devices, the Raspberry Pi 4 offers an extensive range of options to explore projects encompassing desktop computing, internet of things (IoT), robotics, and more. Its compact form factor and compatibility with several operating systems (OSs), involving Raspberry Pi OS and Linux distributions, make it a versatile and affordable choice for diverse applications.
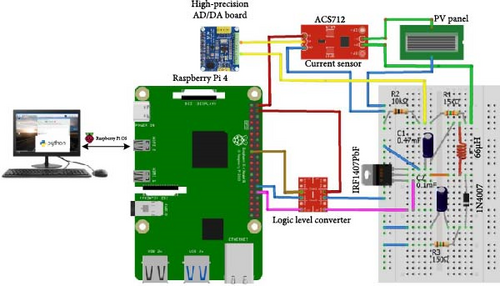
In our work, the Raspberry Pi 4 was selected for its powerful quad-core advanced RISC (reduced instruction set computing) machine (ARM) Cortex-A72 processor, which provides the necessary computational capabilities for real-time processing and handling external hardware like the boost converter. Its extensive GPIOs, support for various libraries, and full Linux OS make integration and scalability easier. Compared to other microcontrollers like Arduino, it offers superior processing power and memory, while its active community and cost-effectiveness make it more attractive than other single-board computers such as BeagleBone or Odroid.
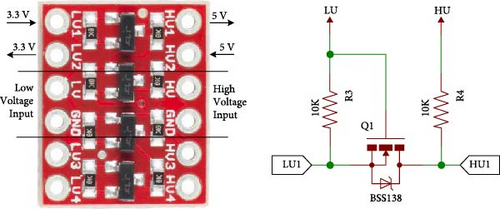
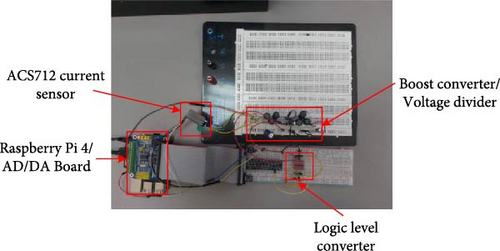
The Raspberry Pi 4 is connected to the boost converter through a logic-level converter [47], as illustrated in Figure 4. This converter adjusts the Raspberry Pi’s pulse width modulation (PWM) voltage levels from 3.3 to 5 V, enabling the control of the metal-oxide-semiconductor field-effect transistor (MOSFET) (IRF1407PbF) in the boost converter to extract peak power from the panel. Since the Raspberry Pi’s GPIO pins are designed for 3.3 V inputs/outputs, the voltage they provide is insufficient to switch the MOSFET transistor. Therefore, the logic level converter is employed to raise the voltage output of the GPIO pins. Figure 5 shows the logic level converter board along with its corresponding electronic circuit. The HV and low voltage (LV) pins supply the HV and LV references for the board. Among the four channels, the voltage can be shifted up or down by-passing signals from LV1 to HV1 or HV2 to LV2. In this setup, the PWM signal is shifted from 3.3 to 5 V to effectively control the MOSFET transistor.
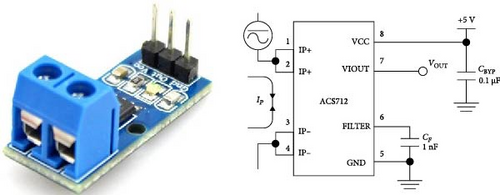
In addition, the current sensor (ACS712) is used to measure the electric current flowing through a circuit. This sensor operates at 5 V and produces an analog voltage output relative to the measured current. Figure 6 presents the current sensor board and its equivalent electronic circuit. However, the used sensor has an output voltage of 2.5 V at the input current 0A, and its output sensitivity is equal to 66 mV/A.
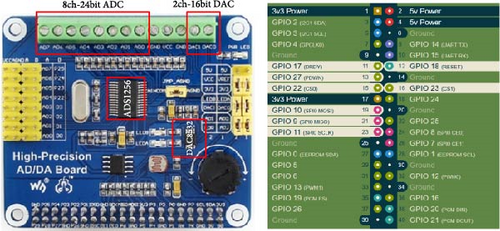
The output from the current sensor is connected to the high-precision analog-to-digital/digital-to-analog (AD/DA) board [48], as the Raspberry Pi lacks an analog-to-digital converter (ADC). To address this, the Raspberry Pi’s GPIOs are extended by adding the high-precision AD/DA board, which is connected to the Raspberry Pi via GPIO pins 9, 10, 11, 17, 18, 22, 23, and 27, as depicted in Figure 7. In this setup, voltage and current measurements from the PV panel are obtained using the ADS1256 analog/digital converter on the high-precision AD/DA board. The ADS1256 offers 24-bit precision, featuring eight high-precision ADC channels and a sampling rate of up to 30k samples per second (SPS). As shown in Figure 5, these eight channels are accessible through GPIO pins AD0 to AD7.
The values of the current and voltage are collected continuously by the BES–MPPT algorithm in the Raspberry Pi to generate an adequate duty cycle to adapt the switching process of the MOSFET transistor for getting the PV panel GP. The MPPT algorithms are developed by the Python software programing language and performed on the Raspberry Pi 4 via its OS.
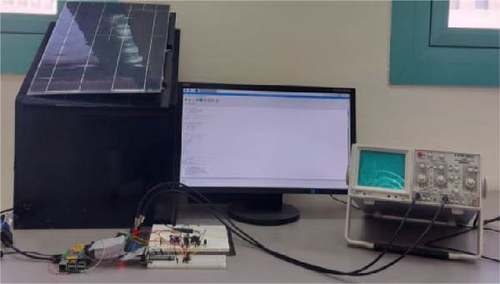
Figure 8 illustrates the experimental setup of the embedded MPPT system. Figure 8a,b shows the general photo of the setup and circuit main components, respectively. For proving the advantages of the proposed MPPT system, different experiments are conducted for four MPPT methods (SOA, GWO, PSO, and BES). However, the Python codes for these methods are performed on the Raspberry Pi 4 for various shaded stages of the PV panel. Then, the obtained results are collected on an secure digital (SD) card via the Raspberry Pi OS. In the next section, these results will be presented and discussed.
5. Results and Discussions
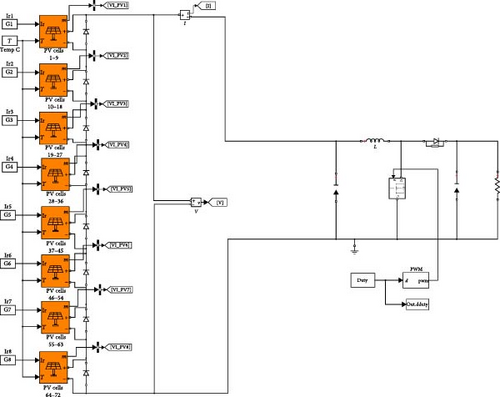
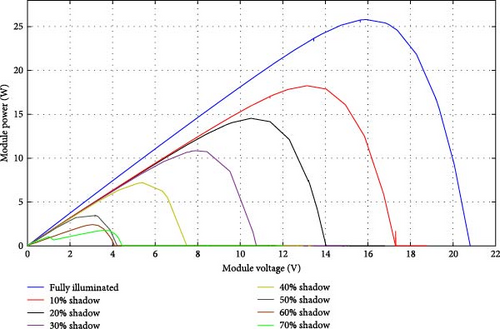
The investigation is conducted in two stages; in the first one, a simulation analysis is implemented with the aid of Simulink/Matlab, while in the second stage, an experimental setup using Raspberry Pi 4 AD/DA board is established. The considered panel has electrical descriptions given in Table 2. The panel model is built in Simulink as shown in Figure 9; it is considered eight rows with nine cells per row, the DC–DC converter connected at the panel terminals has specifications as follows: IRF1407PbF MOSFET, 1N4007 diode, 470 μF input capacitance, 100 μF output capacitance, 66 μH inductor, and 150 Ω load resistance. The P–V curves of the panel at different operating conditions are shown in Figure 10; nine operating conditions are implemented: 0% (fully illuminated), 10%, 20%, 30%, 40%, 50%, 60%, 70%, and 80%, with GPs of 25.8077, 18.2621, 14.5475, 10.8500, 7.1904, 3.5017, 2.4313, 1.7796, and 0.5092 W, respectively. The proposed BES–MPPT is implemented, and the obtained results are compared to SOA, GWO, and PSO [41]. The population size, number of iterations, and sampling frequency are 4100 and 30 kHz, respectively. All algorithms started with an initial population with duty cycles of 0.3, 0.08, 0.7, and 0.5. The results of the studied patterns are tabulated in Table 3.
| Parameter | Value |
|---|---|
| Number of cells | 72 |
| IMP (A) | 1.6 |
| VMP (V) | 18 |
| PMP (W) | 30 |
| Isc (A) | 1.8 |
| Voc (V) | 21 |
- Abbreviation: PV, photovoltaic.
| Case no. | 1 | 2 | 3 | 4 | 5 | 6 | 7 | 8 | 9 | |
|---|---|---|---|---|---|---|---|---|---|---|
| Shade pattern | 0% (fully illuminated) | 10% (8 shaded cells) | 20% (16 shaded cells) | 30% (24 shaded cells) | 40% (32 shaded cells) | 50% (40 shaded cells) | 60% (48 shaded cells) | 70% (56 shaded cells) | 80% (64 shaded cells) | |
| GP_S (W) | 25.8077 | 18.2621 | 14.5475 | 10.8500 | 7.1904 | 3.5017 | 2.4313 | 1.7796 | 0.5092 | |
| SOA–MPPT | Duty cycle | 0.5000 | 0.7000 | 0.7000 | 0.7000 | 0.7000 | 0.7000 | 0.7000 | 0.7000 | 0.7000 |
| GP (W) | 21.7181 | 14.6187 | 13.6867 | 10.8351 | 6.2826 | 3.1748 | 1.9881 | 1.5173 | 0.1378 | |
| IMP (A) | 1.4021 | 1.1136 | 1.2934 | 1.3097 | 0.9885 | 1.2093 | 0.7101 | 0.4872 | 0.2272 | |
| VMP (V) | 15.4893 | 13.1280 | 10.5821 | 8.2730 | 6.3555 | 2.6252 | 2.7997 | 3.1144 | 0.6066 | |
| Conversion efficiency | 12.0656% | 10.3130% | 12.6729% | 13.7589% | 11.6344% | 9.4068% | 7.3633% | 7.4928% | 1.0207% | |
| GWO–MPPT | Duty cycle | 0.5485 | 0.5870 | 0.6099 | 0.7073 | 0.7103 | 0.7078 | 0.7103 | 0.00 | 0.00 |
| GP (W) | 25.7025 | 18.2380 | 14.5288 | 10.8437 | 6.3701 | 3.4173 | 1.9210 | 1.5173 | 0.1378 | |
| IMP (A) | 1.7149 | 1.4767 | 1.3625 | 1.1661 | 1.0023 | 1.2722 | 0.5675 | 0.3835 | 0.1369 | |
| VMP (V) | 14.9881 | 12.3509 | 10.6924 | 9.3081 | 6.3555 | 2.8449 | 3.5610 | 3.9565 | 1.0069 | |
| Conversion efficiency | 14.2792% | 12.8663% | 13.4526% | 13.7698% | 11.7965% | 10.1253% | 7.1148% | 7.4928% | 1.0207% | |
| PSO–MPPT [41] | Duty cycle | 0.5786 | 0.5499 | 0.6114 | 0.7016 | 0.7049 | 0.7152 | 0.7117 | 0.6795 | 0.7785 |
| GP (W) | 25.7459 | 18.2549 | 14.5225 | 10.8475 | 6.3683 | 3.4142 | 1.8941 | 1.5209 | 0.5046 | |
| IMP (A) | 1.6136 | 1.4116 | 1.3781 | 1.3124 | 1.5719 | 2.3820 | 1.2499 | 0.4837 | 0.9370 | |
| VMP (V) | 15.9558 | 12.9534 | 10.5747 | 8.2807 | 4.0512 | 1.5173 | 1.5154 | 3.1444 | 0.5599 | |
| Conversion efficiency | 14.3033% | 12.87824% | 13.4460% | 13.7746% | 11.7931% | 10.1161% | 7.0151% | 7.5106% | 3.7378% | |
| The proposed BES–MPPT | Duty cycle | 0.5700 | 0.5766 | 0.6181 | 0.7069 | 0.7120 | 0.7095 | 0.7000 | 0.6851 | 0.7311 |
| GP (W) | 25.8072 | 18.2600 | 14.5433 | 10.8498 | 6.4222 | 3.4886 | 1.9881 | 1.5214 | 0.5071 | |
| IMP (A) | 1.6305 | 1.3698 | 1.3712 | 1.3407 | 1.0252 | 1.2323 | 0.5580 | 0.4815 | 0.9077 | |
| VMP (V) | 15.8581 | 13.3640 | 10.6274 | 8.1049 | 6.2646 | 2.9364 | 3.5631 | 3.1597 | 0.5807 | |
| Conversion efficiency | 14.3373% | 12.8818% | 13.4660% | 13.7775% | 11.8929% | 10.3366% | 7.3633% | 7.5131% | 3.7562% | |
- Abbreviations: BES, bald eagle search; GP, global peak; GWO, gray wolf optimizer; MPPT, maximum power point tracker; PSO, particle swarm optimization; SOA, skill optimization algorithm.
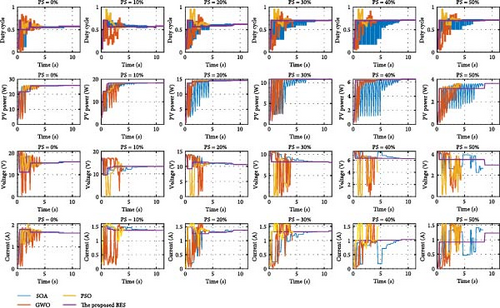
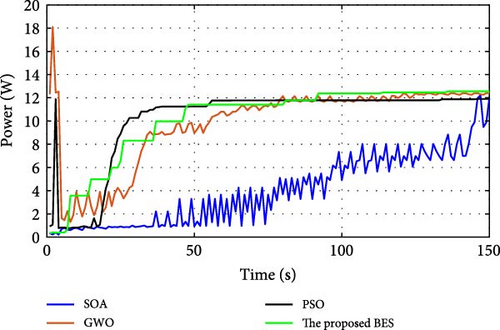
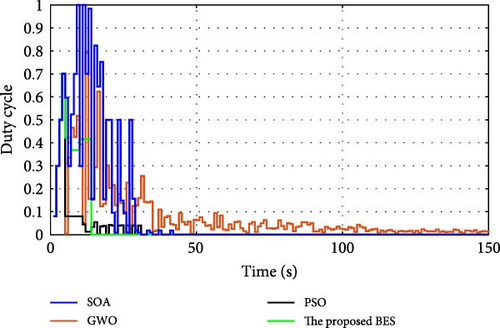
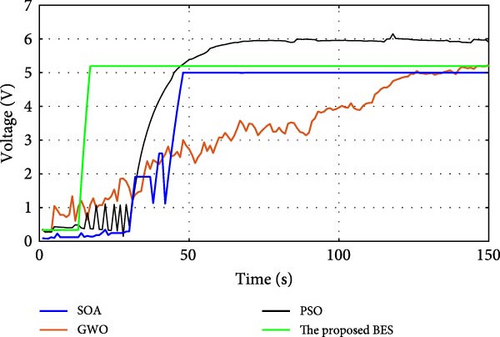
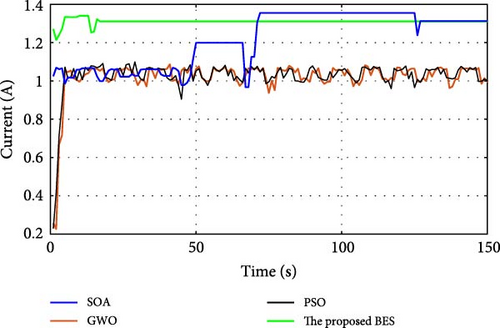
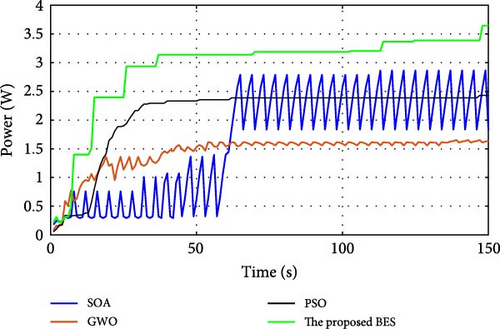
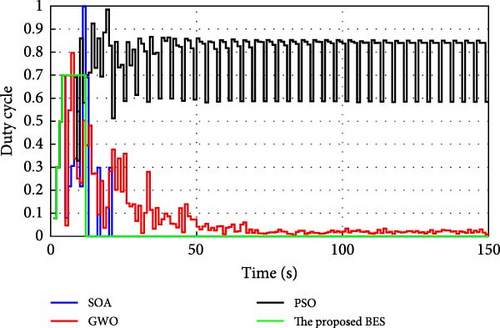
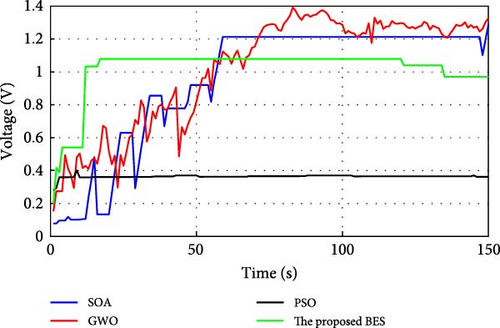
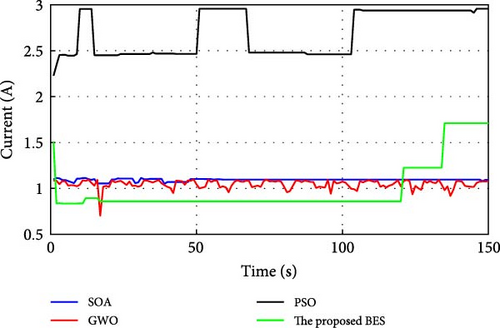
Regarding the fetched results, when the PV panel operated at fully illumination, the Simulink global power (GP_S) is 25.8077 W. In such case, the SOA–MPPT extracted GP of 21.7181 W from the panel at a duty cycle of 0.5, whereas the GWO and PSO [41] generated 25.705 and 25.7459 W, respectively. The proposed BES–MPPT outperformed all, accomplishing the best GP of 25.8072 W at 0.5700 duty cycle. At 30% PS operation, the proposed BES extracted 10.8498 W from the panel, while SOA, GWO, and PSO [41] generated 10.8351, 10.8437, and 10.8475 W, respectively. The proposed tracker outperformed all in such operating conditions. The results proved the dominance of the BES–MPPT in all studied shade patterns. The variations of duty cycle, PV panel power, voltage, and current obtained through the proposed tracker and the others during different shade patterns are shown in Figure 11. The curves clarified that the proposed BES has zero oscillation around the GP with the fastest response compared to the others. The proposed tracker is the best one for all cases represented in the simulation stage. Moreover, the energy conversion energy of the PV panel is calculated via diving the output generated power by the input solar power and tabulated in Table 3. In the case of normal operation, the suggested BES achieved the best conversion efficiency of 14.3373%, while the worst one is 12.0656% obtained through SOA. The recommended tracker achieved the best conversion efficiency in all studied shad patterns.
The second phase implemented in this work is establishing an experimental setup using Raspberry Pi 4 AD/DA board which is programed via the proposed BES and others. Python software is used to program the Raspberry Pi 4 AD/DA board while the irradiance of the installation place is measured using a TENMARS (TM-750) Pyranometer. The laboratory room where the experiment is conducted is in the College of Engineering building at Jouf University in Saudi Arabia under the light of 350 W/m2 and room temperature of 24°C. The tracker is operated online through running the Python code that is fed by the terminal voltage and the output current of the panel while it generates the duty cycle fed to the DC–DC converter MOSFET, then the generated power is recorded and returned to the Python program. The experimental fetched results via the proposed BES–MPPT and the others are tabulated in Table 4.
| Case no. | 1 | 2 | 3 | 4 | 5 | 6 | 7 | 8 | 9 | |
|---|---|---|---|---|---|---|---|---|---|---|
| Shade pattern | 0% (fully illuminated) | 10% (8 shaded cells) | 20% (16 shaded cells) | 30% (24 shaded cells) | 40% (32 shaded cells) | 50% (40 shaded cells) | 60% (48 shaded cells) | 70% (56 shaded cells) | 80% (64 shaded cells) | |
| SOA–MPPT | Duty cycle | 0.00 | 0.00 | 0.00 | 7.59e-05 | 0.00 | 4.51e-05 | 0.00 | 0.00 | 0.00 |
| GP (W) | 25.1498 | 17.46316 | 11.95825 | 10.37235 | 6.19054 | 2.632815 | 1.833394 | 1.403903 | 0.421883 | |
| IMP (A) | 1.4935 | 1.160444 | 1.16523 | 1.175905 | 1.312709 | 0.81431 | 0.823233 | 1.091463 | 0.826368 | |
| VMP (V) | 16.7478 | 15.22104 | 10.48942 | 8.834612 | 5.0000 | 5.000 | 1.48128 | 1.286258 | 1.074728 | |
| Conversion efficiency | 13.972% | 12.319% | 11.072% | 13.1712% | 11.4639% | 7.8009% | 6.7903% | 6.9328% | 3.1250% | |
| GWO–MPPT | Duty cycle | 0.0156 | 0.043904 | 0.0153 | 0.0031 | 0.009553 | 0.00705 | 0.031699 | 0.01034 | 0.023178 |
| GP (W) | 24.9533 | 14.92713 | 12.43667 | 9.351312 | 5.487232 | 2.77754 | 1.634609 | 1.441676 | 0.203978 | |
| IMP (A) | 1.4778 | 1.141443 | 1.171597 | 1.17595 | 0.995583 | 1.00366 | 1.033658 | 1.078235 | 1.016607 | |
| VMP (V) | 16.7898 | 12.55566 | 10.61514 | 7.989924 | 5.228305 | 2.59612 | 1.429369 | 1.327966 | 1.092124 | |
| Conversion efficiency | 13.8629% | 10.5306% | 11.5154% | 11.8746% | 10.1615% | 8.2297% | 6.0541% | 7.1193% | 1.5109% | |
| PSO–MPPT | Duty cycle | 1.5253e−05 | 1.99e−05 | 0.00 | 0.000498 | 4.53834e−05 | 0.00 | 1.00000e−10 | 1.07067 | 0.059443 |
| GP (W) | 25.0101 | 16.62662 | 11.89756 | 8.957472 | 6.55580 | 3.204974 | 2.428955 | 1.441676 | 0.444555 | |
| IMP (A) | 1.4899 | 1.201914 | 1.160471 | 1.771599 | 1.00149 | 1.070865 | 1.074234 | 2.956702 | 1.109107 | |
| VMP (V) | 16.7859 | 14.10365 | 10.25236 | 5.05615 | 5.90799 | 2.992883 | 2.233516 | 0.362116 | 0.679652 | |
| Conversion efficiency | 13.8945% | 11.7295% | 11.0163% | 11.3745% | 12.1403% | 9.4962% | 8.9961% | 7.1193% | 3.293% | |
| The proposed BES–MPPT | Duty cycle | 0.00139 | 0.001109 | 0.000502 | 0.000498 | 0.000253 | 0.00 | 0.000142 | 0.00 | 0.00 |
| GP (W) | 25.3043 | 17.54609 | 12.55947 | 10.92012 | 6.809609 | 3.330237 | 2.443120 | 1.659468 | 0.507692 | |
| IMP (A) | 1.4943 | 1.183419 | 1.133839 | 1.150347 | 1.311189 | 1.730716 | 0.957048 | 1.710261 | 1.706158 | |
| VMP (V) | 16.9343 | 14.82661 | 11.07695 | 9.492891 | 5.193459 | 2.501992 | 3.807895 | 0.970301 | 0.889537 | |
| Conversion efficiency | 14.058% | 12.3782% | 11.6291% | 13.8668% | 12.6103% | 9.8673% | 9.0485% | 8.194% | 3.7606% | |
- Abbreviations: BES, bald eagle search; GP, global peak; GWO, gray wolf optimizer; MPPT, maximum power point tracker; PSO, particle swarm optimization; SOA, skill optimization algorithm.
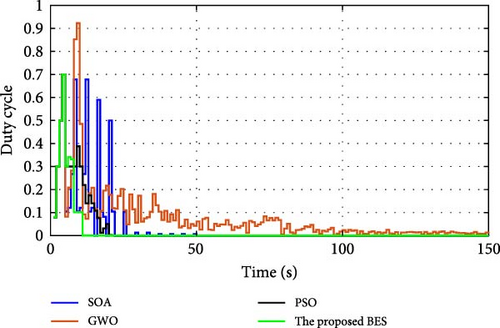
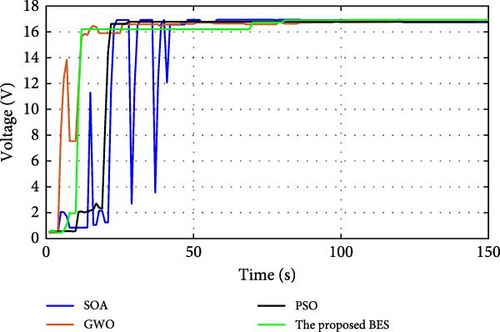
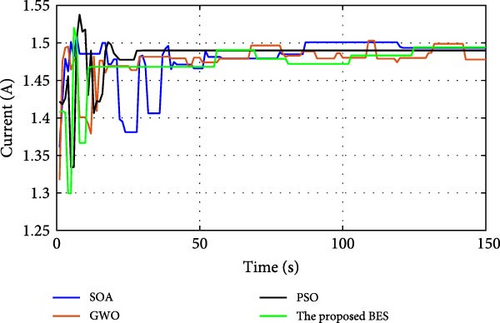
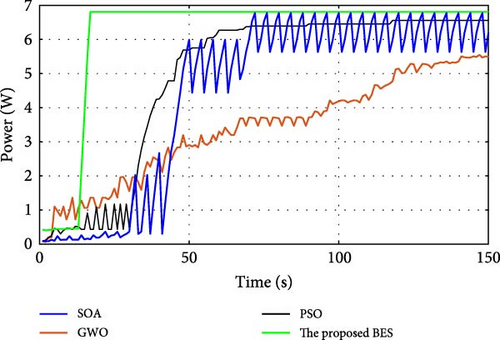
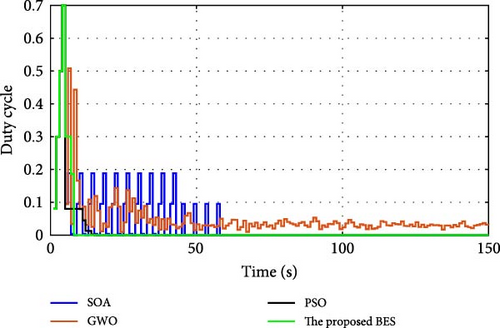
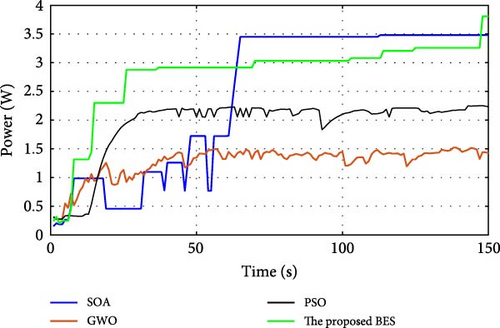
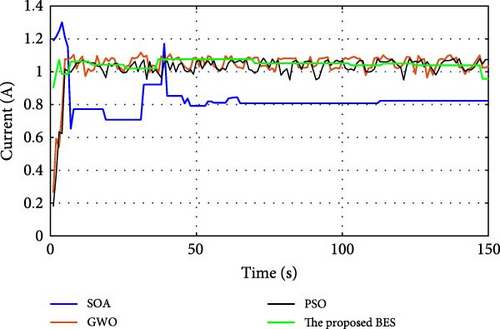
During normal operation in which the PV surface is totally illuminated, the proposed BES–MPPT resulted in generating the best GP from the panel with a value of 25.3043 W while the SOA–MPPT came second, achieving GP of 25.1498 W. The PSO–MPPT [41] get GP of 25.0101 W in the third order, while GWO came last with 24.9533 W. When eight cells are exposed to complete shade, the authors find that the proposed method outperformed all others, achieving GP of 17.54609 W while SOA, GWO, and PSO extracted 17.46316, 14.92713, and 16.62662 W, respectively. When the reader notes the rest of the results in Table 3, it can be concluded that the proposed method is the best among the others in obtaining the largest possible generated power from the solar cell, close to the value obtained from the Simulink model. The variations of converter duty cycle, PV panel power, PV panel voltage, and PV panel current obtained via the proposed BES and others at 0%, 20%, 40%, 60%, and 70% shade patterns are shown in Figures 12–16. The curves clarified that the responses of current, voltage, and power obtained through the proposed BES–MPPT are the fastest, with zero oscillation around the global power. The proposed tracker proved its efficiency in all studied operating conditions, either during simulation or experimental analyses.
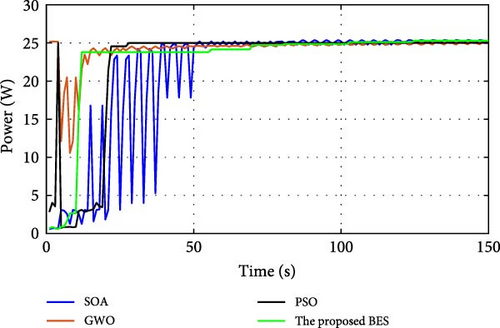
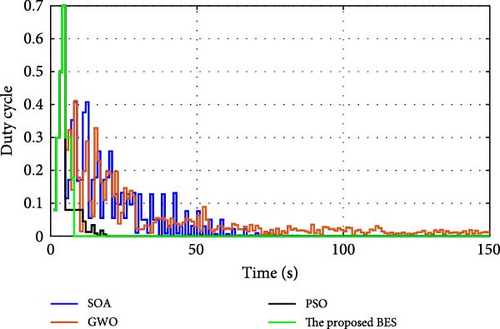
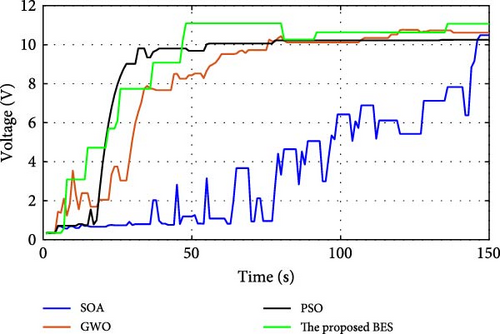
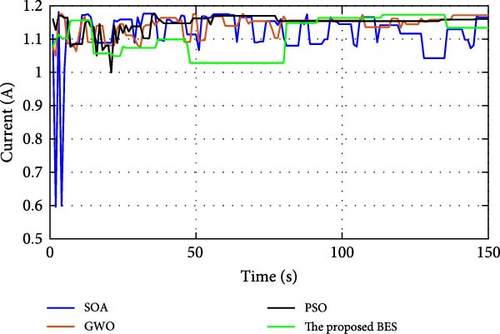
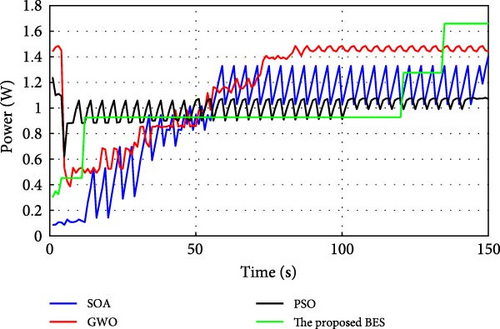
It is essential for evaluating the proposed tracker to compute the power errors and efficiencies of all considered algorithms for both simulation and experimental procedures. The error of GPs obtained through the proposed BES–MPPT and others at all studied shade patterns is tabulated in Table 5.
| Simulation | Experimental | |||||||
|---|---|---|---|---|---|---|---|---|
| Case no. | SOA (%) | GWO (%) | PSO (%) | The proposed BES (%) | SOA (%) | GWO (%) | PSO (%) | The proposed BES (%) |
| 1 | 15.846 | 0.408 | 0.239 | 0.0019 | 2.549 | 3.311 | 3.091 | 1.951 |
| 2 | 19.951 | 0.132 | 0.039 | 0.0115 | 4.375 | 18.26 | 8.956 | 3.921 |
| 3 | 5.917 | 0.129 | 0.172 | 0.0289 | 17.799 | 14.51 | 18.22 | 13.66 |
| 4 | 0.137 | 0.058 | 0.023 | 0.0018 | 4.402 | 13.81 | 17.44 | 0.646 |
| 5 | 12.625 | 11.41 | 11.433 | 10.684 | 13.91 | 23.69 | 8.825 | 5.296 |
| 6 | 9.336 | 2.410 | 2.499 | 0.3741 | 24.81 | 20.68 | 8.474 | 4.897 |
| 7 | 18.229 | 20.99 | 22.095 | 18.229 | 24.59 | 32.77 | 0.096 | 0.486 |
| 8 | 14.739 | 14.74 | 14.536 | 14.509 | 21.11 | 18.99 | 18.99 | 6.751 |
| 9 | 72.938 | 72.94 | 0.903 | 0.4124 | 17.14 | 59.94 | 12.69 | 0.296 |
- Abbreviations: BES, bald eagle search; GPs, global peaks; GWO, gray wolf optimizer; MPPT, maximum power point tracker; PSO, particle swarm optimization; SOA, skill optimization algorithm.
The disparity between the GP derived from the used method and the one acquired using the Simulink model is represented by the power error. Measuring how closely the approach’s captured power converges to the GP is crucial. It is computed with respect to the GP obtained through the Simulink model. Regarding the simulation results, the minimum error is 0.0018% obtained via the proposed BES at the 4th shade pattern confirming the great convergence to the panel GP in that case. Moreover, the BES–MPPT outperformed all in achieving the least errors in all other cases. Regarding the experimental results, the least error is 0.296%, obtained through the BES tracker at the 9th shade pattern. Also, the BES tracker outperformed all others in the remaining shade patterns. The fetched results proved the great performance of the proposed tracker in converging the panel GPs.
The efficiency of the proposed BES and others is calculated via dividing the GP by that obtained through the Simulink model. Table 6 tabulates the algorithms’ efficiencies during simulation and experimental analyses. The best-fetched efficiencies from simulation and experimental setups are 99.99% (during 1st, 2nd, and 4th shade patterns) and 99.92% (during 7th shade pattern), respectively, through the proposed BES. Table 7 presents a tabulation of the elapsed and convergence times of all approaches throughout the implementation of the experimental setup under specific shade patterns. The minimum elapsed time that GWO requires is 633.544 s, whereas the recommended BES requires a huge duration of 1552.002 s because of the three phases that follow. However, the most crucial factor is that the proposed BES has the quickest convergence time of the others. After 103.4668, 465.6006, and 206.9336 s, respectively, under 0%, 20%, and 40% shade patterns, the suggested BES was able to successfully cache the GP. Table 8 shows the statistical parameters, including best (maximum), worst (minimum), mean, standard deviation (Std), and variance of the extracted power obtained via the suggested BES in all studied cases. It is evident that the Std values derived from the experimental setup and simulation exhibit significant convergence.
| Simulation | Experimental | |||||||
|---|---|---|---|---|---|---|---|---|
| Case no. | SOA (%) | GWO (%) | PSO (%) | The proposed BES (%) | SOA (%) | GWO (%) | PSO (%) | The proposed BES (%) |
| 1 | 84.15 | 99.59 | 99.76 | 99.99 | 97.45 | 96.69 | 96.91 | 98.05 |
| 2 | 80.05 | 99.87 | 99.96 | 99.99 | 95.63 | 81.74 | 91.04 | 96.08 |
| 3 | 94.08 | 99.87 | 99.83 | 99.97 | 82.20 | 85.49 | 81.78 | 86.33 |
| 4 | 99.86 | 99.94 | 99.98 | 99.99 | 95.59 | 86.19 | 82.56 | 99.65 |
| 5 | 87.37 | 88.59 | 88.57 | 89.31 | 86.09 | 76.31 | 91.17 | 94.70 |
| 6 | 90.66 | 97.59 | 97.50 | 99.63 | 75.19 | 79.32 | 91.53 | 95.10 |
| 7 | 81.77 | 79.01 | 77.90 | 81.77 | 75.41 | 67.23 | 99.90 | 99.92 |
| 8 | 85.26 | 85.26 | 85.46 | 85.49 | 78.89 | 81.01 | 81.01 | 93.25 |
| 9 | 27.06 | 27.06 | 99.09 | 99.59 | 82.85 | 40.06 | 87.30 | 99.70 |
- Abbreviations: BES, bald eagle search; GWO, gray wolf optimizer; MPPT, maximum power point tracker; PSO, particle swarm optimization; SOA, skill optimization algorithm.
| SOA | GWO | PSO | BES | |
|---|---|---|---|---|
| Elapsed time (s) | 982.955765 | 633.544 | 815.423 | 1552.002 |
| PS = 0% | ||||
| Convergence time (s) | 884.6602 | 591.3077 | 163.0846 | 103.4668 |
| PS = 20% | ||||
| Convergence time (s) | NA | 612.4259 | 706.6999 | 465.6006 |
| PS = 40% | ||||
| Convergence time (s) | NA | 625.0967 | 652.3384 | 206.9336 |
- Abbreviations: BES, bald eagle search; GWO, gray wolf optimizer; PSO, particle swarm optimization; SOA, skill optimization algorithm.
| Simulation/experimental | Best (W) | Worst (W) | Mean (W) | Std | Variance |
|---|---|---|---|---|---|
| 0% (fully illuminated) | |||||
| Simulation | 25.8072 | 0.87763 | 10.63294 | 0.298081 | 1.685014 |
| Experimental | 25.3043 | 0.209557 | 1.808151 | 0.368239 | 0.1356 |
| 10% (8 shaded cells) | |||||
| Simulation | 18.2600 | 2.785265 | 17.76871 | 0.459087 | 4.23984 |
| Experimental | 17.54609 | 0.300886 | 1.322844 | 0.409946 | 0.168056 |
| 20% (16 shaded cells) | |||||
| Simulation | 14.5433 | 0.478953 | 14.09188 | 0.677405 | 2.813689 |
| Experimental | 12.55947 | 0.216298 | 3.264003 | 0.643932 | 0.414648 |
| 30% (24 shaded cells) | |||||
| Simulation | 10.8498 | 0.87763 | 10.63294 | 1.298081 | 1.685014 |
| Experimental | 10.92012 | 0.253891 | 8.781314 | 1.825159 | 7.981524 |
| 40% (32 shaded cells) | |||||
| Simulation | 6.4222 | 0.290246 | 6.204584 | 0.31121 | 0.658062 |
| Experimental | 6.809609 | 0.404656 | 6.4806 | 0.380595 | 1.906042 |
| 50% (40 shaded cells) | |||||
| Simulation | 3.4886 | 0.055579 | 3.21455 | 0.787261 | 0.237423 |
| Experimental | 3.330237 | 0.25400 | 8.781314 | 0.825159 | 7.981524 |
| 60% (48 shaded cells) | |||||
| Simulation | 1.9881 | 0.193482 | 1.946026 | 0.659515 | 0.067348 |
| Experimental | 2.443120 | 0.21600 | 3.264003 | 0.643932 | 0.414648 |
| 70% (56 shaded cells) | |||||
| Simulation | 1.5214 | 0.011577 | 1.48884 | 0.190879 | 0.036435 |
| Experimental | 1.659468 | 0.30100 | 1.322844 | 0.409946 | 0.168056 |
| 80% (64 shaded cells) | |||||
| Simulation | 0.5071 | 1.37E-05 | 0.448864 | 0.147906 | 0.021876 |
| Experimental | 0.507692 | 0.21000 | 1.808151 | 0.368239 | 0.1356 |
- Abbreviation: Std, standard deviation.
In the end, the simulation results validate the experimental findings by demonstrating consistent performance across both approaches. The close alignment in power errors and efficiency between the simulation and experiments confirms the accuracy and reliability of the proposed BES–MPPT algorithm. The simulation predictions under various shading conditions closely match the experimental outcomes, reinforcing the algorithm’s robustness in real-world scenarios. However, in large-scale PV installations, the proposed BES–MPPT method could enhance energy efficiency by accurately tracking the global maximum power point. Its ability to minimize power loss and improve energy yield makes it suitable for large installations where maximizing output is critical. Additionally, the scalability and cost-effectiveness of using Raspberry Pi 4 as the controller make it a practical solution for widespread deployment. Also, by ensuring that the PV system consistently operates at its global maximum power point, the system reduces energy losses, leading to higher overall energy generation. This increase in efficiency translates to less reliance on nonrenewable energy sources, which in turn reduces greenhouse gas emissions and the carbon footprint associated with energy production. Thus, the obtained results encouraged the authors to recommend the proposed BES-MPPT implemented via Raspberry Pi 4 AD/DA board as an efficient tracker for improving the generation of PV panel.
The drawback of BES-based trackers is their lengthy implementation times, which are particularly problematic for large-scale PV systems with several converters; in this situation, the issue is categorized as high-dimensional.
6. Conclusions
- •
The proposed Raspberry Pi 4-BES MPPT achieved the best GP of 25.8072 and 25.3043 W during normal operation of the panel (0% shade pattern) with efficiency of 99.99% and 98.05% and power error of 0.0019% and 1.951% for simulation and experimental analyses, respectively.
- •
Regarding simulation results, the minimum error is 0.0018% obtained via the proposed BES at the 4th shade pattern confirming great convergence to panel GP in that case.
- •
Regarding the experimental results, the least error is 0.296%, obtained through the BES tracker at the 9th shade pattern.
- •
The best-fetched efficiencies in simulation analysis and experimental setup are 99.99% (during 1st, 2nd, and 4th shade patterns) and 99.92% (during the 7th shade pattern), respectively, through the proposed BES.
The robustness of Raspberry Pi 4-BES MPPT is confirmed through the fetched results as it succeeded in extracting the best GPs from panel with zero oscillation around the global power. The future work will handle the application of the proposed tracker with a large-scale PV array operated at real weather conditions recorded in the Aljouf region. Additionally, the next study will address reducing the amount of time needed to build the BES-based tracker and integrating advanced communication protocols for monitoring and controlling large-scale PV systems, as well as improving the algorithm’s real-time adaptability in diverse environmental conditions.
Conflicts of Interest
The authors declare no conflicts of interest.
Funding
This work was funded by the Deanship of Scientific Research at Jouf University under grant no. DSR2023-NF-02.
Open Research
Data Availability Statement
Derived data supporting the findings of this study are available from the corresponding author upon request.


