Numerical Simulation of Entrained Bubbles Flow in the Shell-Tube Heat Exchanger of MSRs Based on Population Balance Model
Abstract
In molten salt reactors (MSRs), a small amount of inert gas could be entrained from the free liquid surface to the primary loop, which may have obvious impacts on the heat transfer performance of the heat exchanger, the reactivity of the core, and the migration of insoluble fission products. It is necessary to understand how the bubbles flow into the reactor core, and what kinds of size distribution should they be. Meanwhile, the heat exchanger is an important and complicated place before the gas enters the core, in which the bubbles may exhibit complex behavior, such as coalescence, breakup, or retention. This research employs a coupling method between the Eulerian two-phase flow model (ETFM) and the population balance model (PBM) to simulate the two-phase flow of bubbles entrained in molten salt on the shell side of a vertical U-tube heat exchanger. The gas fraction and poly-dispersed bubble size distribution are analyzed under different calculation methods and input conditions. The results show that the distribution of gas volume fraction and bubble size are significantly influenced by the characteristics of the flow field, and the salt flow can also be affected by the bubble distribution. The bubbles exhibit obvious non-uniformity distribution, especially in the center of the separation and the backflow vortexes, and a significant accumulation of gas attachment occurs behind the baffles. The interfacial area concentration and surface heat transfer coefficient are also discussed with or without the bubble distribution. All indicate that a precise bubble spatial and size distribution is necessary when in the simulation of multiphase flow in MSRs.
1. Introduction
Molten salt reactors (MSRs) are a type of Generation IV nuclear reactor that operate under high temperature and low-pressure conditions and use molten fluoride salts or chlorine salts to dissolve fission nuclides as fuel. As the only liquid fuel reactor, MSRs have excellent nuclear characteristics and intrinsic safety compared to traditional pressured water reactors (PWRs), and they offer many advantages in terms of safety, economy, environment, and nonproliferation [1]. With the maturity of MSR technology, their development has broad prospects to reduce carbon emissions and accelerate global progress toward achieving carbon neutrality.
The two-phase flow problem of gas entrainment in the moving liquid fluid widely exists in various reactors (such as PWRs, boiling water reactors, and fourth-generation advanced reactors), which has an impact on the heat transfer performance of the reactor, the operating performance of the equipment, and neutron noise. In particular, the entrainment of gas in the liquid coolant of the reactor will affect the safe and stable operation of the reactor. For example, the sodium-cooled fast reactor will entrain a certain amount of gas into the core due to the fluctuation of the pool level under the gas cover and the impact of the sodium flow at the core outlet on the liquid level [2, 3]. The lead-cooled fast reactor may have the possibility of introducing water vapor due to the rupture of the lead-water heat exchanger [4]. The introduction of bubbles in the MSR brings different removal efficiencies, which also have a significant impact on the evolution of the core elements in the MSR loop [5]. Therefore, exploring the two-phase flow law of the reactor and identifying the impact of gas entrainment is currently worth studying.
During the operation of an MSR, there exists a two-phase flow phenomenon referred to as circulating gas void. Unlike in LWR, MSR does not have the gas void generated by coolant phase change. The gas contained in the MSR mainly consists of fission gas and noncondensable gas, of which the inert cover gas accounts for the majority. This is because the molten salt is isolated from the external environment by a cover gas system. However, there is inevitably a gas introduction process that occurs through the free surface during loading and operation, resulting in the entrapment of the inert gas into the molten salt loop. During the early operation of the MSR experiment (MSRE) at Oak Ridge National Laboratory (ORNL), the presence of voids in the loop was discovered through pressure release experiments. Initially, the data indicated that these voids could reach up to 2%–3%. However, as more data were used to estimate the void content during normal operation, it was found that the void fraction in the core could be as low as 0.02%–0.04%. Later, after the recovery of U235 from the fuel salt and the loading of U233, a stable operating void fraction of 0.5%–0.7% could be achieved [6]. In contrast, MSRs differ from traditional solid-fuel reactors, as xenon and krypton are stably encapsulated within the component cladding, and the removal of fission gases generated is imperative through methods such as bubbling and spraying during operation. This not only enhances neutron efficiency but also reduces the demands on the reactivity control system [7], which means this approach also heightens the probability of introducing inert gases into the primary loop. As a result, an inevitable consequence of carrying a small amount (generally, the volume fraction is less than 1%) of inert gas during MSR operation will happen.
Although the entrained gas content in MSR is relatively low (generally, the volume fraction is less than 1%), its impact on reactivity warrants attention. The obvious reactivity disturbance and power surge caused by the entrainment of inert gas, as well as the obvious interference on the measurement of temperature reactivity coefficient and control rod calibration, were observed in the two molten salt experimental reactors ARE [8] and MSRE [9]. For instance, during the power operation of the MSRE at ORNL, intermittent power surges (5%–10%) and significant reactivity disturbances (10−20 pcm) were observed; subsequently, by reducing the pump speed, the circulating void was reduced (from 0.7% to less than 0.1%), and the disturbances completely ceased [10]. Therefore, the safety concerns related to the reactivity disturbances caused by the entrainment of inert gases in the reactor have not been overlooked.
ORNL has conducted extensive research on entrained gas during the design phase and experimental operation phase of the MSRE. Among them, in the study of the influencing factors on the introduction of gas content [10–12], ORNL conducted corresponding experimental analyses on system temperature, gas chamber pressure, and liquid level. The study concluded that the low liquid level of the pump is the main reason for the introduction of a large amount of gas, and measured the gas content at different liquid levels. In the case of low pump liquid level, the disturbance of gas chamber pressure has a significant impact on the introduction of gas. The change in operating temperature within the reactor also affects the liquid level of the pump and, thus, the gas content. The pump will cause changes in liquid level and gas pressure during startup and shutdown, which will also cause changes in gas content in the molten salt. In addition, material properties have a significant impact on the transport of entrained gas. These studies have identified the main influencing factors for the introduction of entrained gas, but they have not addressed the transport laws of bubbles in the pump and molten salt main circuit, such as bubble flow field and size distribution. Regarding the disturbance relationship between entrained gas and reactivity, there are also many two-phase flow issues involved. Early ORNL did not provide a reasonable explanation for the mechanism of reactivity disturbance caused by entrained gas. Since the gas content under different pump operating conditions is measured using a densitometer in zero power or pump hydraulic devices during actual power operation, due to various factors within the reactor, it is not possible to measure the gas content and flow laws under reactivity disturbance. In addition, although a simplified loop system model using the perturbation parameter method has been established [13], the calculated results do not match well with experiments, and the two-phase flow laws and their disturbance on the core need further research. In order to more effectively remove xenon during the design of MSBR, ORNL has developed an independent bubble generator and bubble separator and studied the size and separation efficiency of bubbles generated by different structural devices [14–17]. A simplified gas–liquid mass transfer model has also been established. However, there is relatively little research on two-phase flow experiments, measurements, and simulations of reactor components.
In recent years, Tian, Yan, and Sun [18] utilized sensor optical probes to measure the air-water bubble flow system in large pipelines, representing the maturity of flow visualization for gas–liquid two-phase flows. For the helium bubbling method used in molten salt fast reactors to remove insoluble fission products, Choi et al. [19] analyzed the changes in key thermal and hydraulic parameters through two-phase flow experiments under helium flow control and evaluated the two-phase flow behavior through numerical simulation. Yin et al. [20–22] conducted experiments related to the gas–liquid two-phase problem in MSRs with bubble generators and bubble separators. They used high-speed cameras to capture the size, distribution, and dynamic behavior of bubbles in the circuit and utilized artificial intelligence recognition imaging technology to effectively observe the behavior of bubble clusters. Furthermore, through numerical simulation and other methods, they obtained the separation trajectory and gas core formation factors under different bubble diameters and Reynolds numbers in the serpentine tube, bubble generator, and bubble separator. However, in these experiments related to gas–liquid flow in MSRs, water is still the main phase rather than molten salt, and the observed flow structure is relatively simple. In the ORNL experiment, the gas content under different pump operating conditions was measured using a densitometer in zero power or pump hydraulic devices, while during actual power operation, due to various factors in the reactor, it is difficult to directly measure the gas content and flow rules under reactivity disturbances. In summary, there is still a relative lack of research on two-phase flow in complex components within the MSR circuit, making it difficult to directly observe or accurately measure the transport and distribution of bubbles through experiments. Therefore, establishing accurate gas volume fraction and bubble size distribution prediction models through numerical methods is one of the necessary means to compensate for experimental deficiencies.
In the current study of the influence of inert gases on reactivity, it has been noticed that the introduction of gases directly alters the volume fraction distribution of the fuel salt within the reactor core, thereby causing changes in reactivity and temperature coefficients [23]. Additionally, the interfacial concentration distribution of the two-phase directly affects the migration efficiency of fission gases such as xenon, thereby indirectly affecting the change in reactivity. In the modeling of ORNL-4069, it is shown that the behavior of xenon is indeed greatly affected by circulating void fraction [24]. Furthermore, the interfacial area concentration of bubbles is not only related to the gas volume fraction but also to bubble size distribution. In the current research, with the development of two-phase flow theory and computational methods, the void fraction has been successfully coupled to the solution of multiphysical numerical simulation. However, the effect of bubble distribution is still ignored; most studies use a single bubble diameter assumption instead of the bubble size distribution [23, 25, 26] or simply consider bubble size as pressure-dependent [27, 28], which means the effect of bubble coalescence and breakage on the size distribution was not further considered. Frederix and Komen [29] studied the removal efficiency of noble metal particles by helium bubbles in MSFR using the computational fluid dynamics (CFD) method and considering bubble expansion, turbulent bubble coalescence, and turbulence, but it is the simplified MSFR for geometry. To sum up, it is necessary to adopt a more accurate multiphase flow model model for specific MSR loop components.
With the development of CFD technology, the Eulerian two-phase flow model (ETFM) has become the main feasible solution for large-scale structures such as heat exchangers and has been applied in the fields of chemical engineering and nuclear energy [30, 31]. Although ETFM does not have more accurate tracking of two-phase interfaces than the volume of fluid (VOF) method within the Euler–Euler method, it is more suitable for flows involving bubbles, droplets, and particles. In addition, ETFM lacks information on the interface between multiple phases and the exchange of momentum and turbulence, which requires other models to supplement. The population balance model (PBM) can describe the stochastic evolution of particles [32, 33], treating bubbles as particles, including processes such as bubble nucleation, growth, diffusion, dissolution, aggregation, and breakup, which can compensate for the lack of information on the evolution of subphase interfaces in ETFM, thus meeting the general requirements of closed models [34]. In recent years, there has been an increasing number of studies using ETFM coupled with PBM to investigate the gas distribution law in dispersed bubble flows, and applications have gradually progressed from simple cylindrical structures to complex and practical industrial geometries. Li et al. [35] summarized recent cases of CFD–PBM coupling models for cylindrical tube structures, pointing out that in cylindrical geometries, the interphase forces considered beyond the basic drag force are less common. Wang, Wang, and Jin [36] first proposed a CFD–PBM coupling model for multiple interphase forces and verified it in cylindrical tubes. Huang et al. [21] used CFD–PBM coupling multiple interphase forces in serpentine tubes to simulate the distribution of bubbles and verified it through experiments. For complex geometric structures, Ge et al. [37] applied the ETFM–PBM coupling model to numerical simulations of centrifugal pumps, and the results were in good agreement with the experiments. Liao established a benchmark model by integrating multiple bubble coalescence and breakup mechanisms and applied the model to various geometric structures, conducting extensive experimental validation to verify its effectiveness [38–40]. Therefore, applying the ETFM–PBM method to the numerical simulation of two-phase flow in molten salt circuit components can compensate for the lack of effective experimental measurement methods to some extent and explore the distribution characteristics and flow laws of bubbles entrained in molten salt through numerical means.
The molten salt heat exchanger is an important place for the transport of gas entrained by molten salt. Gas is typically introduced by the primary salt pump bowl, passing through the heat exchanger before entering the reactor core. Whether the introduced gas is retained within the heat exchanger has a significant impact on its heat transfer performance, as well as the distribution of gas bubbles at the heat exchanger outlet, which in turn affects the distribution of void fraction and two-phase interface concentration within the reactor core. Figure 1 depicts the geometric schematic of the shell side of a typical U-shaped tube and shell heat exchanger. If the fuel salt goes through the shell side, there are complex flow fields, such as the flow around the tube bundle and baffles, which means that the behavior of the bubble is very complex, and the difficulty of two-phase flow field calculations is greatly increased. In addition, the impact of gas introduction in MSR is worth exploring. In the thermal-hydraulic design of the reactor, the most important goal is to ensure that during normal operation of the reactor, it provides heat transfer and heat removal capabilities that match the heat generation capacity of the reactor core, that is, through the flow of fuel salt, the fission energy generated in the fuel salt is effectively transferred to the cooling circuit, and finally transferred to the atmospheric heat sink through the air cooling system. The traditional MSR reactor thermal-hydraulic design often ignores the impact of inert gas introduction; for heat exchangers, the degree of influence of gas introduction on heat transfer is worth exploring.
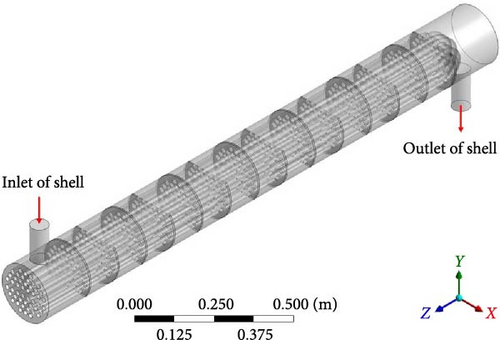
The objective of this paper is to employ the ETFM–PBM coupling method for simulating dispersed bubble flow in a vertical U-shaped shell and tube heat exchanger. The purpose of this study is to summarize the flow field, gas volume fraction, and bubble size distribution in the heat exchanger and the interaction between them, including the influence of gas on the flow field and the influence of flow field structure on the gas volume fraction and bubble size distribution. Furthermore, the paper includes a brief analysis of the distribution of interfacial area concentration and initiates a preliminary discussion on the impact of inert gas on the heat transfer performance of the heat exchanger, thereby establishing a foundation for studying fission product migration and the influence of inert gas introduction on heat transfer in an MSR. The article is structured as follows: Section 2 introduces the ETFM–PBM coupling method and its main mathematical formulas. Section 3 covers the geometric model, solution setting, and mesh generation. Sections 4 and 5, respectively, present the analysis results and conclusions, including (1) analyzing the flow characteristics within the fluid domain and exploring the impact of introduced gas on the main phase; (2) analyzing the pattern of the gas volume fraction distribution and gas retention, and comparing cases under different boundary conditions or without PBM models, to explore the influencing factors; (3) analyzing the pattern of bubble size distribution, and comparing cases under different boundary conditions to explore the influencing factors; (4) exploring the pattern of interface concentration distribution under different boundary conditions; and (5) using a single-phase flow molten salt heat transfer case as a reference, to explore the impact of molten salt entraining a small amount of inert gas on heat transfer and the correlation between its impact and the distribution of inert gas.
2. Methods
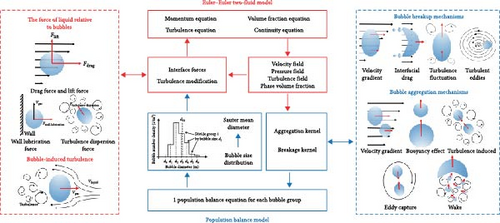
The ETFM is used to describe the two-phase flow, while the PBM is used to supplement the interface information of poly-dispersed bubble flow that ETFM lacks. The ETFM–PBM coupling mechanism is described in Figure 2 [38]. ETFM describes the two-phase flow by solving the continuity, momentum equation, and turbulence equation of each phase to obtain the pressure, velocity, turbulence, and volume fraction distribution in the computational domain, while in the PBM method, the number density function Ni (the number of bubbles per unit volume of group i with bubble size di) is obtained by solving the population balance transport equations (PBEs) discrete by bubble size. For the ETFM method, to describe the interaction between liquid and bubble (momentum exchange and bubble-induced turbulence (BIT) are mainly considered in this paper), the momentum equation needs to couple the interphase interaction force as source term, and the turbulence equation needs to be modified, so that the equations can be closed. The calculation of the interaction forces and turbulence correction needs bubble distribution information of the secondary phase, and the information is generally in the form of the ratio of total volume to the total area of bubbles, which is called Sauter mean diameter, . The Sauter mean diameter is probably the most commonly used mean as it characterizes a number of important processes, commonly used to describe the characteristics of bubbles in dispersed bubble flows. The bubble distribution information will also change due to the interaction between bubbles (the concentration of molten salt remains basically unchanged, and there is no mass transfer process, so the diffusion of bubbles and mass transfer source terms are not considered. Therefore, this article mainly considers expansion, coalescence, and breakage activities), which are described by the source term of PBM and require various quantities obtained from the Euler model. Therefore, ETFM and PBM are coupled with each other, which means that the ETFM–PBM equations are closed and solvable. ETFM–PBM can simulate the dispersed bubble flow in molten salt heat exchangers well, but the flow situation in molten salt heat exchangers is complex, and there may be nonbubble gas accumulation areas, which poses a challenge to the applicability of ETFM–PBM simulation.
2.1. Conservation Equations
2.2. Turbulence Model
At present, the two-equation turbulence model based on Reynolds averaged N-S equations (RANS) and eddy viscosity assumption is still the mainstream turbulence calculation method in the industry, which mainly includes k-ε and k-ω model. The BSL k-ω model was developed by Menter [42] based on Wilcox’s standard k-ω model [43], which effectively combines the stability and accurate solution of the k-ω model in the near wall domain, as well as the insensitivity of the k-ε model in free flow away from the wall. The SST k-ω model is an improvement based on the BSL k-ω model, as the BSL k-ω model does not consider the transmission of turbulent shear stress, resulting in overprediction of turbulent shear stress in the reverse pressure gradient and difficulty in accurately calculating the starting point of flow separation from smooth surfaces. The SST k-ω model restricts turbulent stress by limiting turbulent viscosity, which has a better predictive effect on reverse pressure gradient flow. Therefore, the SST k-ω turbulence model, further modified based on the BSL k-ω model that mixes k-ε and k-ω is suitable for high shear flow environments with complex geometries, such as fluid flow simulation in heat exchanger structures. This turbulence model helps to improve the accuracy of two-phase flow turbulence calculations.
2.3. Interphase Momentum Exchange
In this paper, only the gas–liquid two phases are considered, and the force exerting on the liquid phase is . The right-hand side of Equation (13) is, respectively, the drag force, lift force, wall lubrication force, turbulent dispersion force, and virtual mass force exerted on the bubble by the liquid phase.
2.4. Population Balance Equation
Since changing pressure impacts the density and size of bubbles significantly in the heat exchangers, the expansion term ∇k · (GVNk) in Equation (22) should be considered, and its specific form can be referred to Millies and Mewes [52].
3. Simulation Setup
The platform of this numerical simulation was ANSYS FLUENT [53].
3.1. Physical Properties
Because the MSR heat exchanger operates at high temperature and low pressure, the relatively small temperature difference and pressure difference in the heat exchanger have little effect on the physical properties except gas density. According to the ideal state equation of gas, the proportion of inlet and outlet temperature difference not exceeding 50°C to the outlet temperature of 600°C is smaller than the proportion of inlet and outlet pressure difference, accounting for about 20% of the outlet pressure. Considering the reduction of calculation difficulty, according to the ideal state equation of isothermal (600°C) gas, the gas density is only related to the pressure. Accordingly, the physical properties parameters at 600°C are used as calculation inputs. The physical properties of the two-phase system at 600°C and 1 atmospheric pressure are shown in Table 1. It is assumed that both the primary and secondary phases are Newtonian fluids. The fuel-molten salt is assumed to be an incompressible fluid with constant density and viscosity. The secondary phase is argon of which density changes to conform to the ideal gas assumption when considering the expansion effect of the gas. The carrier salt is BeF2-LiF in the primary loop, which has a larger surface tension generally. Janz et al. [54] reported that the surface tension of BeF2-LiF molten salt was measured to be 0.196 N/m in experiments at specific molar ratios and temperatures. In this simulation, due to the small temperature variation and approximate molar ratio in the working conditions studied in this article, the surface tension between the molten salt and argon gas is assumed to be fixed at 0.2 N/m.
| Physical properties | Primary phase | Secondary phase |
|---|---|---|
| Material | Molten salt | Argon |
| Density (kg·m3) | 2300 | 0.55 |
| Viscosity (Pa·s) | 6.75 × 10⁻³ | 5.08 × 10⁻⁵ |
| Thermal conductivity (W/m·K) | 1.4 | 0.0398 |
| Specific heat capacity (J/kg·K) | 2000 | 520.64 |
3.2. Geometric Model and Meshing
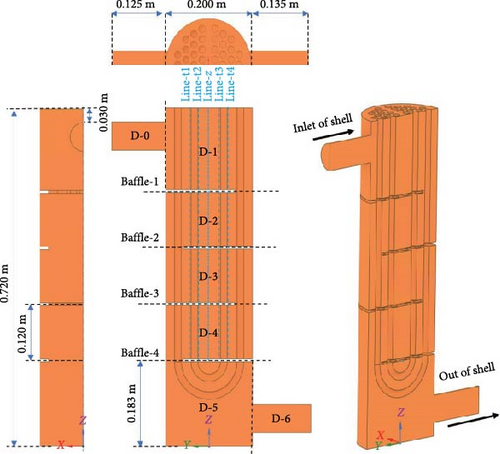
The flow boundary of a typical U-shaped tube and shell heat exchanger is primarily composed of the inner wall of the shell, the outer wall of the U-shaped heat exchange tube, and the baffle wall surface. The heat exchanger is vertically positioned, with the shell side inlet at the top and the shell side outlet at the bottom, the tube side inlet and outlet at the top. The primary loop fuel salt passes through the shell side, while the coolant salt passes through the tube side. Since the whole heat exchanger is too large and complicated to hardly simulate, a simplified geometric model is employed. The basic structure of the fluid domain on the shell side of the heat exchanger is preserved, including (1) simplifying it to be four baffle plates, (2) neglecting the gaps between the heat exchange tubes and the baffle plates, as well as between the baffle plates and the shell-side cylinder, and (3) since the heat exchanger has a symmetrical structure, only half of it is simulated. The final geometric model is shown in Figure 3a. The gravity direction of the simplified four baffles heat exchanger is the negative direction of the Z-axis. To facilitate the statistics of local data, the baffles passing through the heat exchanger from the inlet to the outlet are numbered 1–4, and the heat exchanger is divided into seven local domains from D-0 to D-6. The statistical lines are selected on the symmetrical plane, which is shown in Figure 3a for the specific position.
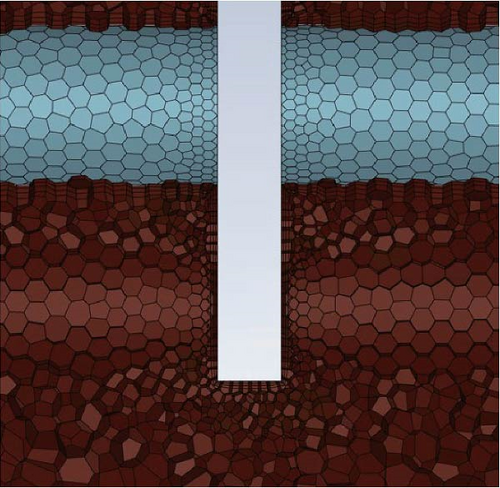
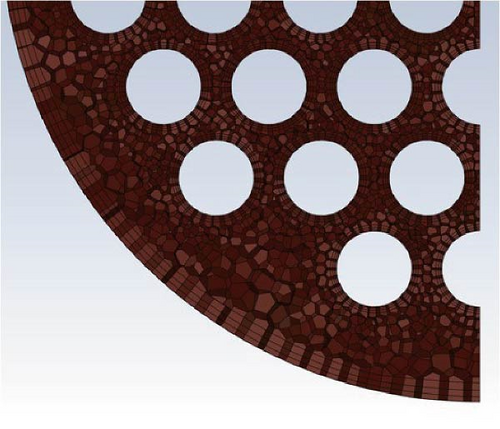
Fluent meshing [53] is used for the generation of a polyhedron grid, and the boundary layer adopts a smooth transition scheme. The transition ratio is 0.272, the growth rate is 1.2, and the number of layers is three. The mesh near the heat exchange tubes and baffles was refined to improve the resolution of the model and enhance the accuracy of the simulation results, which is shown in Figure 3b,c by an example of 1.74 million grid.
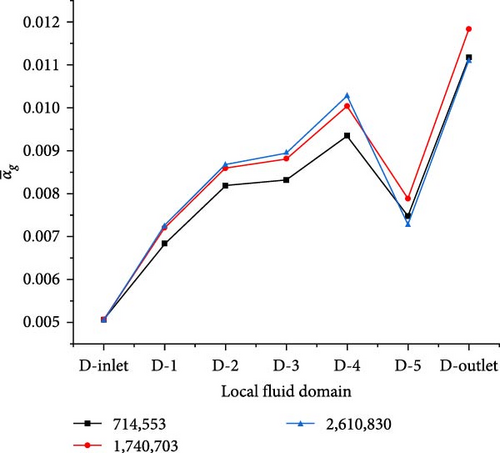
To ensure computational accuracy and save computational costs, a steady-state solution was adopted, with a fixed bubble size of 0.5 mm, for the verification of mesh independence using ETFM. The simplified heat exchanger has three sets of mesh divisions, which are 714,553, 1,740,703, and 2,610,830, respectively. The average gas volume fraction in each local fluid domain of different grids is shown in Figure 4. It can be observed that as the number of grids increases, the maximum deviation does not exceed 2.5% in the average gas fraction in the second and third groups of grids in the D-0 to D-4 regions. In the D-5 and D-6 regions near the outlet, the maximum deviation does not exceed 8.5%. The second group of 1,740,703 cells was selected for subsequent two-phase flow calculations, considering the accuracy and speed of the solution.
3.3. Solution Settings
To explore the possibility that bubbles in the heat exchanger further coalesce into larger or break into smaller bubbles, the representative size between the lower and upper limit of the bubble groups was set to 0.01 and 10 mm, respectively, with the ratio exponent of 2.
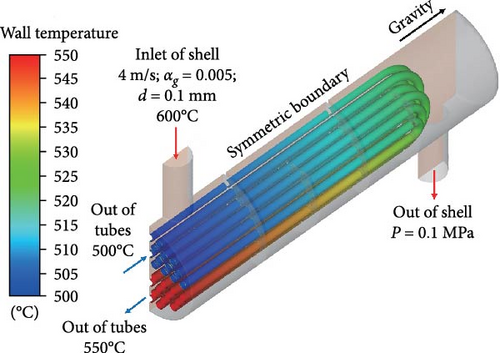
The shell, tube bundle, and baffles of the heat exchanger are subject to impermeable and no-slip boundary conditions. The symmetric boundary condition is imposed on the heat exchanger’s symmetry plane. In the standard calculation case, Case 2-1, the inlet boundary is set to the velocity inlet of 4 m/s and the gas volume fraction of 0.5%. It is suitable that the bubble size is set as 0.1 mm for this simulation at the inlet because the reasonable range of bubble diameter in the MSR loop is 0.1 mm < d < 2 mm [22], and additionally, bubbles are further broken by shear to be smaller size passing through the centrifugal pump before flowing into the heat exchanger. The solver employs three-dimensional, double-precision, pressure-based, additionally, detailed solution settings are provided in Table 2. Because the operating temperature of the heat exchanger is 600°C and the temperature difference is not more than 50°C, the change in physical properties is very small. Therefore, the application of the energy equation in this study of the characteristics of two-phase flow for bubbly flow is not considered, and only in the sections analyzing the impact of gas on heat transfer is used. To compare whether bubbles have a large reverse effect on the flow field, we simulated a single-phase flow field for comparison, see Case 1-1. In addition, to study the interaction between heat transfer and bubble distribution, the energy transfer is considered in Case 1-2 and Case 2-2 with the temperature boundary for the tube wall while the adiabatic boundary for other walls, as shown in Figure 5.
| Project | Reference case of single-phase flow | Standard case of two-phase flow | ||
|---|---|---|---|---|
Case 1–1 (no-energy) |
Case 1–2 (energy) |
Case 2–1 (no-energy) |
Case 2–2 (energy) |
|
| Fluid of primary phase | Molten salt | |||
| Fluid of secondary phase | — | Argon (Isothermal ideal gas) | ||
| Pressure outlet | 101.325 kPa | |||
| Turbulence model | SST k-ω model | |||
| Two-phase flow model | — | ETFM–PBM | ||
| Pressure–velocity coupling | Coupled | |||
| Gradient spatial discretization | Least squares cell | |||
| Pressure spatial discretization | PRESTO! | |||
| Energy spatial discretization | — | Second-order upwind | — | Second-order upwind |
| Density spatial discretization | — | Second-order upwind | ||
| Momentum spatial discretization | First-order upwind | |||
| Volume fraction spatial discretization | — | First-order upwind | ||
| Turbulent kinetic energy spatial discretization | Second-order upwind | |||
| Turbulent dissipation rate spatial discretization | Second-order upwind | |||
| Gas bin spatial discretization | — | Second-order upwind | ||
- Abbreviations: ETFM, Eulerian two-phase model; PBM, population balance model.
Although the steady-state calculation can not accurately simulate the transient process of flow. Given that this study focuses only on the physical outcomes at the long-term time scale that reach a steady state but the transient processes. Therefore, it is reasonable to choose the steady-state algorithm. The convergence criterion is the mass flow rate difference between the inlet and outlet of gas phases is less than 5% or no more than 10% with boundary conditions different from cases in Table 2.
3.4. Sensitivity Analysis of the Influence of Thermal Boundary Conditions on Gas Phase Distribution Patterns
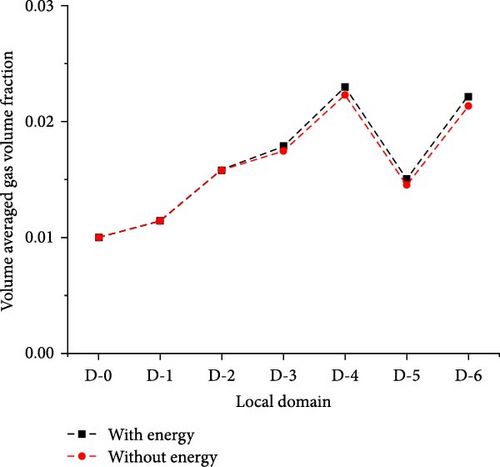
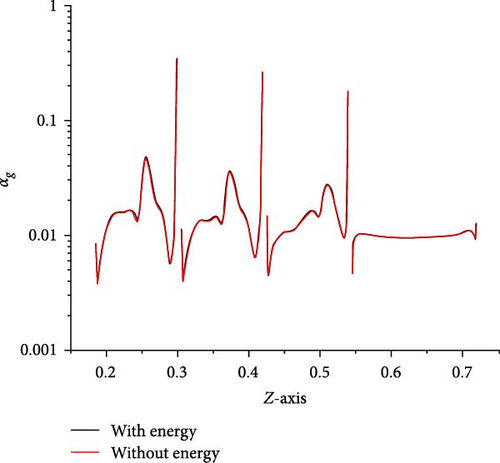
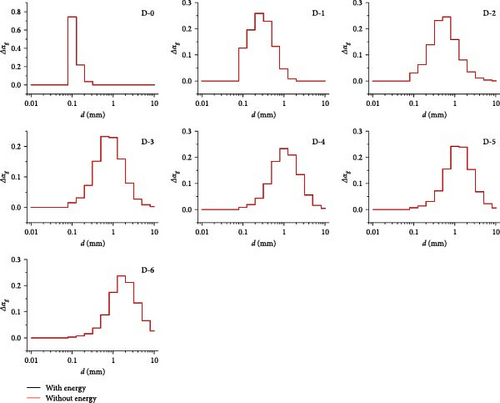
In the exploration of the characteristics of two-phase flow in heat exchangers, the energy equation was neglected to save computational costs (however, the impact of gas introduction on heat transfer research does not exclude the energy equation and heat transfer between the two phases). Therefore, by simulating the gas volume fraction distribution and bubble size distribution under two cases, an analysis of the impact of setting heat transfer boundary conditions on the gas phase was conducted. To further highlight the influence of gas, the inlet gas volume fraction of Case 2-2 was set to 0.01.
In Figure 6a, except that the average gas volume fraction in D-4 to D-6 is different (the maximum deviation is not more than 4%), the rest is almost the same. The local gas volume fraction along line-z0 shown in Figure 6b basically coincides. Therefore, the introduction of heat transfer boundary conditions will not significantly change the gas volume fraction in the mainstream region. In Figure 7, the bubble size distribution in each local region is consistent with that in the absence of an energy equation. Therefore, the introduction of heat transfer boundary conditions will not significantly change the bubble size distribution in the main region. To sum up, the influence of temperature boundary on bubble flow distribution in MSR heat exchangers is very limited, which does not affect the research goal of bubble flow distribution characteristics.
4. Results and Discussion
4.1. Analysis of Flow Fields
Analyzing the flow characteristics and relative velocity will help to explore the bubble flow pattern in the subsequent chapters. In addition, the gas introduced can also have an impact on the flow of the primary phase, which is also worth discussing.
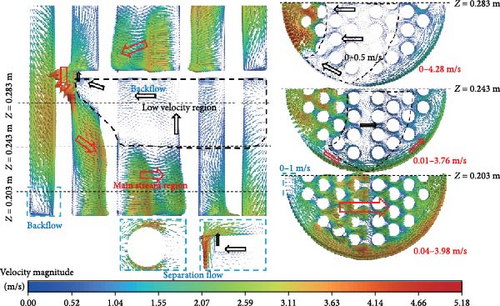
Figure 8 shows the velocity vector distribution of symmetric cross-sections and cross-sections at different heights in D-4. The mainstream region with the red arrow reaches a velocity magnitude of 4 m/s in the cross-section at z = 0.203 m. It can be observed that the flow in this region is predominantly to the right, but there is a low-velocity (0–1 m/s) area on the far left in a very small range, which corresponds to the backflow region at the lower left corner of the symmetrical cross-section. The low-velocity region includes a large backflow vortex with the black arrow indicating the reverse pressure gradient. In the cross-section at z = 0.283 m, except for the high-speed area where the primary phase flows around the baffle on the left side, the velocities on the other right sides are relatively lower, especially in the middle part, which is only 0–0.5 m/s, corresponding to the backflow region of the symmetrical cross-section. There exists a separate flow at the right-angled corner around the baffle and on the backflow surface of the cylinder. The separation region near the wall surface has a reverse pressure gradient with an obvious backflow vortex and a lower velocity compared to the main flow. The separation point around the baffle is located at the right-angled corner, while the separation point of the cylinder is influenced by the velocity and direction of the incoming flow, and the separation points of each tube are different in the bundle.
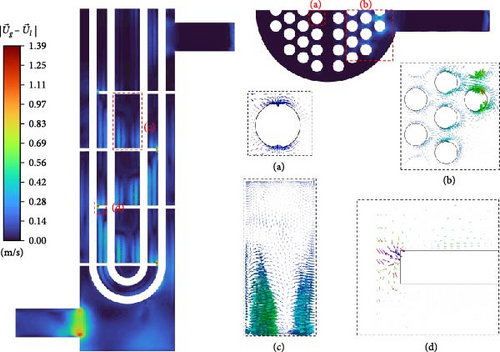
Stokes number of the bubble flow in this paper is much less than 1, so bubbles closely follow the flow field movement of the primary phase when there are no obstacles. When encountering obstacles, the primary and secondary phases begin to show velocity differences, such as the relative velocity around the tube bundle also varies significantly in Figure 9a,b. There is a gradually increasing relative velocity from the main flow area to the low-velocity flow area for the regions between adjacent baffles due to the bubble buoyancy effect, as shown in Figure 9c. Figure 9d shows that for separated flows, under the influence of lateral lift, the direction of relative velocity is perpendicular to the velocity of the primary phase until it becomes parallel and in the same direction as the primary phase near the wall surface, which indicates that bubbles tend to move toward the inner part of the separated vortex.
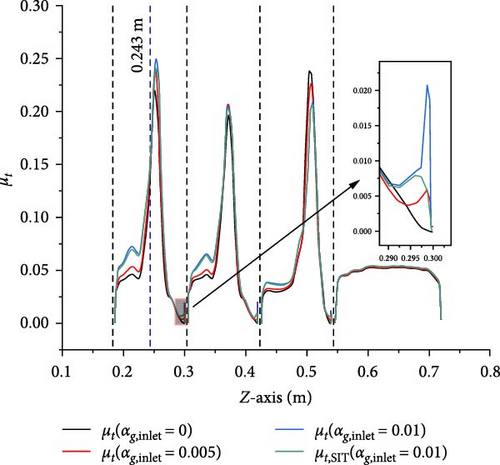
A comparison is made between Case 2-1 with inlet gas volume fractions of 0.005 and 0.01 and Case 1-1 without gas introduction, examining the velocity magnitude and turbulent viscosity to study the influence of gas introduction on the primary flow. Figures 10–12 present data along the line-z (x = 0 m, y = 0 m, 0.186 m < z < 0.720 m), respectively. The velocity and turbulent viscosity for each case in the D-1 (0.546 m < z < 0.720 m) are very similar, and the gas volume fraction distribution, velocity magnitude, and turbulent viscosity between baffles exhibit similar patterns. The following discussions will primarily focus on the third and fourth baffles (0.186 m < z < 0.300 m) as a representative example.
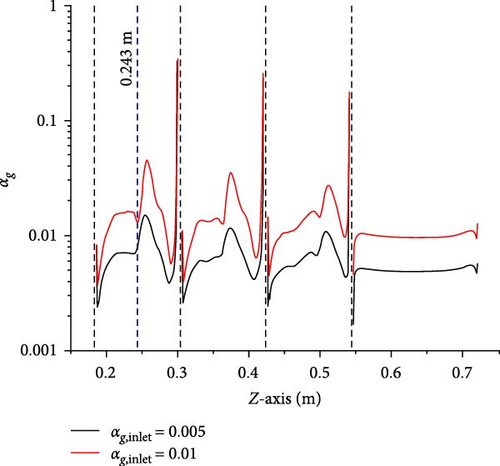
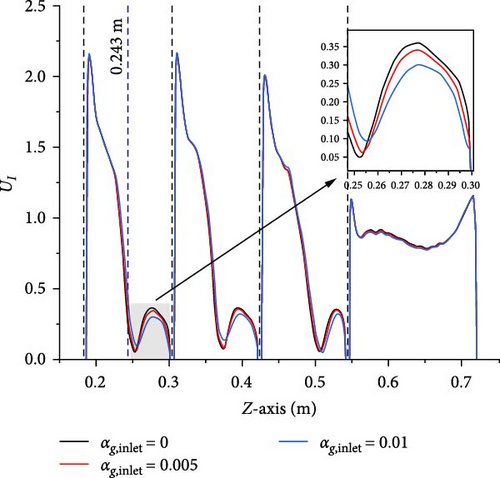
To explore the influence of gas on the primary phase velocity, compare Figures 10 and 11 together. The comparison reveals that along the line (0.186 m < z < 0.243 m), the maximum velocity magnitude can reach 2.3 m/s, and the velocity magnitudes for each case largely overlap, with distinct differences only becoming apparent when the velocity magnitudes sharply decrease near the midpoint, z = 0.243 m. Along the line (0.243 m < z < 0.300 m), the maximum velocity magnitude does not exceed 0.35 m/s, and it is evident that as the introduction of gas increases, the velocity’s minimum value increases and its maximum value decreases, but the effects is very limited. Therefore, the gas introduction only has a small effect in the low-velocity region of the primary phase.
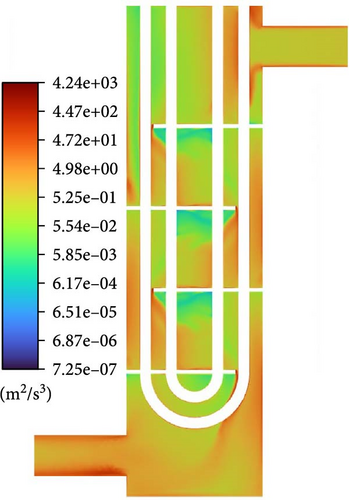
As an important physical variable, the change of turbulent viscosity caused by the introduction of gas is also worth discussing. Figure 12 shows that there are maximum values of turbulence viscosity in the middle of two baffles, and it might be because the middle regions is the interface between the mainstream region and the low velocity, as illustrated in Figure 8, which this interface position belongs to the high-shear region. In this region, it is difficult to predict the effect of gas on liquid turbulent viscosity. For mainstream regions between the baffles, the maximum value of turbulent viscosity is much lower than the middle peak, and as the volume fraction of introduced gas increases, the increase in turbulent viscosity becomes particularly pronounced but not the direct result of the second term on the right side of Equation (12). Taking the gas introduced of 0.01 volume fraction as an example, it is found that the overall change in turbulent viscosity is very little in Figure 12 after removing the second term and only retaining the viscous shear term. Additionally, when approaching the backflow surface of the baffle, where the gas increase is abrupt in Figure 10, there is a significant increase in total turbulent viscosity. Therefore, gas introduced directly increases turbulent viscosity, while bubble-induced turbulence only has a significant impact in regions with high gas content (>10%).
4.2. Gas Volume Fraction Distribution
In this section, first, the standard case is discussed to analyze the overall gas volume fraction distribution characteristics and local gas accumulation conditions. Then, the standard case is compared with the case without PBM, researching the extent to which the bubble size distribution affects the gas volume fraction distribution. Finally, the standard case is compared with cases under different boundary conditions to investigate the impact of boundary changes.
Figure 13 illustrates the distribution characteristics of gas volume fraction for symmetric sections and cross-sections at different heights. The overall distribution of gas volume fraction is significantly uneven. The grid at the bottom right corner shows that the gas volume doubles from the inlet region to the outlet region, which corresponds to a decrease in the absolute pressure of the outlet to approximately half of the inlet. Meanwhile, the average gas volume fraction from D-0 to D-4 gradually increases, and it is notably lower at D-5 compared to D-3 and D-4. Starting from the second cross-section, it can be observed that the gas volume fraction near the outer shell significantly decreases, reaching less than 0.1%, while the gas volume fraction near the center can exceed 1%. The gas volume fraction distribution pattern between each pair of baffles is similar with the difference that the gas content and range in the central coalescence zone gradually increase.
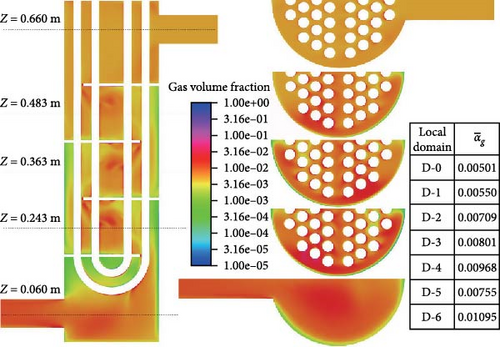
The accumulation of gases is worth exploring. As shown on the left side of Figure 14, between the baffles, the gas volume fraction is lower along the diagonal toward both sides. The maximum volume fraction of gas is coincident with the center of the backflow vortex, and the gas volume fraction can reach over 1%. At the separation vortex formed by separation flow, there is a noticeable accumulation of gas. The reason for this is as described in Section 4.1; on the one hand, there is a backflow formed by an adverse pressure gradient that gas introduced; on the other hand, the presence of lateral forces makes it easier for gas to be introduced. Furthermore, due to the existence of a low-velocity region below the baffle and the buoyancy effect of bubbles in the liquid, there is a high gas volume fraction (>10%) accumulation below the baffle. Viewed from the symmetrical cross-section, the thickness of gas is very small, while the range is large viewed from the cross-section near the wall surface of the plate on the right side of Figure 14. In contrast, there is no such gas accumulation near the upper wall surface of the lower baffle.
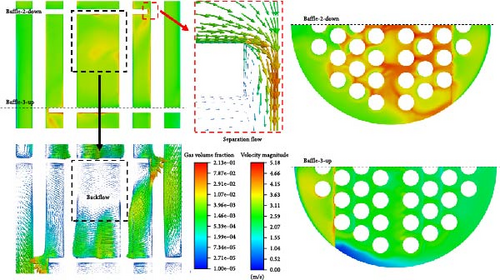
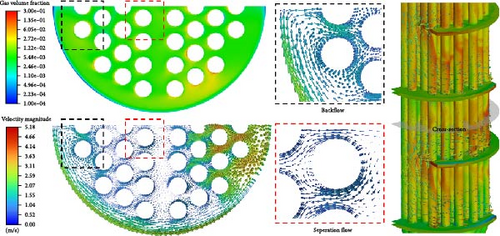
The flow structure has a significant impact on the distribution of gases. Figure 15 displays the gas volume fraction distribution and velocity vector distribution comparison at the cross-section in the middle of the D-3 domain. The principle of gas accumulation is similar to the gas introduced in the flow around a baffle. The primary phase passes through a circular tube, which is separated at the separation point on the backflow surface, forming a separation vortex that rolls into the gas, causing gas accumulation (>1%) on the overall backflow surface of the tube bundle. However, the distribution is not regular, and the location, range, and volume fraction of the gas accumulation vary, making the situation quite complex.
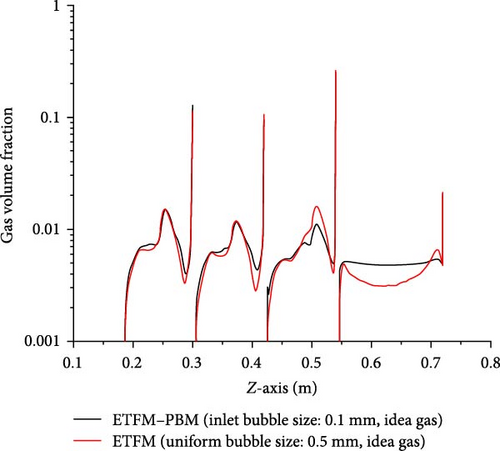
The impact of coupled PBM on the distribution of gas volume fraction in ETFM is worth exploring. Figure 16 compares the gas volume fraction with the standard case (ETFM–PBM) and without PBM (ETFM). Since the average bubble size with the standard case is close to 0.5 mm throughout the entire domain, the fixed bubble size for the comparison case was set at 0.5 mm. As shown in Figure 16a, the distributions of the two cases are not the same. ETFM–PBM and ETFM have similar distributions on the bottom surface of the third baffle, and Figure 16b also shows that their average gas volume fractions are similar in the D-3 to D-6 region, while Figure 16c also shows that they are most similar between the third and fourth baffles (0.186 m < z < 0.300 m, D-4). The reason why ETFM–PBM and ETFM are only locally similar is that different bubble sizes lead to different interphase forces, resulting in different gas volume fraction distributions. The large difference in inlet bubble sizes leads to significant differences. As the flow moves downward, the average bubble size increases, and the gas density changes in a similar manner, leading to gradually similar distributions of the two physical quantities. Therefore, the impact of flow-induced changes in bubble size distribution on gas volume fraction distribution cannot be ignored, indicating that coupling PBM with ETFM is very important.
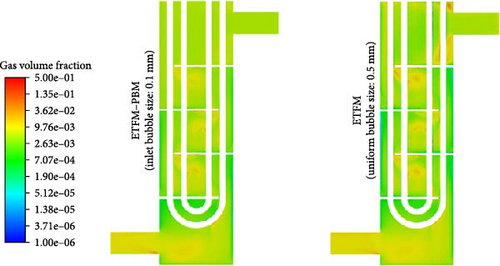
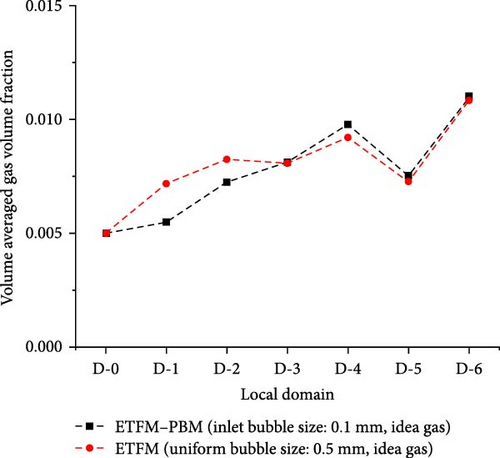
Under the condition that the flow pattern in the main flow domain is still a dispersed bubble flow, the boundary conditions that can usually be changed include the inlet bubble size, the inlet gas volume fraction, and the outlet pressure to explore the effect factors of gas volume fraction distribution. Because the gas volume fraction in the whole domain will increase with the increase of the inlet gas volume fraction, the effect of changing the inlet bubble size and the outlet pressure is discussed here. As can be observed from Figure 17a, the average gas volume fraction in the D-2 to D-6 region varies between the two different outlet pressure cases, with the difference being the greatest in the D-6 outlet segment. For the local gas distribution, as seen in Figure 17b, there is still a trend of increasing gas volume fraction from the inlet to the outlet. Furthermore, this increase is greater with decreasing outlet pressure. However, the distribution changes are not significant. The reason may be that increasing outlet pressure significantly reduces the average gas volume fraction in the area adjacent to the outlet segment, while the velocity field plays a more significant role in influencing the maximum gas volume fraction between the baffles.
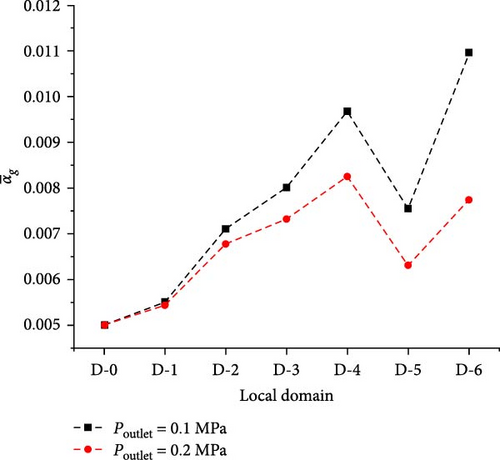
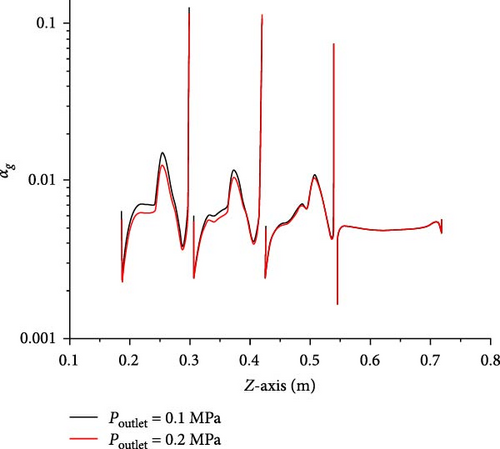
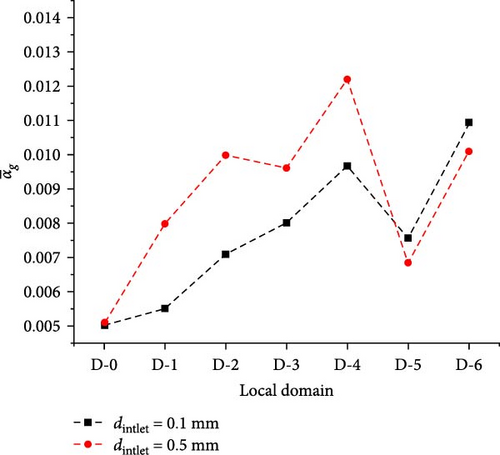
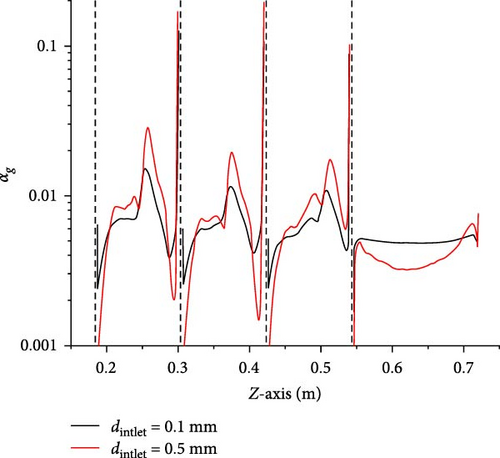
Figure 18 shows the gas volume fraction distribution for the case where the bubble size of the inlet is 0.5 mm. Compared to Figure 13, it can be observed that the distribution is more uneven. The diagonal areas between the baffles and below the baffles have higher gas volume fraction content, and there is gas accumulation in the local area at the upper left corner of the symmetry plane, with a volume fraction of over 60%. The reasons for these phenomena are that bubbles with a size of 0.5 mm are subjected to buoyancy forces much greater than bubbles with a size of 0.1 mm, making it easier for bubbles to flow upward and harder for them to follow the primary phase downward along the mainstream direction. In D-1, the flow velocity of the two-phase flow from D-0 impacting the tube bundle decreases, forming a low-velocity region in the upper left corner of the heat exchanger. Bubbles are drawn into this region and cannot flow downward due to the drag force of the primary phase, thus accumulating and forming retention. Additionally, the minimum wall spacing within the heat exchanger is narrow, with a minimum distance of only 4 mm, increasing the probability of bubble collisions and easily forming larger bubbles, exacerbating the aforementioned accumulation tendency.
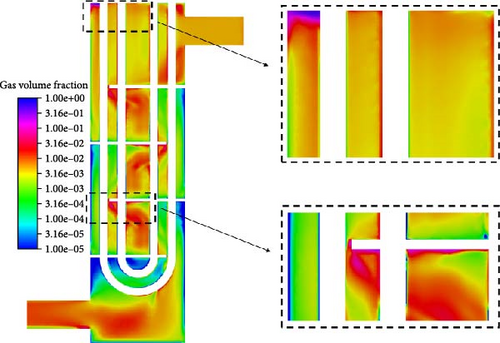
Figure 19a shows that the average gas volume fraction is higher for the 0.5 mm inlet bubble size compared to the 0.1 mm inlet bubble size case in the domains D-1 to D-4 as well as D-5 and D-6 in Figure 13. This also indicates that in areas where there is a reverse pressure gradient forming a recirculation, larger bubbles are more likely to accumulate. Figure 19b also suggests that between each adjacent baffle, the gas volume fraction of the case is higher for the 0.5 mm bubble size of the inlet compared than the 0.1 mm bubble size, with the maximum position being closer to the upper wall surface. Furthermore, looking at the inlet segment (0.546 m < z < 0.72 m), there is a noticeable increase for the 0.5 mm case near the upper boundary, indicating that large bubbles are significantly affected by buoyancy effects.
4.3. Bubble Size Distribution and Characteristics
In this section, first, the standard case is discussed to analyze the characteristics of bubble size distribution. Second, the source terms in PBE of each bubble size group are combined with the main mechanisms of bubble coalescence and breakage to discuss the size distribution and flow patterns of bubbles. Finally, the standard case is compared with cases under different boundary conditions to investigate the impact of boundary changes.
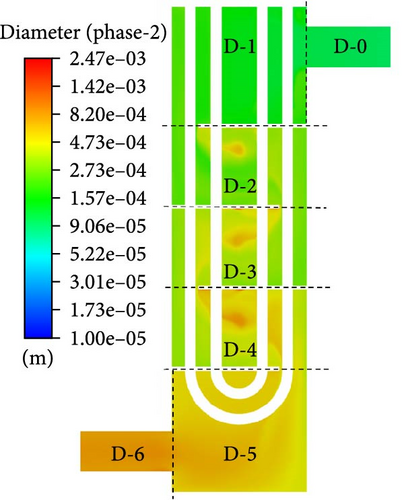
Figure 20 presents a visual depiction illustrating the variation in Sauter mean diameter in different domains. The Sauter mean diameter consistently increases in a downward flow, as illustrated in Figure 20b. In Figure 20a, the distribution of Sauter mean diameter is relatively uneven. In the low-velocity flow region between each pair of adjacent baffles, the bubble size is considerably larger than in the main flow region, with a distinct peak in bubble size observed at the center of the backflow vortex. In the flow process from D-5 to D-6, there is a most pronounced increment observed.
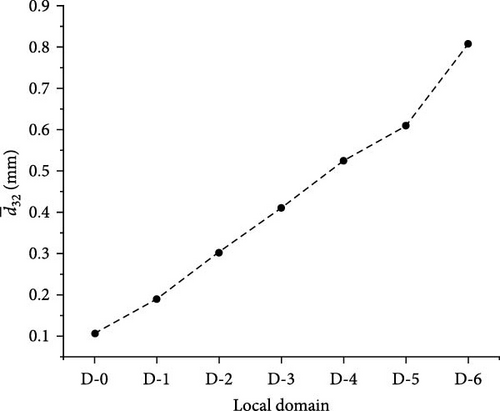
In Figure 21, the distribution characteristics of bubble size in D-1 to D-6 appear approximate to Gaussian distribution. The volume fraction of the maximum value shows a slight trend of decreasing, but it remains above 0.2. The abscissa of the maximum value gradually increases, corresponding to the increase in the Sauter mean diameter. From the D-1 to D-4, the growth rate of the abscissa of the maximum value gradually slows down, and in the D-5 to D-6 regions, the growth rate further increases, which also corresponds to the Sauter mean diameter change on the right-hand side of Figure 20.
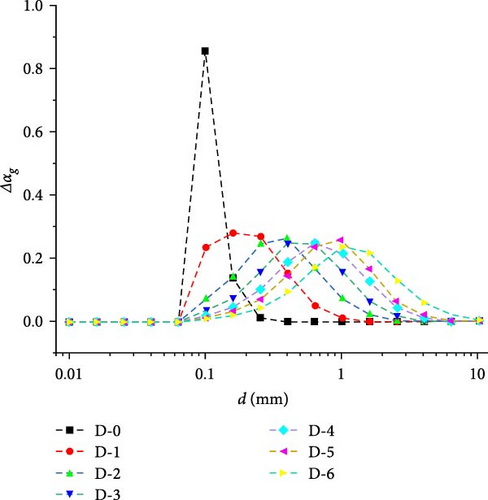
Figure 22 shows the distribution of bubble sizes in each class, ranging from 0.1 to 2.56 mm on a cross-section of the symmetrical plane. Overall, the distribution of bubbles with a size class of 0.4 mm is the most widespread. The classes with sizes less than 0.4 mm are predominantly distributed in the upper part of the heat exchanger, while the bubbles in other sizes are predominantly distributed in the lower part of the heat exchanger. As volume fractions with sizes, less than 0.1 mm and greater than 2.56 mm are rare, they are not listed in Figure 22. It can be observed that bubbles with a size of 0.1 mm from the inlet tend to coalesce and expand into larger bubbles as they flow down to the outlet. However, there is a certain limit to the coalescence and expansion activity of bubbles. The distribution characteristics of bubble size distribution will maintain an approximate Gaussian distribution as shown in Figure 21.
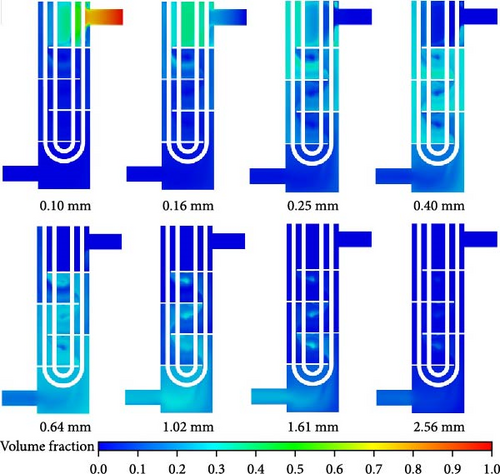
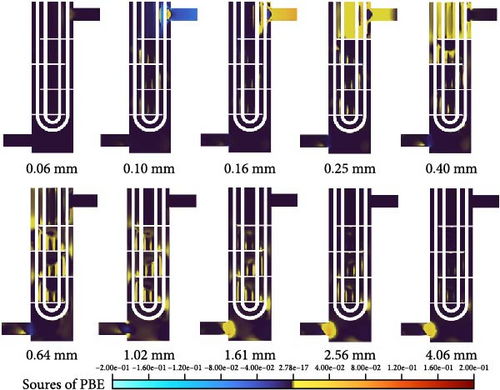
The formation of new-sized bubbles originates from the expansion, breakage, or coalescence of other bubbles. Figure 23 displays the source term distribution of the PBE formula for bubble classes ranging from 0.06 to 4.06 mm, where the PBE source term is the sum of the expansion, coalescence, and breakage terms. When flowing in from the inlet, the source term at the inlet segment is negative for 0.1 mm, while classes larger than 0.1 mm have a positive source term, indicating that their expansion or coalescence reduces the bubble number density of 0.1 mm class. When flow encounters the tubes, an impact region forms where bubbles are broken down into smaller sizes, less than 0.1 mm, due to shear forces. As shown in Figure 22, the source term in this region is nonzero for the 0.06 mm class. During the main downward flow around the baffle, coalescence, and breakup mainly occur in the mainstream region, and coalescence dominates overall. Compared to Figure 22, It can be observed that the generated region is not necessarily the region with the highest bubble content. Taking large bubbles ranging from 1.02 to 2.56 mm as an example, it can be seen from Figure 22 that they are mainly distributed in the low-velocity backflow region between adjacent baffles, while in Figure 23, their generation in the mainstream regions is extremely large. Combined with the relative velocity shown in Figure 9c, some large bubbles are highly likely to be generated in the mainstream region as they move with the velocity field and accumulate in low-velocity regions. Meanwhile, in Figure 23, the source term distribution from 0.4 to 2.56 mm in the low-velocity flow region shows that as the backflow vortex gradually transitions toward the center, larger bubbles are produced closer to the center of the backflow vortex, which corresponds to Figure 22 and becomes more pronounced as bubbles increase in size, indicating that some of the large bubbles gathered in low-velocity regions are produced by small bubbles entrained by vortex currents. In the transition region between D-5 and D-6, large bubbles ranging from 1.61 to 4.06 mm are generated due to the narrowing of the flow interface, which increases the probability of bubble collisions and leads to produce larger size bubbles, corresponding to the discussion of D-5 to D-6 in Figures 20 and 21.
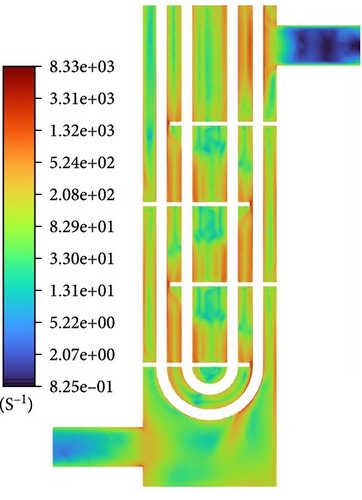
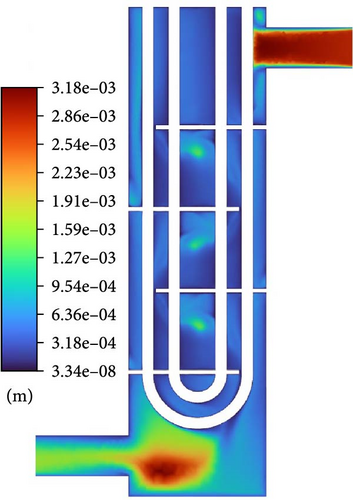
The mechanisms of coalescence include turbulent eddy capture, turbulent fluctuation, relative velocity between bubbles caused by shear, body force, and wake entrainment. Due to the downward flow of the heat exchanger and the apparent high velocity, the main body force, namely buoyancy effects generated by gravity, does not lead to significant coalescence. Wake entrainment causes coalescence only when there are bubbles larger than or equal to a critical size (10 mm), so it can be ignored. Therefore, bubble coalescence is mainly caused by turbulence and shear, and Figure 24 is used to discuss the patterns of action of these two factors. According to the coalescence frequency formula of the Liao Baseline Model [38], the shear strain rate of bulk flow is important to approach velocity between bubbles. For turbulence, when the size of two bubbles is less than or equal to the turbulence length scale, turbulence causes coalescence in the form of eddy capture, and flow characteristic strain rate of flow in the smallest eddies is important to approach velocity between bubbles, which is determined by turbulence dissipation rate, and when the size of two bubbles is greater than the turbulence length scale, turbulence causes coalescence in the form of disturbance, in which the approach velocity between bubbles is still determined by the turbulence dissipation rate. Therefore, the turbulence dissipation rate represents coalescence caused by turbulence. The distribution of the shear strain rate of bulk flow and turbulence dissipation rate in Figure 24 is relatively larger in the mainstream region and near the boundary. However, the distribution characteristics of the shear strain rate of bulk flow in the mainstream region are like those of each class source term in Figure 23, indicating that coalescence caused by velocity gradient in the mainstream region is the primary factor in bubble coalescence. The shear strain rate of bulk flow near the inlet and outlet, as well as the backflow vortex regions, weakens significantly, and the turbulence length scale in these areas is significantly larger than that around them. The turbulence dissipation rate in these regions is much larger than 0; therefore, bubble coalescence near the inlet and outlet, as well as backflow vortex regions, might be caused by turbulence, and the proportion of coalescence caused by vortex capture should be much larger than that in surrounding areas.
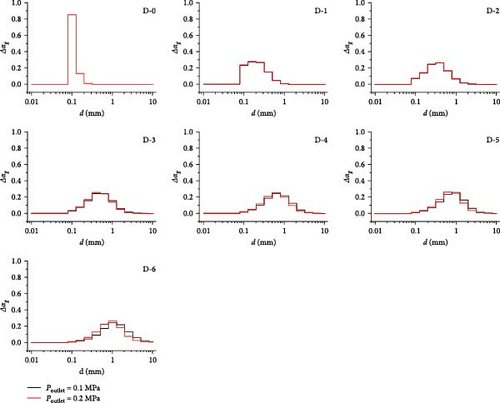
Similar to the discussion of the influence of changing the boundary conditions on the gas volume fraction, the influence of changing the boundary conditions, including the inlet gas volume fraction and the outlet pressure on the bubble size distribution, is investigated here. The increase in outlet pressure, with a constant pressure drop between the inlet and outlet and a constant size of the inlet gas bubbles, results in a diminished expansion effect of the bubbles. However, under these operating conditions, the expansion of the bubbles is significantly less than the size increase brought about by their coalescence activity. As shown in Figure 25, at a pressure drop of 0.12 MPa, increasing the outlet pressure from 0.1 to 0.2 MPa has a limited impact on the distribution of bubble sizes. The distribution in the D-0 to D-3 domains is essentially coincident, with the greatest difference occurring near the outlet area. However, the largest volume fraction of the bubble size class remains unchanged.
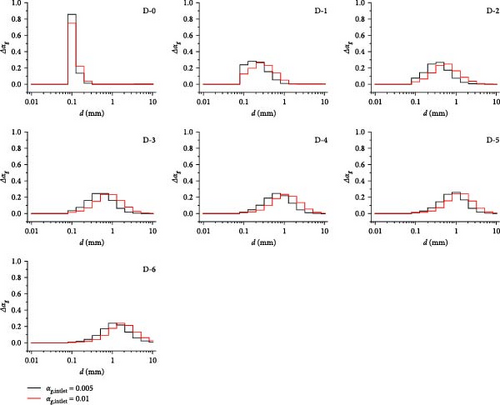
Maintaining the bubble size at the inlet and increasing the inlet gas volume fraction leads to an increase in the number of bubbles per unit volume, thereby increasing the probability of bubble coalescence activities. Figure 26 shows the comparison of bubble size distribution for different inlet gas fraction cases, starting from the D-0 domain, which is the inlet segment, where a difference in distribution is observed between the two cases; the case with an inlet gas volume fraction of 0.01 has a larger central value than another case for the bubble size distribution, and with D-0 to D-6, the difference becomes more pronounced, reaching a peak where in the D-6 domain, the central value increases to the next size class, indicating that the average bubble volume has nearly doubled.
4.4. Distribution Characteristics of Interfacial Area Concentration
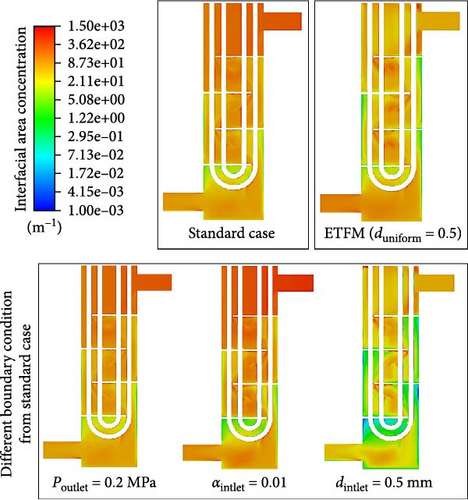
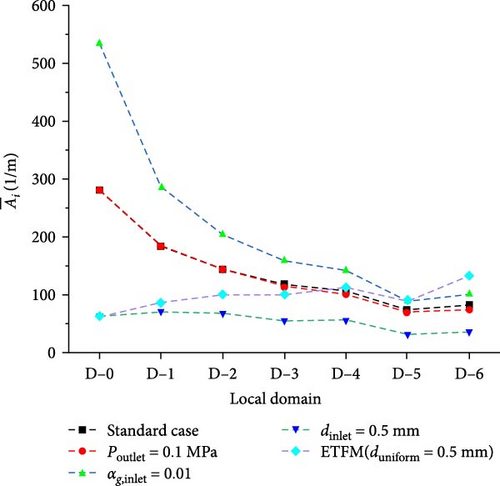
Figure 27 shows the comparison of interface area concentration between cases different from the standard boundary conditions and the standard case. Due to the overall tendency of the bubbles in the heat exchanger to coalesce, the size of bubbles from the inlet to the outlet gradually increases, resulting in a gradual decrease in interface area concentration from the inlet to the outlet. Except for the case with an inlet bubble size of 0.5 mm, the interface area concentration of the other four cases exhibits significant variations from the inlet to the outlet, with a relatively more even distribution. In contrast, the distribution of interface area concentration for the case with an inlet bubble size of 0.5 mm is extremely uneven, with minimal changes at both the inlet and outlet. Figure 28 presents the statistical analysis of the averaged interface area concentration in different domains for various cases. Compared to the standard case, altering the outlet pressure has the least impact on the interface area concentration; increasing the inlet gas bubble size to 0.5 mm results in a significantly lower interface area concentration at the inlet, but the concentration variation from the inlet to the outlet remains relatively stable at 0.5 mm. Without altering the bubble size, increasing the inlet gas volume fraction leads to the interface area concentration being twice that of the standard case, but as the downward flow, with the increase in bubble size, the interface concentration near the outlet domains D-5 and D-6 approaches a level like that of the standard case. The interface area concentration for cases corresponding to D-5 and D-6 in Figure 28 indicates that, under different boundary conditions, the averaged interface area concentration tends to approximate after several baffles and bundle tubes in the flow path. Compare the standard case with the case without PBM coupling. From the comparison of Figures 27 and 28, the interface area concentration distribution of the ETFM (duniform = 0.5 mm) case is more even than the standard case. As shown in Figure 28, because the bubble diameter of the ETFM (duniform = 0.5 mm) case is uniform, the interface area concentration increases from inlet to outlet with gas expansion, which is very different from the standard case.
4.5. The Effect of Gas Introduction on Heat Transfer
In this section, we compare the heat transfer performance for three cases: the introduction of no gas, the introduction of 0.005 gas volume fraction, and the introduction of 0.01 gas volume fraction. The aim is to investigate the extent and factors of the impact of the introduction of a small amount of gas into the heat exchanger of the MSR on its heat transfer performance.
Table 3 presents a comparison of heat transfer physical quantities for different cases. Case 1-2 involves a single-phase molten salt without gas introduction, while Case 2-2 involves a two-phase system with gas introduction. The values of 0.005 and 0.01 represent the gas volume fraction introduced at the inlet. Although the outlet temperature decreases with increasing gas introduction, the reduction does not exceed 0.77°C, which is negligible compared to the nearly 20°C temperature difference between the inlet and outlet. The heat transfer rate of the heat exchange tube, that is, the total thermal power of the heat exchanger, gradually increases with increasing gas introduction a little, particularly in Case 2-2-0.01, where the absolute value increases by 3.7% compared to Case 1-2. The same pattern holds for both the average heat flux and the heat transfer coefficient of the heat exchange tube wall, as well as the total thermal power. However, it is noteworthy that the total thermal power at all boundaries, which represents the numerical error, also increases with increasing gas introduction. Therefore, the impact of gas introduction on the heat transfer performance near the wall of the heat exchange tube is not exclusive to the numerical error possibly.
| Physical quantity related to heat transfer | Case 1-2 | Case 2-2-0.005 | Case 2-2-0.01 |
|---|---|---|---|
| Temperature of molten salt at the outlet (°C) | 580.83 | 580.76 | 580.06 |
| Heat transfer rate for inlet (kW) | 14,399.35 | 14,400.13 | 14,400.15 |
| Heat transfer rate for outlet (kW) | −13,917.00 | −13,920.87 | −13,908.27 |
| Heat transfer rate at the tubes (kW) | −482.34 | −483.57 | −500.29 |
| Deviation of total heat transfer rate for all boundary (kW) | −0.00 | −4.31 | −8.41 |
| Averaged surface heat flux for tubes (W/m2) | −701,468.88 | −703,252.49 | −727,573.75 |
| Averaged surface heat transfer Coef. (W/m2 K) | −1388.53 | −1392.03 | −1440.15 |
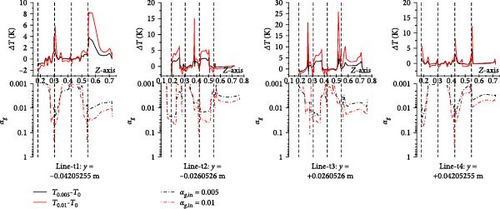
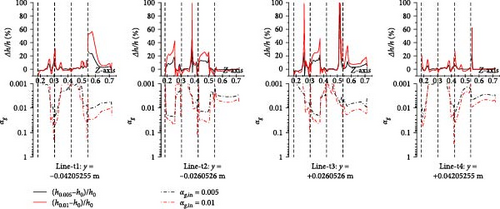
Due to the accumulation of gas near the wall surface of the heat exchange tube, it affects the local heat transfer performance. Therefore, for different cases, the temperature and heat transfer coefficient on the four parallel lines (line-t1 to line-t4) closest to the tube wall surface on the innermost U-tube on the symmetrical plane are statistically analyzed and compared with the gas volume fraction. As shown in Figure 29, the gas introduced in some cases results in a local temperature near the wall surface that is higher than in cases without gas introduction. For instance, in line-t1, the maximum difference between the 0.01 gas introduction case and the no-gas introduction case can reach 8 K, corresponding to the gas volume fraction; a pattern emerges where the higher the gas fraction, the greater the temperature change with more gas introduction. Figure 30 shows that the pattern of gas influence on the heat transfer coefficient near the wall surface of the heat exchange tube is like that of gas influence on the molten salt temperature. Taking the influence brought by 0.01 gas introduction in line-t1 as an example, over 1% gas accumulation corresponds to a change in the heat transfer coefficient of over 40% on a local 0.05 m line segment; therefore, there is a positive correlation between the gas fraction and its influence on the heat transfer coefficient.
5. Conclusion
- 1.
The secondary phase does not completely follow the movement of the primary phase, and when it encounters obstacles (such as heat exchange tubes and baffles) and buoyancy effects, it has a relative velocity with the primary phase. The introduction of inert gas has a certain impact on the low-velocity region of the molten salt flow field, enhancing the turbulent viscosity of the molten salt flow, and this enhancement increases with the increase of gas content. The turbulence induced by gas bubbles only significantly enhances the turbulent viscosity in regions with a high gas volume fraction. Therefore, in the heat exchanger structure, there is a significant velocity difference between the primary and secondary phases, and the introduction of gas has an impact on the flow of molten salt, which should be considered in engineering design.
- 2.
The distribution of gas volume fraction is significantly uneven. In low-velocity regions, there is accumulation at the center of the backflow vortex and the separation vortex regions of the separated flow. Typically, gas volume fraction accounts for approximately 1%–3% in the accumulation regions. There is extensive adhesion near the wall of the heat exchange tube, with local areas exceeding 10%. Due to the upward relative velocity between the two phases and the low-velocity region behind the baffles, a high gas volume fraction adhesion occurs behind the baffles, with local regions exceeding 10%. These high gas fraction accumulations should be paid attention to. When comparing standard cases with those without PBM coupling, it is evident that the influencing factor for the distribution of gas volume fraction, besides the flow field, is primarily the size of the bubbles, which indicates that PBM, considering coalescence and fragmentation mechanism, is appropriate. Similarly, when comparing with cases where the inlet bubble size is increased, it further validates the importance of bubble size on the distribution of gas volume fraction. Additionally, altering the outlet pressure boundary, that is, controlling the degree of expansion of the gas volume, is also an important factor affecting the distribution of gas volume fraction.
- 3.
Bubbles tend to coalesce and expand into larger-sized bubbles from the inlet to the outlet of a heat exchanger. The bubble size distribution presents an approximate Gaussian distribution. The size of bubbles primarily ranges from 0.1 to 2.56 mm. Among them, the distribution of 0.4 mm bubble groups is the most widespread. The reasons for the formation of these distribution characteristics are as follows: The coalescence and breakage activities of bubbles mainly occur in the mainstream region, where shear is dominant and tends to favor bubble coalescence. However, due to the distribution of velocity fields, large-sized bubbles are produced in the mainstream region and transported to low-velocity flow regions for coalescence. In the vortex center region of low-velocity areas, there is also a production and coalescence of large-sized bubbles, and turbulence-induced coalescence is more significant than in other regions, with eddy capture mechanisms accounting for a higher proportion. Furthermore, in addition to the important factors affecting the flow field, the most important factor affecting the bubble distribution is the gas volume fraction. Therefore, in the geometric structure similar to the heat exchanger, the simulation of dispersed bubble flow should pay more attention to the calculation of turbulence and the influence on bubble coalescence and fragmentation in addition to shear flow.
- 4.
For different boundary conditions of ETFM–PBM calculation case of heat exchanger, when the flow passes through multiple baffles, the interface area concentration will tend to be stable. In the case of uncoupled PBM, the interface area concentration increases gradually from the inlet to the outlet with the gas expansion, which is very different from other cases. Again, the importance of considering coalescence, breakage and expansion mechanism in the simulation of dispersed bubble flow in molten salt heat exchanger is explained.
- 5.
The introduction of less than 1% inert gas does not significantly affect the overall heat transfer performance of the molten salt heat exchanger; however, it has a significant impact on the local wall surface heat transfer performance, such as the surface heat transfer coefficient of the heat exchange tube. The changes in near-wall surface temperature and surface heat transfer coefficient brought by the introduction of gas are positively correlated with the near-wall gas volume fraction. Therefore, it is necessary to further investigate the impact of introducing a small amount of inert gas on the performance of the heat exchanger.
Nomenclature
-
- a:
-
- Coefficient in turbulence model
-
- A:
-
- Area concentration (1/m)
-
- B:
-
- Birth rate (1/m3/s)
-
- Cp:
-
- Thermal conductivity (W/m/K)
-
- Cbuoy:
-
- Constant in coalescence model
-
- CD:
-
- Drag coefficient
-
- Cμ,B:
-
- Constant in bubble-induced source terms
-
- CL:
-
- Lift force coefficient
-
- Cshear:
-
- Constant in coalescence model
-
- CTD:
-
- Turbulent dispersion force coefficient
-
- CW:
-
- Coefficient in wall lubrication force
-
- Cwc:
-
- cutoff coefficient in wall lubrication force
-
- Cwd:
-
- Damping coefficient in wall lubrication force
-
- CWL:
-
- Wall lubrication force coefficient
-
- Cμ:
-
- Constant in turbulence model
-
- d:
-
- Bubble diameter (m)
-
- D:
-
- Death rate (1/m3/s)
-
- Dω:
-
- Positive portion of the cross-diffusion term
-
- e:
-
- Energy (J)
-
- Eo:
-
- Eötvös number
-
- f:
-
- The function in the lift force coefficient
-
- F:
-
- Blending function
-
- :
-
- Volumetric force vector (N/m3)
-
- :
-
- Gravitational acceleration (m/s2)
-
- G:
-
- Turbulence production (m2/s3)
-
- h:
-
- Enthalpy (J); heat transfer coefficient (W/K/m2)
-
- k:
-
- Kinetic energy (m2/s2)
-
- m:
-
- Mass (kg)
-
- mp:
-
- Power law constant in wall lubrication force
-
- M:
-
- Number of size groups
-
- :
-
- The force of interphase force (N/m3)
-
- :
-
- Normal unit vector to the wall
-
- N:
-
- Number density function (1/m3)
-
- Nu:
-
- Nusselt number
-
- p:
-
- Pressure (Pa)
-
- Pr:
-
- Prandtl number
-
- R:
-
- Constant in turbulence model
-
- Re:
-
- Reynolds number
-
- S:
-
- The modulus of the mean rate-of-strain tensor (1/s)
-
- Sij:
-
- Strain-rate tensor (1/s)
-
- t:
-
- Time coordinate, time scale (s)
-
- :
-
- Velocity vector (m/s)
-
- ui or u, v, w:
-
- Velocity component (m/s)
-
- urel:
-
- Approach velocity (m/s)
-
- uT:
-
- Terminal velocity (m/s)
-
- y:
-
- Distance to the nearest wall (m)
-
- xi or x, y, z:
-
- Spatial coordinates (m)
Greek Letters
-
- α:
-
- Volume fraction
-
- β:
-
- Coefficient in turbulence model
-
- η:
-
- The length scale of the turbulent eddies
-
- Γ:
-
- Coalescence rate (m3/s)
-
- κ:
-
- Constant in turbulence model
-
- λ:
-
- Coalescence efficiency
-
- Φ:
-
- Constant in turbulence model
-
- σ:
-
- Surface tension (N/m)
-
- σpq:
-
- Dispersion Prandtl number
-
- μ:
-
- Dynamic viscosity (Pa·s)
-
- ν:
-
- Kinematic viscosity
-
- ε:
-
- Turbulence dissipation (m2/s3)
-
- ω:
-
- Turbulent frequency (1/s)
-
- Ω:
-
- breakup rate (1/s)
-
- Ωij:
-
- Vorticity tensor
-
- π:
-
- ≈3.1415926
-
- ρ:
-
- Density (kg/m3)
-
- τ:
-
- Stress (N/m2)
Subscripts
-
- ag:
-
- Aggregation
-
- br:
-
- breakup
-
- B:
-
- Bubble
-
- buoy:
-
- Buoyancy
-
- c:
-
- cutoff
-
- crit:
-
- Critical value
-
- d:
-
- Diameter, damping
-
- D:
-
- Drag
-
- eddy:
-
- Eddy
-
- eff:
-
- Effective
-
- eq:
-
- Equivalent
-
- ε:
-
- Dissipation rate
-
- fric:
-
- Interfacial friction
-
- g:
-
- Gaseous phase
-
- H:
-
- Horizontal
-
- i:
-
- Size group index, coordinate index
-
- ij:
-
- Matrix index
-
- j:
-
- Size group index, coordinate index
-
- k:
-
- Kinetic energy, size group index
-
- l:
-
- Liquid phase, size group index
-
- L:
-
- Lift
-
- max:
-
- Maximum value
-
- rel:
-
- Relative
-
- shear:
-
- Shear-induced
-
- sm:
-
- Sauter mean
-
- σ:
-
- Surface tension
-
- T:
-
- Terminal
-
- TD:
-
- Turbulence dispersion
-
- turb:
-
- Turbulence
-
- viscous:
-
- Viscous collision
-
- W, w:
-
- Wall
-
- WL:
-
- Wall lubrication
-
- wake:
-
- Wake entrainment
-
- ω:
-
- Turbulent frequency.
Conflicts of Interest
The authors declare no conflicts of interest.
Funding
This work was supported by the Shanghai Sailing Program (No. 19YF1457900), the National Natural Science Foundation of China (No. 12005290), the Youth Innovation Promotion Association of the Chinese Academy of Sciences (No. 2020261), and the Shanghai Pilot Program for Basic Research-Chinese Academy of Sciences, Shanghai Branch (JCYJ-SHFY-2021-003).
Acknowledgments
This work was supported by the Shanghai Sailing Program (No. 19YF1457900), the National Natural Science Foundation of China (No. 12005290), the Youth Innovation Promotion Association of the Chinese Academy of Sciences (No. 2020261), and the Shanghai Pilot Program for Basic Research-Chinese Academy of Sciences, Shanghai Branch (JCYJ-SHFY-2021-003).
Open Research
Data Availability Statement
The data that support the findings of this study are available from the corresponding author upon reasonable request.


