Modeling and Simulation of Syngas Potential From Supercritical Water Gasification of Combustible Municipal Solid Waste Materials
Abstract
Municipal solid waste (MSW) generation has threatened human health and the environment while being a renewable energy source for green energy transition. Traditional waste-to-energy technologies have shown their limits in terms of energy efficiency and pollution, whereas numerous studies were conducted on “supercritical water gasification (SCWG) technology to achieve a neutral carbon footprint. However, there is limited research and a lack of knowledge on SCWG of different combustible municipal solid waste (CMSW) materials. Hence, this study aimed to assess the gasification efficiencies and syngas potential from SCWG of different CMSW materials, composed of putrescible, miscellaneous combustible (MC), plastic, textile, and paper&cardboard, through modeling and simulation in Aspen Plus. The energy content and greenhouse gas (GHG) potential of predicted syngas composed of H2, CH4, CO, and CO2 were assessed under optimal operating conditions obtained through sensitivity analysis. As a result, the temperature of 650°C, pressure of 22 MPa, and waste-to-water ratio of 1:5 were optimal conditions with temperature being the most influencing parameter on the gasification. Moreover, putrescible achieved the lowest gasification efficiency (GE), carbon gasification efficiency (CE), hydrogen gasification efficiency (HE), and energy recovery (ER) of 83.379%, 99.981%, 25.629%, and 8.657%, respectively, with the lowest high heating value (HHV) of 0.94 MJ/kg, low heating value (LHV) of 0.80 MJ/kg, and GHG potential of 0.002 kg CO2 eq. The highest CE (100.013%) and ER (243.067%) were obtained from textile and paper&cardboard, respectively, while the highest GE (155.165%) and HE (140.213%) were obtained from plastic. Plastic showed the highest energy content, with an HHV of 42.98 MJ/kg and LHV of 38.30 MJ/kg, along with the highest GHG potential (15.788 kg CO2 eq), attributed to its inherent high yields of H2 and CH4. Therefore, decision-makers could consider syngas recovery from SCWG of CMSW to mitigate environmental pollution and offset fossil fuel dependency.
1. Introduction
The increasing municipal solid waste (MSW) generation trend around the world, due to anthropogenic activities inherent to population growth, economic development, and urbanization, has led to several environmental pollution issues through its mismanagement, especially in developing countries [1]. In addition, the rapid population growth resulted in energy crisis with the scarcity of fossil fuel resources such as coal, crude oil, and natural gas, the world’s largest primary energy resources. In fact, over the last decades, several alternatives were adopted, to divert waste from landfill known as the default technique for waste management, such as incineration, pyrolysis, gasification, and anaerobic digestion for chemical energy recovery (ER) stored in waste materials to mitigate waste pollution. This can be observed with food waste disposed in landfills, which is responsible for ~8% of anthropogenic methane emissions worldwide [2]. Hence, the waste-to-energy concept has gained interest and thought as the sustainable pathway for energy transition and mitigating waste pollution. Nevertheless, it is shown that plastic waste incineration leads to toxic emissions, high cost, and low product yield [3]. Comparing with conventional waste-to-energy technologies, “supercritical water gasification (SCWG) has shown a carbon conversion efficiency higher than 90% with no uncontrolled emissions [4]. Since the first study of SCWG on forest residues in the mid-1970s [5], several investigations were conducted on biomass wastes such as sugarcane bagasse [6], sewage sludge [7], paper waste sludge [8], clover grass [9], and black liquor and dairy industry waste [10, 11]. A wide range of waste materials with high moisture can be processed under SCWG technology, which would require about 2242 KJ/kg for drying under conventional technology [12]. This is made possible thanks to the physicochemical properties of supercritical water (SCW) at a critical temperature of 374°C, pressure of 22.1 MPa, and density of 0.322 g/cm3 with the ability to dissolve insoluble materials and accelerate thermochemical reactions [13]. The MSW materials such as trommel fines, textile, refuse derived fuel, mixed waste wood, and mixed waste plastic were also investigated under SCWG for syngas recovery in the United Kingdom [14]. In addition, the mixed municipal food wastes were studied for syngas and H2-rich syngas recovery from SCWG in China [15–17]. Therefore, it is found that syngas, H2-rich syngas, and CH4-rich syngas are renewable and clean energy that can be recovered from MSW materials such as biomass wastes [18]. On the other hand, the SCWG modeling and simulation for gas product yield prediction from waste materials were a commonly used method, which would be costly in real-world experiments [19]. The nonstoichiometric thermodynamic equilibrium models were widely considered based on Gibbs free energy minimization [20–22]. Indeed, the process involves reactions such as pyrolysis, hydrolysis, steam reforming, water gas shift reaction (WGSR), methanation, depolymerization, decomposition, bond cleavage, dehydration, decarboxylation, deamination, recombination of reactive fragments, and other undetermined thermochemical reactions [23, 24]. The operating parameters such as reaction temperature, residence time, reaction pressure, feed concentration, catalyst loading, heating rate, and reactor type were also studied and found to affect the gasification efficiencies [25]. From the above-mentioned statements and to the best of the authors’ knowledge, there is limited research on the effect of different combustible municipal solid waste (CMSW) materials on syngas products and gasification efficiencies under SCWG. Meanwhile, in most African developing countries, there is a lack of knowledge on syngas recovery from SCWG of CMSW materials though known to contain moisture that can be higher than 50 wt% [26]. Therefore, this study aimed to assess the potential of syngas from SCWG of CMSW materials from Lomé (Togo) and evaluate the effect of operating parameters such as temperature, pressure, and waste-to-water ratio on gas product yields and gasification efficiencies. In addition, the energy content and greenhouse gas (GHG) potential from gas products was evaluated.
2. Materials and Methods
2.1. Waste Material Properties
The feedstock waste materials used in this study were composed of putrescible, miscellaneous combustible (MC), plastic, textile, and paper&cardboard. These CMSW materials considered were collected from the engineering landfill center of Lomé in Togo and were analyzed to determine their physicochemical properties such as volatile matter (VM), fixed carbon (FC), ash content (ash), high heating value (HHV), and low heating value (LHV) [26]. The elemental composition such as carbon (C), nitrogen (N), sulfur (S), hydrogen (H), and oxygen (O) from CMSW materials was determined by using the vario PYRO cube CNSOH all-in-one universal instrument (Elementar Analysensysteme GmbH, Germany), on a dry ash-free basis. Table 1 presents the CMSW materials composition on average basis from duplicate tests of proximate and ultimate analyses, as well as heating values.
| Element | Proximate analysis (wt%)a | Ultimate analysis (wt%)b,# | HHV (MJ/kg)b | LHV (MJ/kg)b,c | ||||||
|---|---|---|---|---|---|---|---|---|---|---|
| VM | FC | Ash | C | N | S | H | O ∗ | |||
| Putrescible | 49.73 | 4.17 | 46.08 | 22.4 | 0.87 | 0.176 | 2.47 | 74.08 | 9.79 | 9.29 |
| MC | 71 | 9.39 | 19.59 | 38.7 | 0.485 | 1.057 | 13.54 | 46.21 | 20.35 | 17.59 |
| Plastic | 58.07 | 1.82 | 40.09 | 69.78 | 0.32 | 0.146 | 15.29 | 14.46 | 33.51 | 30.40 |
| Textile | 89.73 | 3.87 | 6.39 | 50.87 | 1.15 | 0.161 | 19.65 | 28.16 | 19.6 | 15.60 |
| Paper&cardboard | 78.07 | 5.59 | 16.33 | 39.89 | 0.39 | 0.166 | 16.55 | 43 | 14.07 | 10.70 |
| Putrescible + paper&cardboard | 61.83 | 11.81 | 26.34 | 31.14 | 0.63 | 0.17 | 9.51 | 58.54 | 12.11 | 10.17 |
| Putrescible + plastic + paper&cardboard + textile | 72.38 | 9.34 | 18.26 | 45.74 | 0.68 | 0.16 | 13.49 | 39.93 | 20.39 | 17.65 |
| Putrescible + MC + textile + plastic + paper&cardboard | 73.51 | 7.27 | 19.21 | 44.33 | 0.643 | 0.34 | 13.5 | 41.19 | 17.51 | 14.76 |
| MC + textile + plastic + paper&cardboard | 73.8 | 10.23 | 15.96 | 49.81 | 0.59 | 0.38 | 16.26 | 32.96 | 21.78 | 18.47 |
| MC + textile + plastic | 71.89 | 9.51 | 18.58 | 52.58 | 0.64 | 0.45 | 15.99 | 29.32 | 22.04 | 18.78 |
| MC + plastic | 73.43 | 7.13 | 19.43 | 54.24 | 0.40 | 0.60 | 14.42 | 30.34 | 23.64 | 20.71 |
- aDry basis.
- bDry ash-free basis.
- c.
- ∗By difference.
- #, , , , and .
2.2. Thermodynamic Equilibrium Model
2.2.1. Model Description
The SCWG modeling was elaborated under Aspen Plus, a software widely used for chemical engineering processes. Figure 1 shows the process flow diagram of a nonstoichiometric thermodynamic equilibrium model of SCWG under Peng–Robinson equation of state modified with Boston–Mathias alpha function (PR-BM) property package owing to complex and undetermined numerous reactions involved in the process. The PR-BM was proven across many studies to well fit the thermodynamic equilibrium results of SCWG [27–30]. Hence, the feedstock materials represented by the proxanal and ultanal component attributes on a dry ash-free basis, where N, S, and ash content were ignored, result in only VM, FC, C, H, and O contents, which were mixed with water in the MIXER unit operator. The feed slurry pumped through the PUMP unit operator with 65% isentropic efficiency [31] was preheated in the HEATER unit operator before the gasification in the reactor. The SCWG reactor was assumed to operate under isothermal and isobaric conditions through RGIBBS unit operator with Gibbs free energy minimization mode at specified temperature and pressure [32]. While the RYIELD unit operator from the reactor was in charge of thermally decomposing the feed slurry material into its elementary conventional components of C, H2, O2, and H2O through the use of FORTRAN code to estimate their yields from component attributes in a calculator block. The product from the SCWG reactor was cooled down to atmospheric temperature and pressure conditions in a COOLER unit operator before being sent to a gas–liquid separator (GL-SEP) for syngas recovery under atmospheric conditions. The developed process flow diagram was simply designed to fit numerical and experimental studies of SCWG largely employed in literature [33, 34]. The initial operating parameters of temperature (400°C) and pressure (22 MPa) were defined to ensure the SCW condition was reached, while the waste-to-water ratio (1:5) was set to provide a sufficient amount of water for the gasification. This was done by setting the MIXER, PUMP, and HEATER unit operators to have from their outlets the corresponding operating conditions for the simulation of the SCWG reactor. The simulation of the reactor was done under steady-state condition assuming that the gasification process reaches the equilibrium condition over an infinite time. Hence, the overall system specifications, operating conditions, and assumptions of the thermodynamic equilibrium modeling and simulation of syngas recovery from SCWG of CMSW materials are presented in Table 2.

| Model specification | Description |
|---|---|
| Thermodynamic property package | Peng–Robinson equation of state modified with Boston–Mathias alpha function |
| Stream class | MIXCINC |
| Enthalpy mode | HCOALGEN |
| Density mode | DCOALIGT |
| Temperature range | 400–800°C |
| Pressure range | 22–30 MPa |
| Waste-to-water ratio | 1:5–1:45 |
| Waste material | Proxanal and ultanal component attributes |
| Assumptions |
|
2.2.2. Model Validation and Implementation
Before model implementation, a validation step was conducted using thermodynamic equilibrium and experimental data from SCWG of dried paper waste sludge in South Africa [8]. Similar assumptions of neglecting N, S inorganic content, and dry ash-free basis of dried paper waste sludge were considered through the use of its reduced component attributes of VM (83.55 wt%), FC (16.45 wt%), C (49.25 wt%), H (5.91 wt%), and O (44.84 wt%). It was indicated that the inorganic and ash content was mostly stable in solid and aqueous form and did not affect the gas product composition which was determined per mass of dry ash-free basis but could affect the energy required and system design in an experimental process setting [27, 35]. Also, the presence of minor hydrocarbon gas components such as ethene (C2H4), ethane (C2H6), propene (C3H6), propane (C3H8), and butane (C4H10) was neglected from gas products mainly composed of H2, CH4, CO, and CO2, based on common practice found from literature [8, 36–38]. Therefore, the study model was simulated under the operating conditions of biomass-to-water ratio (1:10), temperature (450°C), and pressure (27 MPa) by considering the same biomass feed composition [8]. These operating conditions were set over the unit operators of MIXER, PUMP, HEATER, and SCWG reactor (i.e., RGIBBS and RYIELD) as indicated in the process flow diagram. The mixing, cooling, and gas separation phase was set over the atmospheric conditions of 25°C and 0.1 MPa through the MIXER, COOLER, and GL-SEP unit operators, respectively [30]. From the main gas component yields obtained and the ones from the thermodynamic equilibrium of SCWG simulation in the study of Louw et al., the root mean square error (RMSE) and mean square error (MSE) were computed for the validation phase. Moreover, the computation of such error metrics was conducted to evaluate the deviation between the equilibrium results and the experimental ones from the same biomass feedstock. Afterward, the simulation of the SCWG process was conducted by varying three different operating parameters such as temperature, pressure, and waste-to-water ratio, to evaluate their influences on the gas products and gasification efficiencies through the sensitivity analysis to get optimal operating conditions. Hence, the simulation was done in the temperature range of 400–800°C, pressure range of 22–30 MPa, and waste-to-water ratio range of 1:5 to 1:45. These ranges of temperature, pressure, and waste-to-water ratio were appropriately set regardless of the required SCW condition and the sake of minimizing the design and operating cost in real-world experiment [19]. Further, under the optimal operating conditions, the SCWG of different CMSW materials as well as their composites made in equal weight proportion were run to evaluate their influences on gas product yields and gasification efficiencies. Besides, the heating values of gas products obtained from different waste materials were compared to assess their effects on the gasification process.
2.3. Result Interpretation
2.4. GHG Potential Analysis
The goal is to assess and compare the potential of GHG emissions from SCWG of CMSW materials within a system boundary considering only the gas products predicted. The direct GHGs are CO2, CH4, nitrous oxide (N2O), perfluorocarbons (PFCs), hydrofluorocarbons (HFCs), sulfur hexafluoride (SF6), and nitrogen trifluoride (NF3) according to the United Nations Framework Convention on Climate Change (UNFCCC) through the use of the Intergovernmental Panel on Climate Change 2006 (IPCC) guidelines for GHG inventories [41]. Therefore, the GHG potential was computed as the sum of gas product amount generated multiplied by the default weight value of global warming potential (GWP100) over a time horizon of 100 years which is 25 for CH4 determined from the reference value 1 of CO2 [42]. The main GHGs studied were CO2 and CH4 among others and expressed in kilogram of CO2 emission equivalent per kilogram unit of waste (i.e., kg of CO2 eq/kg).
3. Results and Discussion
3.1. Model Validation
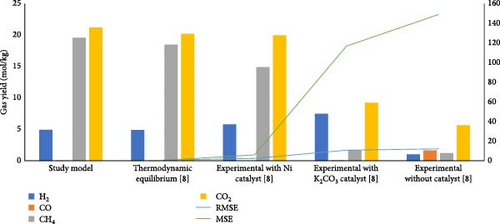
Under the SCW conditions of temperature (450°C) and pressure (27 MPa), the model results were compared with the thermodynamic equilibrium and experimental SCWG results from Louw et al. [8]. Figure 2 indicates that the lowest RMSE (0.74) and MSE (0.54) values were achieved between the study model and the thermodynamic equilibrium model from Louw et al. [8] showing its reliability in predicting the gas product yields. Although the noncatalytic experimental results showed significant deviation from the ones of the study model, the catalytic experimental results demonstrated that the equilibrium conditions of SCWG could be attained with the use of appropriate catalyst [43]. This justifies the low RMSE (2.46) and MSE (6.05) values in the case of nickel (Ni) catalytic SCWG compared to potassium carbonate (K2CO3) catalytic test, illustrating the closest experimental results of gas yields to the ones from the study model.
3.2. Sensitivity Analysis
The SCWG of putrescible waste material was conducted under different operating conditions of temperature (400–800°C), pressure (22–30 MPa), and putrescible-to-water (PTW) ratio (1:5–1:45), to look for the optimal operating conditions for the gas product yields and gasification efficiencies. This sensitivity analysis was conducted through the Aspen Simulation Workbook in Microsoft Excel software and allowed to assess the effects of different parameters on the gasification as discussed in the subsequent sections.
3.2.1. Effect of Temperature
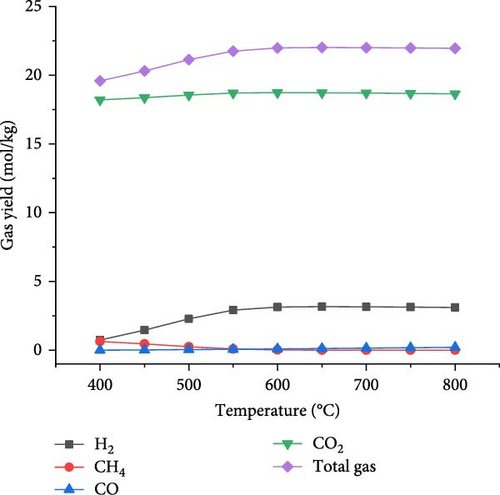
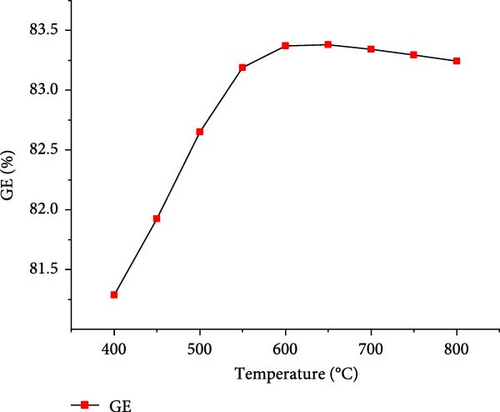
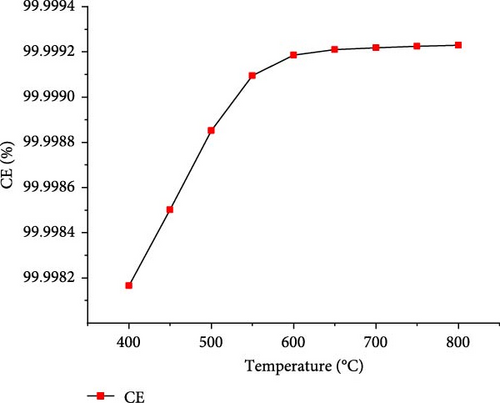
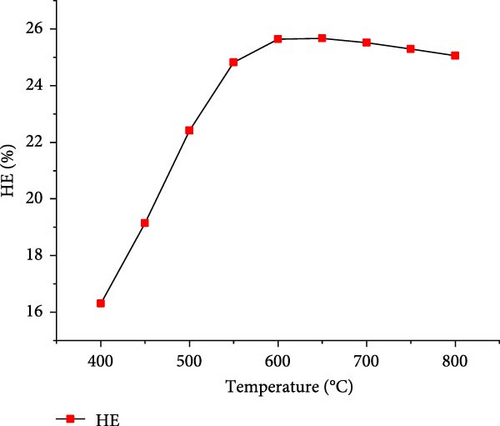
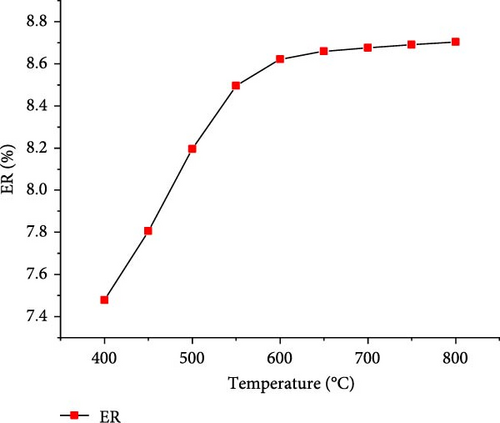
The effect of temperature on SCWG of putrescible material was simulated under the operating conditions of 22 MPa and PTW ratio of 1:5, and the results are presented in Figure 3. With increasing the temperature from 400 to 650°C, the H2 yield and total gas yield increased from 0.73 to 3.17 mol/kg and 19.58–22.01 mol/kg, respectively, and then further decreased slightly with increasing temperature. This could be explained by the complete conversion of the H content present in putrescible at 650°C, resulting in the decrease of H2 and total gas production with further increase in temperature. A similar observation was made through the gasification of biomass after 750°C with the gas yield almost constant showing that the higher temperature could be ineffective due to energy requirement [31]. However, CO yield increased continuously with increasing temperature, probably due to the higher rate of produced CO through putrescible steam reforming than the CO consumed in WGSR to produce H2 and CO2 [44]. Meanwhile, the highest CH4 yield of 0.64 mol/kg and CO2 yield of 18.73 mol/kg were achieved at 400°C and 600°C, respectively, indicating that the methanation of CO and CO2 might be favored at low temperature, whereas at high temperature, the WGSR and steam reforming prevailed. The low values of CH4 and CO yields and trends could be explained by the exothermic nature of methanation reaction and the presence of water favoring WGSR [29, 30]. Cao et al. [45] found in their study on diosgenin SCWG from 450 to 650°C at 25 MPa that all gas products increased with complete gasification, probably due to feedstock content and the synergistic effect of high pressure and temperature which promoted the methanation and steam reforming, respectively. Therefore, H2 and total gas prediction were shown to be highly influenced by temperature in line with several studies that found temperature as the most influencing parameter for the gasification and H2 production from SCWG [31, 46]. In addition, Figure 4 depicts a sharp increasing trend of the GE, CE, HE, and ER from 400 to 650°C with the maximum values of 83.38 and 25.67% achieved for GE and HE, respectively, and then decreased slightly with further increase of temperature. After 650°C, the CE and ER slightly increased to achieve the maximum values of 99.99923% and 8.70%, respectively, at 800°C owing to the endothermic nature of decomposition, hydrolysis, and steam reforming reactions of SCWG [47]. The high CE values indicated that almost all the carbon content in putrescible was gasified, while the low values of HE could be due to the limited amount of H content in putrescible which did not favor its reactivity with water. Overall, based on the H2 yield, total gas yield, GE, and HE, the optimal operating temperature of 650°C was considered.
3.2.2. Effect of Pressure
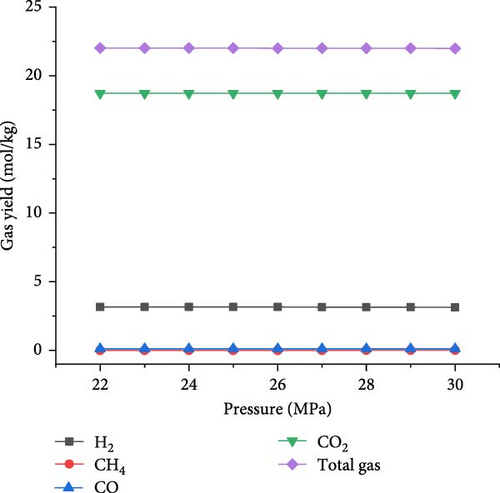
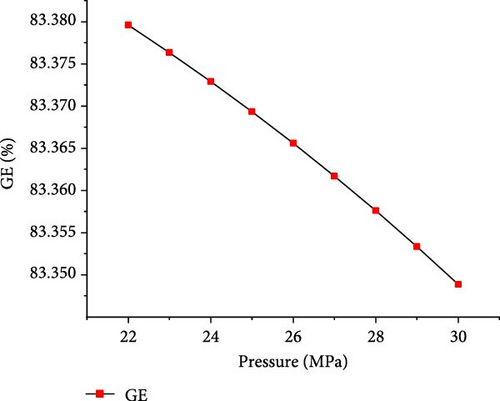
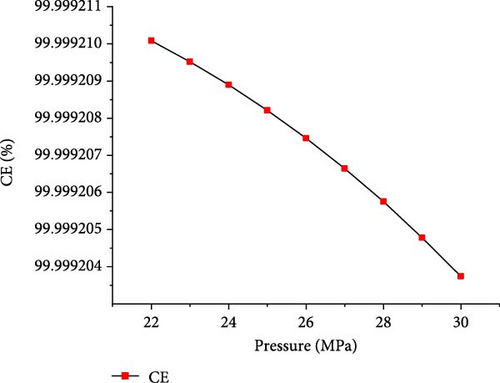
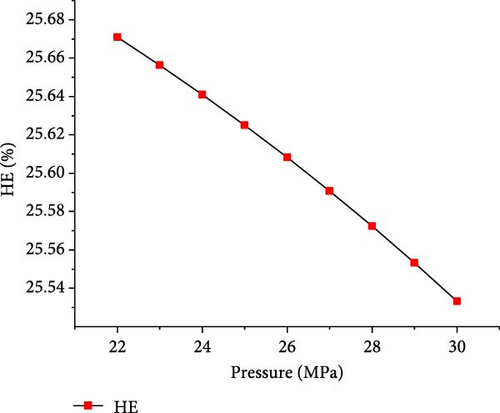
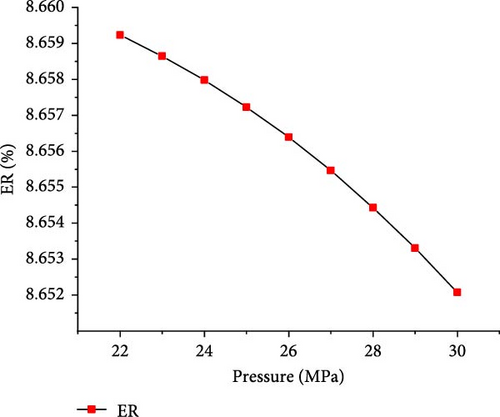
The simulations were conducted at the temperature of 650°C and PTW ratio of 1:5, by varying pressure from 22 to 30 MPa to investigate its effects on SCWG of putrescible. Figure 5 shows that the gas product yields and total gas yield changed slightly with increasing pressure. From 22 to 30 MPa, the yields of H2, CO2, and total gas decreased slightly from 3.17 to 3.14 mol/kg, 18.72–18.71 mol/kg, and 22.01–21.98 mol/kg, respectively, while CH4 and CO yields increased slightly from 0.004 to 0.01 mol/kg and 0.11–0.12 mol/kg, respectively. This indicated that increasing pressure did not favor gas production, because the steam reforming reaction was probably inhibited at high pressure. Similar trends were found in several studies confirming the negligible effect of pressure on gas production from SCWG of plastic waste [30], almond shell and algae [36], and glycerol [48]. Macrì et al. [36] found that the effect of high pressure on gas product yields tends to disappear. In contrast, Lin et al. [49] showed that the total gas production increased with pressure above 34 MPa up to 105 MPa under the same operating temperature of 650°C, because of the higher pressure that might enhance the feedstock content reactivity with water. Therefore, increasing the pressure from 22 to 30 MPa is not conducive to gas production from SCWG of putrescible. Moreover, Figure 6 shows that with increasing pressure from 22 to 30 MPa, the GE, CE, HE, and ER decreased slightly from 83.38% to 83.34%, 99.99921%–99.99920%, 25.67%–25.53%, and 8.659%–8.652%, respectively. These results showed again the negligible effect of pressure on the gasification efficiencies and ER from SCWG of putrescible material; however, the low HE and ER illustrated the low H2 yield owing to the low H content in putrescible. During the gasification of plastic waste under SCW conditions, Lu et al. [44] found that increasing the pressure from 22 to 29 MPa has little effect on the CE, HE, and GE. Hence, according to Le Chatelier’s principle, higher pressure inhibits the endothermic reactions such as steam reforming and WGSR favored at high temperature resulting in the decrease of total gas yield and gasification efficiencies [21, 31]. In addition, from the experimental setup of the SCWG process, higher pressure is ineffective, and it is recommended to adopt low pressure for reducing the construction and operating costs [3]. As a result, to achieve the highest H2 yield and gasification efficiencies, a pressure of 22 MPa was selected as the optimal condition.
3.2.3. Effect of PTW Ratio
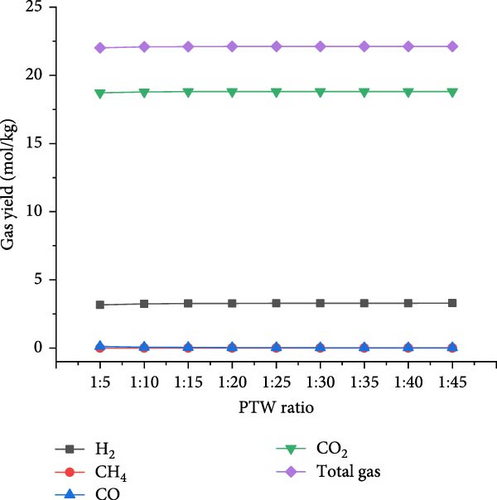
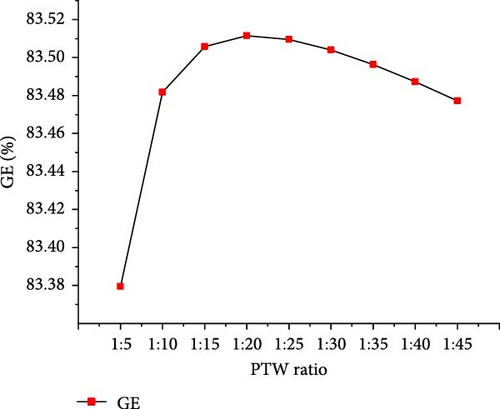
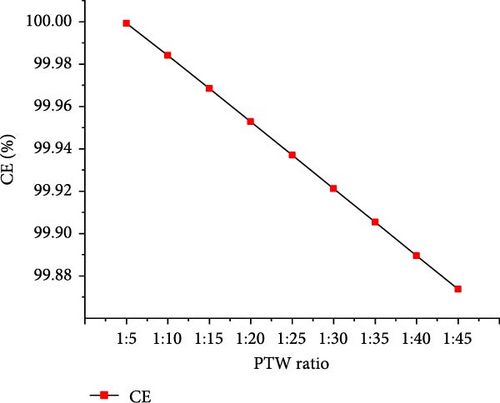
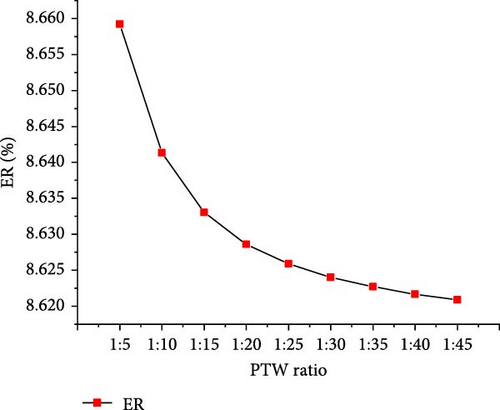
The optimal operating conditions of temperature (650°C) and pressure (22 MPa) were considered to assess the effects of PTW ratio ranging from 1:5 to 1:45 (i.e., feed concentration). Figure 7 shows that with increasing PTW ratio from 1:5 to 1:45, the CO2 and total gas yields increased to the maximum values of 18.81 and 22.11 mol/kg, respectively, at 1:35 PTW ratio and then decreased slightly. H2 yield continuously increased to the maximum value of 3.29 mol/kg at 1:45 PTW ratio, indicating that lower feed concentration favored the interaction between putrescible and water. This is probably due to the promoted WGSR that consumed CO to produce CO2 and H2 [50], as illustrated by the decrease in CO from 0.12 to 0.01 mol/kg with increasing PTW ratio from 1:5 to 1:45. Moreover, the decreasing trend of CH4 yield was confirmed by the findings of Cao et al. [47] who showed that CH4 fraction decreased from 35.55% to 11.74% with decreasing feed concentration from 25 to 5 wt%. The increase in total gas yield was confirmed with a similar trend of the total gas yield obtained when increasing plastic to water ratio from 1:4 to 1:20 [30]. However, it was found that increasing the PTW ratio had a low influence on H2 and total gas yield predicted under the optimal temperature and pressure conditions, probably due to the excess of water that would require the increase of temperature and result in heat loss [40]. Figure 8 shows the increasing trend of GE and HE to the maximum of 83.51 (at 1:20 PTW ratio) and 26.57% (at 1:45 PTW ratio), respectively. The CE and ER decreased from 99.99% to 99.87% and 8.65%–8.62%, respectively, with increasing PTW ratio. This is justified by the decrease of CH4 yield that was not favored at low feed concentration, indicating the inhibition of methanation leading to the increase in CO2 yield and decrease in ER. Therefore, the higher feed concentration of 1:5 PTW ratio increased the gasification reactivity between water and putrescible by increasing gas product yields and, however, could limit WGSR and steam reforming reaction by lowering H2 yield and HE [51]. After 1:20 PTW ratio, the decrease in GE could be due to putrescible low C and H content limiting the gasification reactions. Indeed, based on CH4 yield, CE, and ER to ensure higher GE, the optimal PTW ratio of 1:5 was selected.

3.3. SCWG of Different CMSW Materials
The optimal operating conditions of temperature (650°C), pressure (22 MPa), and PTW ratio (1:5) were considered to simulate the SCWG of different CMSW materials as well as their composites and investigate the gasification efficiencies and gas product yields. The CMSW materials were composed of putrescible, MC, plastic, textile, paper&cardboard, and the composites labeled A (putrescible + paper&cardboard), B (putrescible + plastic + paper&cardboard + textile), C (putrescible + MC + textile + plastic + paper&cardboard), D (MC + textile + plastic + paper&cardboard), E (MC + textile + plastic), and F (MC + plastic).
3.3.1. CMSW Materials Gasification
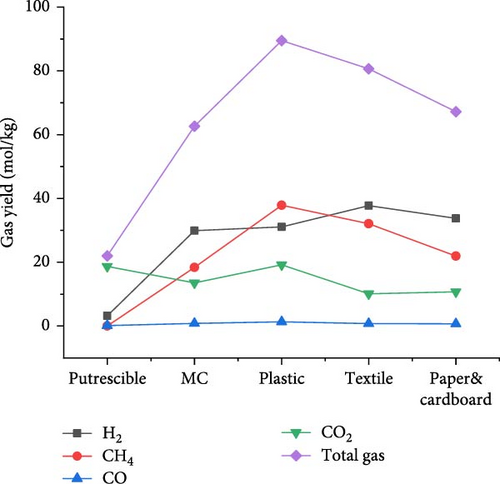
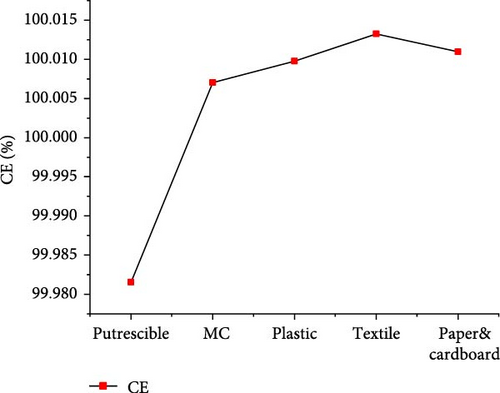
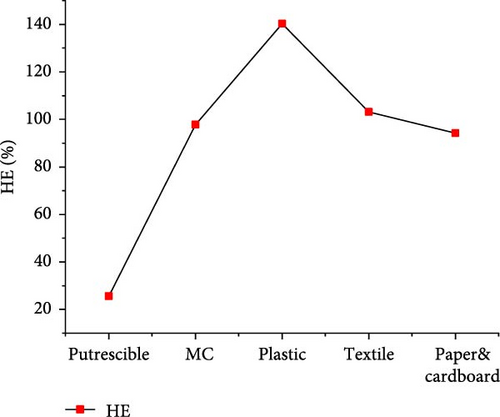
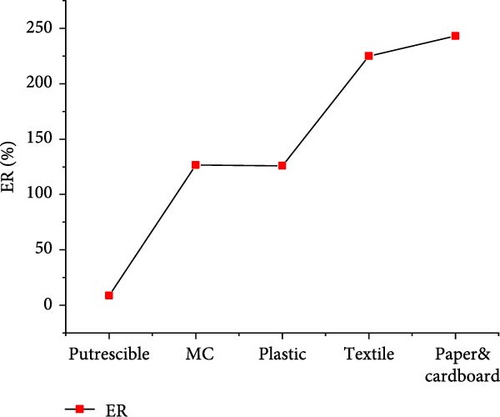
The results of gas product yields presented in Figure 9 indicated the lowest H2, CH4, CO, and total gas yields of 3.170, 0.004, 0.118, and 22.016 mol/kg, respectively, from SCWG of putrescible. The highest H2 yield (37.729 mol/kg) and CH4 yield (37.858 mol/kg) were obtained from textile and plastic, respectively. While the highest CO yield (1.335 mol/kg), CO2 yield (19.184 mol/kg), and total gas yield (89.489 mol/kg) were obtained from plastic. Despite having lower O content (14.464 wt%) from plastic, there was a high contribution of O atoms from water leading to high production of CO and CO2, and a similar observation was made from SCWG of polypropylene [52]. This was confirmed by Onwudili [14] that the SCWG of plastic waste materials tends to yield less CO and CO2 owing to its low oxygen content of 7.01 wt% while yielding more CH4 and hydrocarbon gas than biogenic waste materials. This justified the high CH4 yield found from plastic containing high C (69.78 wt%) and H (15.29 wt%) content. Hence, based on H2 yield, one can classify waste materials in the order of textile > paper&cardboard > plastic > MC > putrescible. Based on CH4 and total gas yields, one can classify waste materials in the order of plastic > textile > paper&cardboard > MC >putrescible. The lowest gas yields from putrescible could be justified by its lowest C (22.4 wt%) and H (2.47 wt%) contents, confirmed through the negative correlation of solid content and composition with CO2, H2, and CH4 yields in literature [53]. Consequently, the GE, CE, HE, and ER achieved the lowest values of 83.379, 99.981, 25.629, and 8.657%, respectively, from putrescible, as indicated in Figure 10. The highest GE and HE of 155.165 and 140.213%, respectively, were achieved from plastic, due to its high C and H content which could intensively interact with water for more gas production, as illustrated by the highest total gas yield obtained. However, the highest CE (100.013%) and ER (243.067%) were achieved, respectively, from textile and paper&cardboard. The approximately high value of 100% of CE and the ER values largely above 100% from MC, plastic, textile, and paper&cardboard indicated a complete gasification of carbon content and a large contribution of H and O contents from water leading to high ER under SCW conditions. Similarly, the CE and HE increased up to 95% and more than 100%, respectively, with the use of a catalyst and the increase of water amount during the SCWG of plastic waste [54]. Therefore, one can classify waste materials based on GE and HE in the order of plastic > textile > MC > paper&cardboard > putrescible.

3.3.2. CMSW Composite Materials Gasification
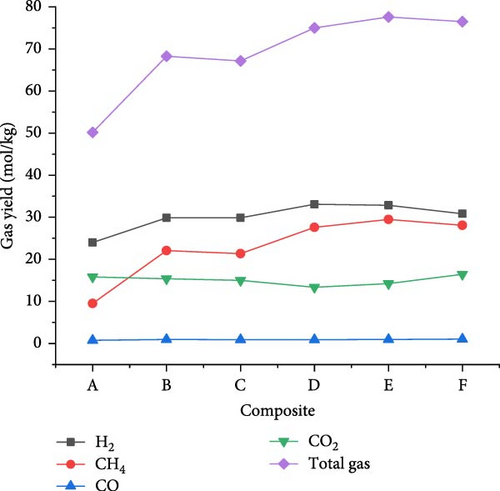
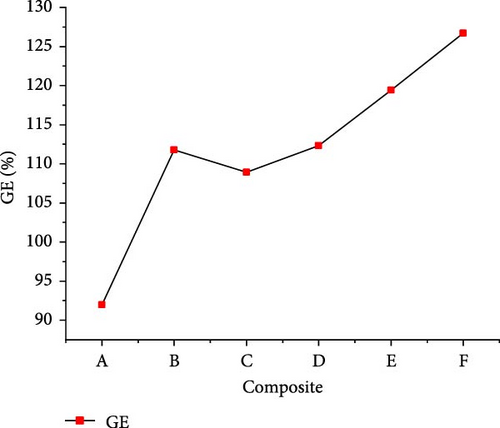
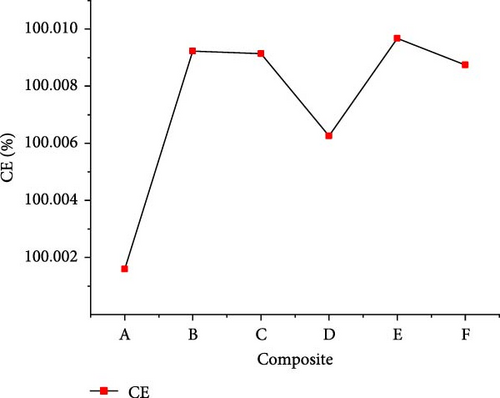
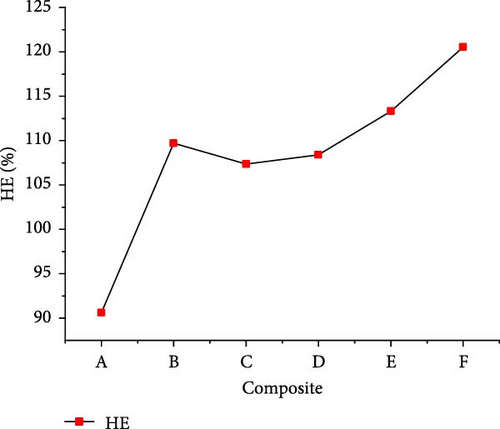
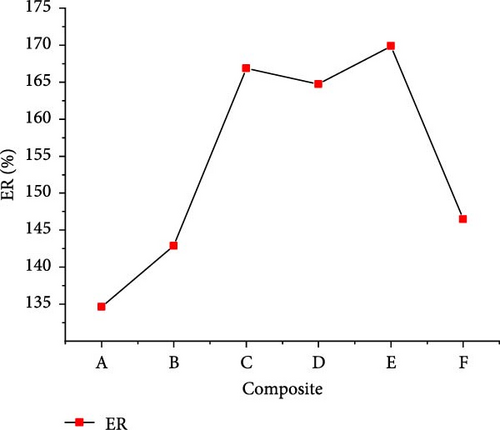
The gasification of composite waste materials was conducted, and the gas product yields obtained are presented in Figure 11. It shows that the H2, CH4, CO, and total gas yields achieved the lowest values of 24.03, 9.54, 0.75, and 50.16 mol/kg from composite A, while the lowest CO2 yield of 13.37 mol/kg was obtained from composite D. However, the highest H2 yield of 33.10 mol/kg obtained from composite D could be explained by its highest H content (16.26 wt%) and volatile content (73.80 wt%) which favored the steam reforming, WGSR, and methanation of CO2 [55]. The highest CH4 and total gas yields of 29.48 and 77.58 mol/kg, respectively, were achieved from composite E due to the synergistic effect of steam reforming, WGSR, methanation, and composite E composition leading to high H2 and CH4 yields. It is found that the H2 yield was higher than the CH4 yield from all composite materials, which is in contrast with the findings of Onwudili [14] where the CH4 yield was higher than the H2 yield from trommel fines, textile, refuse derived fuel, mixed waste wood, mixed waste plastic. This was probably due to the lower H content of such waste materials ranging between 4.77 and 12.5 wt%. Moreover, Figure 12 illustrates that the lowest GE (91.959%), CE (100.002%), HE (90.633%), and ER (134.643%) were achieved from composite A, while composite F achieved the highest GE (126.691%) and HE (120.533%), and composite E achieved the highest CE (100.0097%) and ER (169.893%). The high values obtained demonstrated the complete gasification of composite waste materials under the optimal SCW conditions, highlighting the synergistic effect of waste materials on the gas product yields and the gasification efficiencies.
3.4. Energy Content of Gas Products
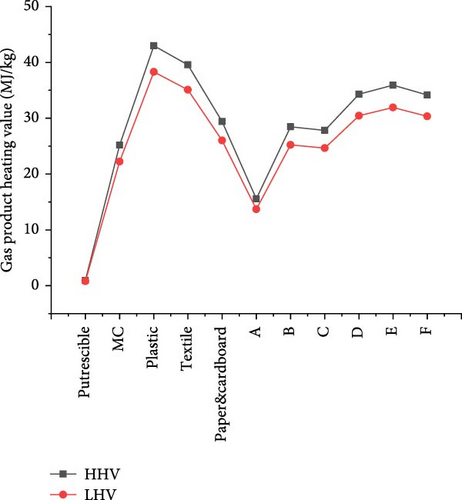
Further investigation on the heating values of gas products from SCWG of CMSW materials is presented in Figure 13. The results showed that the HHVs and LHVs of gas products presented a similar trend, where plastic and putrescible achieved the highest HHV (42.98 MJ/kg), LHV (38.30 MJ/kg), and lowest HHV (0.94 MJ/kg) and LHV (0.80 MJ/kg), respectively. This indicated a high influence of waste material composition on heating values, where the more the C and H content, the more the heating values with a high GE as illustrated by the GE and HE from plastic. High gas product yields increase the heating values, as confirmed by the increase of LHVs when H2 and CH4 yields increase in literature [19]. In addition, from a comparison of different biomass materials, Desnoo et al. [56] found that the one producing the most H2 and CH4 yielded the highest HHV from SCWG. Moreover, the synergistic effect of CMSW materials was shown through the HHVs of composite materials which were all higher than the one of putrescible (Table 1). Hence, composite E and composite A achieved the highest HHV (35.92 MJ/kg) and LHV (31.90 MJ/kg) and the lowest HHV (15.58 MJ/kg) and LHV (13.69 MJ/kg), respectively. Overall, the heating values of gas products from waste materials could be classified in the order of plastic > textile > E > D > F > paper&cardboard > B > C > MC > A > putrescible.
3.5. GHG Potential of Gas Products
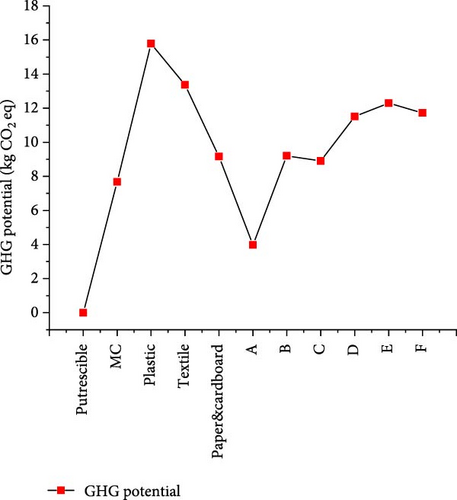
The environmental impact was assessed through the GHG potential from gas products obtained under the optimal operating conditions of 650°C, 22 MPa, and 1:5 waste-to-water ratio. Under the assumption of a system boundary with only gas products considered owing to a lack of data from the whole system of waste collection to treatment, the GHG potential from different CMSW materials is shown in Figure 14. The results showed a proportional trend of the heating values contained in the gas products, because of the high effect of CH4 compared to CO2 resulting from the SCWG process. The highest (15.788 kg CO2 eq) and lowest (0.002 kg CO2 eq) GHG potential were obtained from plastic and putrescible, respectively, indicating that higher gas production leads to higher GHG potential. However, the emission of these gases in the atmosphere could be significantly reduced owing to the SCWG process ability toward zero emissions through the use of gas products recovered in many sectors such as industry, domestic cooking gas, and electricity production. Moreover, it was indicated that there were no secondary pollutants like nitrous (NOx) and sulfurous (SOx) compounds, and the N and S elements were found in aqueous effluent from SCWG, while CO2 could be separated via pressure swing adsorption technique [57, 58]. Nevertheless, from the perspective of biomass conversion to fuel, it was indicated that CO2 that might be released from fuel gas combustion would be equivalent to the one captured during the photosynthesis of plants leading to a neutral CO2 level in the atmosphere [59].
4. Conclusion
This study of SCWG modeling and simulation on CMSW materials from Lomé was conducted to assess the potential of syngas recovery and the efficiency of the conversion process. The validated model of the SCWG process was considered for sensitivity analysis to get the optimal operating conditions of temperature, pressure, and waste-to-water ratio. As a result, the temperature of 650°C, pressure of 22 MPa, and waste-to-water ratio of 1:5 were found as the optimal operating conditions, with the temperature being the most influencing parameter on the gas product yields and gasification efficiencies. Under this condition, based on H2 yield, waste materials were classified in the order of textile > paper&cardboard > plastic > MC > putrescible, while based on CH4 and total gas yields, waste materials were classified in the order of plastic > textile > paper&cardboard > MC > putrescible. Putrescible achieved the lowest GE, CE, HE, and ER of 83.379%, 99.981%, 25.629%, and 8.657%, respectively, with the lowest HHV (0.94 MJ/kg), LHV (0.80 MJ/kg), and GHG potential (0.002 kg CO2 eq). The highest CE (100.013%) and ER (243.067%) were achieved from textile and paper&cardboard, respectively, and the highest GE (155.165%) and HE (140.213%) were achieved from plastic. Besides, from SCWG of composite materials, the lowest GE (91.959%), CE (100.002%), HE (90.633%), ER (134.643%), HHV (15.58 MJ/kg), and LHV (13.69 MJ/kg) were obtained from composite A, while composite F achieved the highest GE (126.691%) and HE (120.533%), and composite E achieved the highest CE (100.0097%), ER (169.893%), HHV (35.93 MJ/kg), and LHV (31.90 MJ/kg). This highlighted the synergistic effect of waste materials in composites on gasification efficiencies, ER, and heating values of gas products obtained. Overall, based on heating values and GHG potential from gas products, waste materials were classified in the order of plastic > textile > E > D > F > paper&cardboard > B > C > MC > A > putrescible. One can conclude that H2 and CH4 are the most inherent gases to energy potential, while simultaneously CH4 could lead to significant GHG emissions. It is recommended to adopt a proper handling approach of gas products obtained from collection to final applications. These results could help decision-makers from the waste and energy sectors in adopting strategies for proper harvesting channels of CMSW materials for syngas recovery by reducing significantly waste environmental pollution and at the same time filling the energy gap. Though this study’s findings have resulted from the thermodynamic equilibrium model on SCWG of CMSW materials, it could shape the way for further experimental tests in the conversion process optimization to achieve the equilibrium condition. This could be done by investigating the use of catalysts for improving the gas product yields and gasification efficiencies, as well as exploring the CO and CO2 sequestration or reutilization.
Conflicts of Interest
The authors declare no conflicts of interest.
Author Contributions
Kanlanféi Sambiani: conceptualization, software, data curation, formal analysis, investigation, methodology, writing–original draft. Yendoubé Lare: supervision, validation, visualization, writing–review and editing. Satyanarayana Narra: supervision, validation, visualization, writing–review and editing. Adamou Zanguina: supervision, validation, visualization, writing–review and editing. Rakshak Kumar: supervision, validation, visualization, writing–review and editing.
Funding
This research was supported by the West African Science Service Centre on Climate Change and Adapted Land Use (WASCAL) and the German Federal Ministry of Education and Research (BMBF).
Acknowledgments
The German Federal Ministry of Education and Research (BMBF) and the West African Science Service Centre on Climate Change and Adapted Land Use (WASCAL) are gratefully acknowledged. The acknowledgement also goes to the authorities of “DAGL” and “SCAN-TOGO” for permitting sample collection and analyses during this project and to the Department of Science and Technology of the Government of India for the CV-Raman fellowship grant given to improve this research. The authors also thank Dr. Diana Werner, Dr. Jan Sprafke, and Dr. Vidhi Singh from the University of Rostock for the elemental analysis of samples.
Open Research
Data Availability Statement
The data that support the findings of this study are available from the corresponding author upon reasonable request.


