How Does Electricity Consumption in Blockchain Applications Impact Resource Consumption and Environmental Emissions?
Abstract
Blockchain technology, known for its decentralized, trustless, and immutable nature, is gaining traction across various industries. As Blockchain 3.0 is expected to see widespread adoption in the sharing economy and energy trading, its associated energy consumption could have significant environmental implications. This study introduces an environmentally extended input–output (EEIO) model to assess the environmental impacts—such as freshwater use, PM2.5 emissions, CO2 emissions, atmospheric Hg, and solid waste generation—linked to blockchain-driven electricity demand. By analyzing scenarios based on projected cryptocurrency hash rates and hardware efficiencies, the study evaluates how large-scale blockchain adoption affects resource consumption and environmental emissions across sectors. The results show that Monero’s design leads to higher resource consumption and environmental impact, with freshwater use being the most affected, followed by greenhouse gas emissions and PM2.5 levels.
1. Introduction
The Internet will drive the world closer together, accompanied by a huge trust gap. At present, on the basis that the current mainstream database technology architecture is private and centralized, the problem related to value transfer and mutual trust cannot be solved. So, blockchain technology is likely to be the next generation of database architecture. Through decentralization technology, it will be possible to achieve huge progress in mathematical (algorithmic) endorsement and global mutual trust based on large data. Blockchain technology, a specific distributed access data technology (distributed ledger technology [DTL]), participates in the calculation and recording of data through multiple nodes in the network and verifies the validity of their information (anticounterfeiting). In brief, blockchain is a kind of non-tampering accounting method shared by all people, with the advantage that it cannot be tampered with at the moment of operation. Therefore, it is also a kind of underlying technology adopted by all kinds of digital cryptocurrencies.
However, is there any problem with the applications of blockchain? When it comes to blockchain, Bitcoin cannot be ignored. Bitcoin is a decentralized (no bank as the third party), person-to-person, peer-to-peer payment electronic currency system, the first but one of the most successful applications of blockchain technology. Bitcoin production is likened to “mining.” “Miners” (participants) use highly specialized hardware facilities to run computing programs, that is, using the computing ability of chips to conduct hashing collisions and take the lead in keeping accounts so as to obtain bitcoins of system rewards. At present, mining is becoming increasingly difficult, mainly depending on the combination of multiple mining machines and ore fields to build ore pools for production, similar to the data center. Since the public ledger of Bitcoin needs to be operated automatically by computers, the cost of the Bitcoin mining sector tends to consume a lot of electricity in addition to the Bitcoin miners and human resources. In 2023, bitcoin consumes about 121.13 TWh of electricity annually, equivalent to the annual electricity consumption seen in Poland1. As the price of Bitcoin continues to rise in 2024, the resulting overall environmental costs will also increase.
So, does blockchain consume such a large electricity in other ways besides bitcoin? Under the blockchain mechanism, every transaction will be processed in the trading pool. When these transactions (255 bytes in theory, 500–800 bytes in practice) reach 1 M capacity, they will be packaged out, authenticated, and recorded by the whole network users. Based on current empirical data, the system will produce a block every 10 min on average with about 2000 transactions, meaning that the system can only handle about three to four transactions per second. In the future, the large-scale applications of blockchain in the shared economy and energy trading, coupled with the improvement of system processing speed, it will also consume a large amount of electricity2.
In order to solve the problem of power consumption and processing speed, researchers have introduced Ethereum3. In order to expand capacity, Ethereum has launched the Raiden Network project, which can increase the transaction capacity to hundreds of thousands per second. Current applications include mass fund-raising platforms, physical assets verification platforms, intelligent locks, virtual treasure trading platforms, copyright licensing (consumers can directly pay creators), electricity transactions, and so on. Similarly, Monero has been an active cryptocurrency in recent years with an emphasis on privacy, decentralization, and scalability. Current applications mainly include an anonymous voting system, anonymous online banking, and a job certification system. However, these applications will all consume huge power resources.
In recent years, the Chinese government has enacted a comprehensive suite of policies designed to foster the research and application of blockchain technology. Notably, the “Guiding Opinions on Accelerating the Application and Industrial Development of Blockchain Technology,” released in 2021, serves as a pivotal document that provides substantial policy support for the industrialization and mainstream adoption of blockchain technologies. However, given the significant energy consumption associated with Bitcoin mining and its potential environmental repercussions, China has adopted a prudent approach towards cryptocurrencies. Since 2019, the country has progressively implemented restrictions on Bitcoin mining and trading activities alongside stringent regulatory frameworks governing blockchain applications within the financial sector [1, 2].
With the anticipated large-scale deployment of Blockchain 3.0 technology in forthcoming years, a substantial increase in its power consumption is projected, potentially precipitating a cascade of environmental concerns. Consequently, it is imperative to adopt a systematic approach to evaluate and consider the implications of blockchain technology on resource depletion and environmental preservation during its widespread adoption. In this context, this study incorporates the environmentally extended input–output (EEIO) model to correlate the application of blockchain technology with selected environmental metrics, including freshwater abstraction, PM 2.5 concentration, and carbon dioxide emissions4. This framework facilitates the assessment of specific environmental impacts associated with the electricity demand induced by blockchain operations.
This paper is divided into six parts: the first part is the introduction, the second part is the literature review, the third part is the blockchain’s concept and theory, the fourth part is the methodology and data, the fifth part is the results and analysis, and the sixth part is the conclusion and recommendations.
2. Literature Review
In 2008, Bitcoin founder Nakamoto [3] outlined the electronic Bitcoin with peer-to-peer characteristics in his paper. Swan [4] believes that blockchain is an open, transparent, and decentralized database technology. Since 2016, the application of blockchain in the energy field has gradually expanded [5–7]. In addition to electricity trading, Scholars also proposed the application of blockchain to carbon trading [8–12]. In practical applications beyond scientific research, the most representative application is that the Transactive Grid in the United States has successfully used the blockchain transaction model to provide electricity to some consumers in New York through the clean energy microgrid. Subsequently, the city of Busselton in Western Australia also introduced blockchain technology for the trial operation of solar photovoltaic power trading. Meanwhile, blockchain technology will also extend to the environmental field, and it will become increasingly mature in the fields of renewable energy power generation, carbon emission reduction, and sustainable innovation [13]. Therefore, the application of blockchain technology and its function development (such as smart contracts) in the energy and environmental fields will have an extensive market in the near future [14–16].
However, many scholars have done research on the problems that may arise in the process of blockchain application. The first is the energy consumption of the blockchain. There have been some quantitative studies on the energy consumption of cryptocurrency mining. Krause and Tolaymat [17] found that from 2016.1.1 to 2018.6.30, mining 1 USD worth of cryptocurrency Mining a unit of bitcoin consumes more energy than mining minerals of equal amounts. In the scenario model based on the hash rate proposed by Zade et al. [18], the future power demand of the Ethereum network is similar to that of Bitcoin, that by 2025, the mining power demand of the Bitcoin blockchain will be about 8GW. Kufeoglu and Ozkuran [19] used 160 GB Bitcoin blockchain data to estimate Bitcoin mining energy consumption and power demand from 2009 to 2018 and found that starting from 2017.12.18, the highest demand for Bitcoin mining power consumption is between Finland (About 16 GW) and Denmark (about 14 GW). De Vries [20] used a market dynamics approach to evaluate the historical power consumption of Bitcoin mining by market behaviors. The result shows that the Bitcoin network has consumed 87.1 TWh of power annually, equaling a country like Belgium from 2019.
The second is the environmental impact of the application of blockchain technology. Although new digital infrastructure enhances ecological total factor productivity [21], its technological application process also leads to environmental issues, with Bitcoin’s application technology being a typical example. As early as 2012, Loviscach [22] proposed two basic aspects that need to be considered: (1) energy consumption by computing, networking, and cooling processes and (2) disposal of the generated electronic waste. Scholars have used different methods to estimate the annual power consumption and carbon footprint of Bitcoin mining [23, 24]. Schinckus et al. [25] found that the more frequent cryptocurrency activities, the higher the energy consumption, which further affects the environment. In addition, Goodkind et al. [26] estimate that the damage to human health and climate caused by Bitcoin represents almost half of the financial value of every dollar of Bitcoin created. Zhang et al. [27] have investigated the environmental implications of cryptocurrency with the Granger causality test, cross-quantilograms, and dynamic connectedness approaches, suggesting that hash rate is the major influence on Bitcoin electricity consumption and climate change, which emphasizes the importance of decarbonization of cryptocurrency ecosystem. Mohsin et al. [28] investigated the empirical impact of crypto-volume, GDP, energy use, and environmental impact of the top 20 crypto-trader countries using the Kuznets Curve, panel regression, and vector error correction model (VECM), which indicated that the current cryptocurrency has a huge aspect impact on the environment. Jan et al. [29] examined the relationship between blockchain technology and the performance of environmental sustainable development goals. Tayebi and Amini [2] also conducted a comprehensive review of the energy, environmental, and human health impacts of cryptocurrencies, highlighting that the current proof-of-work (PoW) mechanism requires further optimization to meet the demands of environmental sustainability.
Since its inception with Bitcoin, blockchain technology has transitioned from a peer-to-peer electronic cash system into a pivotal instrument with significant applications in the energy and environmental sectors. The continuous advancement and innovation of blockchain functionalities, particularly smart contracts, underscore its potential to profoundly influence the dynamics of future energy and environmental markets. However, despite its extensive application prospects, existing research has revealed critical challenges associated with blockchain technology, notably its substantial energy consumption and the environmental burdens arising from cryptocurrency mining, including high energy demands and electronic waste generation. Moreover, current scholarly investigations remain insufficient in comprehensively evaluating the long-term environmental impacts of blockchain technology applications.
Although previous studies have explored blockchain’s energy consumption and environmental impact, this study introduces key innovations. First, it employs the EEIO model to assess blockchain-driven electricity demand across multiple environmental factors beyond just energy use or carbon emissions. Second, unlike prior research focused on Bitcoin, this study analyzes Ethereum’s and Monero’s resource consumption, highlighting their impacts on freshwater use, greenhouse gas emissions, and PM2.5 pollution. Third, by integrating cryptocurrency hash rate trends and hardware efficiency improvements, it develops a scenario-based framework for a more comprehensive evaluation of blockchain’s cross-sectoral environmental footprint.
3. Blockchain’s Concept and Theory
In a narrow sense, blockchain is not only a kind of chain data structure that connects and combines data blocks in time sequence but also a kind of distributed ledger that cannot be tampered with and forged by cryptography. In a broad sense, blockchain technology is a new distributed infrastructure and computing paradigm in the use of blockchain data structure to verify and store data, distributed node consensus algorithm to generate and update data, cryptography to ensure data transmission and access security, Smart Contract composed of automated script code to program and operate data.
From the perspective of network structure, blockchain is a P2P network technology (Figure 1a), different from the centralized network model (Figure 1b). The computer status of each node in the blockchain is equal, and each node has the same network power where there is no centralized server. All nodes are interconnected and share part of computing resources, software, or information content through specific software protocols.
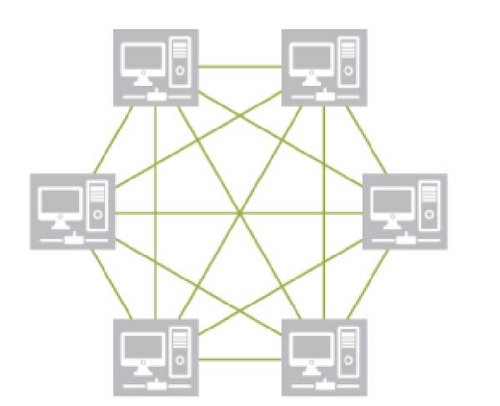

From the point of view of the data encryption algorithm, blockchain adopts an asymmetric encryption algorithm, using public and private keys to encrypt and decrypt data storage and transmission. The public key can be published publicly for the sender to encrypt the information to be sent, while the private key can be used for the receiver to decrypt the received encrypted content. The commonly used asymmetric encryption algorithms are the RSA algorithm and the ECC algorithm. Blockchain uses asymmetric encryption of public and private keys to build trust between nodes, as shown.
As far as data storage technology is concerned, traditional relational databases and distributed key-value databases are used in the construction of blockchain systems. Relational databases can store real-world objects and their associations with simple two-dimensional tables (that is, the SQL language), which have been widely used in various systems and applications. Distributed key-value database is a distributed database system based on key-value pairs, which are generated by massive data of the Internet worldwide.
From blockchain credit verification, each node of the blockchain system selects nodes with the right of package transactions through a certain consensus mechanism. The chosen node needs to package the hashing value, current time stamp, valid transaction and Merkel tree root value of the previous block into a block while broadcasting to the whole network. Since each block and its preceding block are linked together by means of cryptographic proof, it is necessary to reconstruct the transaction records and cryptographic proof of all blocks before the transaction content is modified in the historical block when the blockchain reaches a certain length, which effectively prevents tampering.
4. Methodology and Data
4.1. Environment Expanded Input–Output Model
In Formula (1), x denotes the total output vector in the input–output table, Z represents the intermediate matrix, and y shows the final demand vector (in this study, y refers to the electricity consumed by the application of blockchain), and I is the unit matrix. In the formula, lower-case letters represent vectors, upper-case letters represent matrices, ’ represents the transposition of vectors, and ^ represents diagonal matrices.
Formula (1) is derived from Rodrigues et al. [30]. In Formula (1), expresses the intensity of resource consumption or environmental emission of each sector; the matrix is the Leontief inverse matrix in the input–output model. Formula (1) explains the relationship between final demand and resource consumption as well as environmental emissions from the perspective of final demand. Whether from the producer’s or consumer’s point of view, the total value of resource consumption or environmental emissions of each sector is unchanged, that is, , where i stands for all sectors. Through the above methods, it can be calculated how much resource consumption and environmental emissions will be caused by the electricity consumed by the blockchain application in various sectors.
4.2. Electricity Consumption of Blockchain Application
(1) Impact Factors
According to previous scholars’ research, the energy consumption of the mining of cryptocurrencies and the application of blockchain is related to the following factors: ① The kind of cryptocurrencies. The mining of different coins consumes different amounts of electricity. ② Consensus mechanism. Currently, the consensus mechanism of PoW and PoW/PoS hybrid schemes are mostly used by cryptocurrencies. For instance, Bitcoin uses the hashcash PoW as the mining core for block generation [31]. All the calculations of PoW and PoW/PoS hybrid schemes include mining the coins and maintaining the system, which needs to be completed by electronic devices and electricity [32]. ③ Algorithms and Hashrate. Most coins can be mined with one algorithm, but some with many hashing algorithms [32]. In order to enhance the network security of the consensus mechanism, many schemes such as proof-of-activity (PoW/PoS-hybrid), PoW, proof-of-validation (PoV), and proof-of-capacity (PoC) contain more than one algorithm. The hashing algorithm determines the hashrate, which is the unit of the processing power of the cryptocurrency network per second [32]. The unit varies depending on the coin, usually seen as H/s. The hashrate further determines the mining efficiency [32]. The mining efficiency of a mining device is the ratio of the number of hashes in a second divided by the power consumed [32]. The unit varies depending on the coin, usually seen as J/H. ④ Computer hardware and software. They both affect the mining efficiency. The software contains operating systems (such as Windows 10) and mining software (such as xmr-stak) [32]. The hardware for coin mining includes a central processing unit (CPU), graphics processing unit (GPU), field programable gate arrays (FPGAs), and application-specific integrated circuits (ASICs) [33–35]. As the difficulty of mining increases, the operational costs and power consumption of hardware rise, even exceed the profits from mining [36]. Therefore, miners need to find more powerful and more efficient alternatives. More advanced hardware offers higher hash rates and better energy efficiency [36].
- •
Ethereum Electricity Consumption Index
The data of Ethereum electricity consumption is from Digiconomist7. This website uses the following methods to estimate the total electricity consumption of Ethereum: First, the total mining revenues are calculated and converted into US dollars. Then, it is estimated what parts of mining revenues are being spent on electricity costs. Finally, the electricity consumption of the whole network is obtained by dividing it by the average price8per kilowatt-hour. Currently, Ethereum still relies entirely on the PoW mechanism. In its current state, the Ethereum network consumes nearly as much electricity as the entire Bolivia consumes annually.
- •
Monero Electricity Consumption Index
The data of Monero electricity consumption is from reference 24, which is Energy consumption of cryptocurrency mining: A study of electricity consumption in mining cryptocurrencies by Li et al. This paper uses experimental research methods to measure the power consumption required for Monero mining. The paper concludes that from April to December 2018, China’s Monero mining may consume 30.34 GWh of electricity. This paper converts this to 30.34 GWh and multiplies it by the average electricity price of 0.37387 yuan/kWh to get the value of the electricity consumed by China’s mining Monero from April to December 2018 to be 11,343,215.8 yuan.
(3) Scenario Analysis and Prediction of Electricity Consumption in 2030
- •
Ethereum Electricity Consumption in 2030
It can be seen from Formula (2) that the key to calculating the power demand is to obtain the value of the network hash rate and hardware efficiency. We collected data on the hash rate of the Ethereum network from 2016 to 2020 (the data was calculated to the nearest month) and fitted it with logarithmic and linear conditions, as shown in Figure 2a; at the same time, we collected Ether from 2012 to 2020. Hardware efficiency data (data are included to the year), which are fitted exponentially and linearly, as shown in Figure 2b.
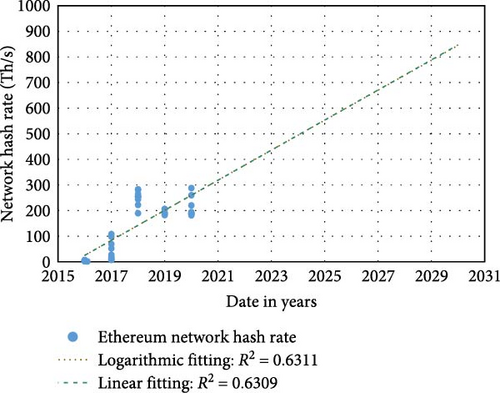
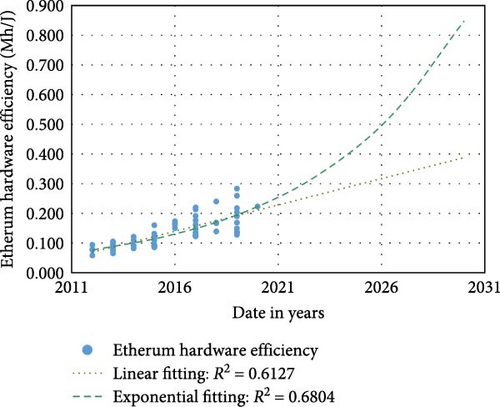
According to the above fitting situation, four combination scenarios are set: ① Network hash rate is logarithmic fitting, and hardware efficiency is exponential fitting; ② Network hash rate is linear fitting and hardware efficiency is exponential fitting; ③ Network hash rate is logarithmic fitting and hardware efficiency is linear fitting; ④ Network hash rate is linear fitting and hardware efficiency is linear fitting. Calculate the total annual electricity demand of Ether from 2016 to 2030 under the four combined scenarios by Formulas (2) and (3), as shown in Figure 3.

Furthermore, according to data from the Ethereum website11, in January 2019, there were 9871 active Ethereum nodes in the world, of which China accounted for 15.83%. Therefore, this article uses 15.98% as the proportion of China’s mining of Ethereum and calculates China’s annual electricity demand (CE) by using Formula (4); then multiplying it by the average price of electricity p = 0.98614 yuan/kW.h to get the ether The value of annual power consumption V. From this, under the four combined scenarios, the predicted value of China’s Ethereum annual electricity demand CE and electricity value V in 2030, as shown in Table 1.
| Scenarios | E (kW.h) | CE (kW.h) | V (yuan) |
|---|---|---|---|
| ① Net12 = logarithmic fitting Eff13 = exponential | 7,027,701,117 | 1,123,026,638.4966 | 1,107,461,489.29 = 11.07×10⁸ |
| ② Net = linear Eff = exponential | 8,490,699,176 | 1,349,172,099.0664 | 1,330,472,573.77 = 13.30×10⁸ |
| ③ Net = logistic Eff = linear | 15,395,315,452 | 2,460,171,409.2296 | 2,426,073,433.5 = 24.26×10⁸ |
| ④ Net = linear Eff = linear | 18,600,249,220 | 2,972,319,825.356 | 2,931,123,472.58 = 29.31×10⁸ |
- •
Monero Electricity Consumption in 2030
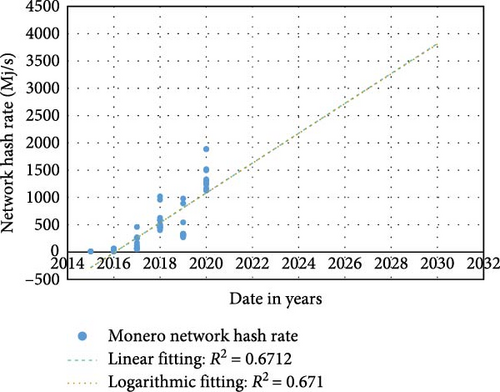
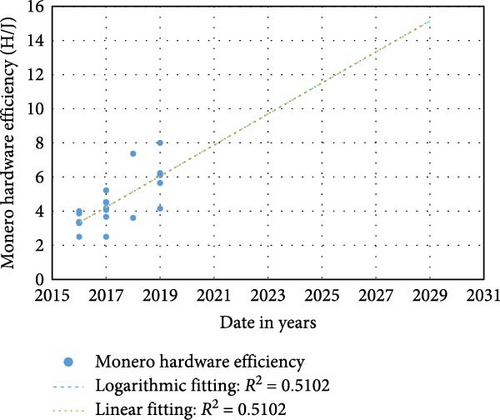
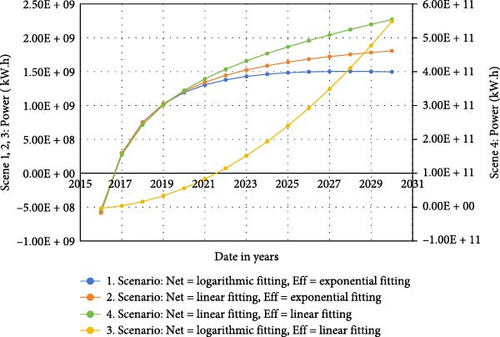
In the same way, we collected the Monero network hash rate data from 2015 to 2020 (the data are included to the nearest month) and fitted it with linear and logarithmic conditions, as shown in Figure 4a; at the same time, we collected 2016–2019 Monero hardware efficiency data (data are included to the nearest month) are fitted to the logarithmic and linear cases, as shown in Figure 4b. Then, the same is done with four cross-combination scenarios; the total annual electricity demand of Monero from 2016 to 2030 under different scenarios is calculated by Formulas (2) and (3), as shown in Figure 5. Further, Formula (4) obtains the predicted value of China’s Monero currency annual electricity demand CE and electricity value V in 2030, as shown in Table 2.
| Scenarios | E (kW.h) | CE (kW.h) | V (yuan) |
|---|---|---|---|
| ① Net = logarithmic fitting Eff = exponential | 1,497,211,233 | 239,254,355.0334 | 235,938,289.67 = 23.59×10⁷ |
| ② Net = linear Eff = exponential | 1,807,456,306 | 288,831,517.7 | 284,828,312.86 = 28.48×10⁷ |
| ③ Net = logistic Eff = linear | 2,270,053,239 | 362,754,507.59 | 357,726,730.12 = 35.77×10⁷ |
| ④ Net = linear Eff = linear | 548,435,212,091.71 | 87,639,946,892.26 | 86,425,257,228.33 = 86.43×10⁹ |
5. Results and Analysis
5.1. Comparison of the Current Environmental Impacts of Ethereum and Monero
Based on the above data and methods, it can be calculated that the amount of electricity consumed by blockchain applications will cause resource consumption and environmental emissions in various industries, including freshwater, PM2.5, GHG emissions, atmospheric Hg, and solid waste. The results are shown in Figures 6–10.
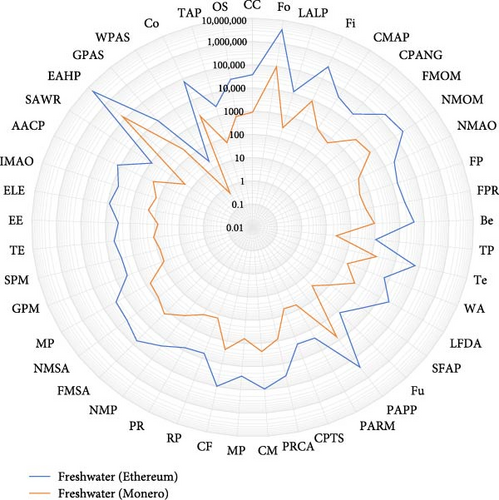
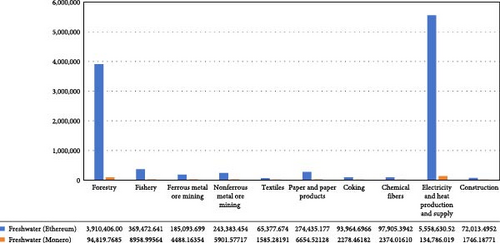
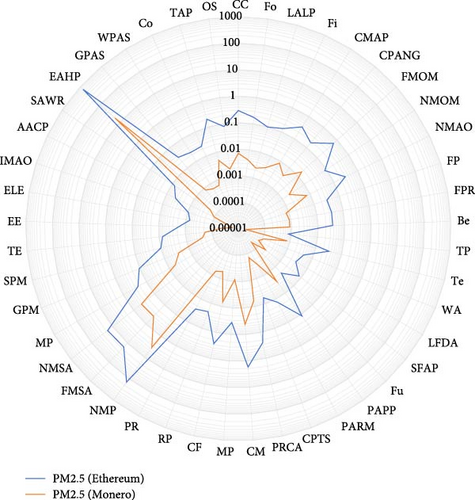
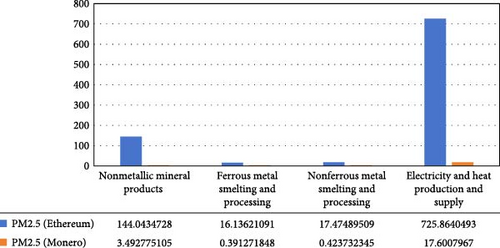
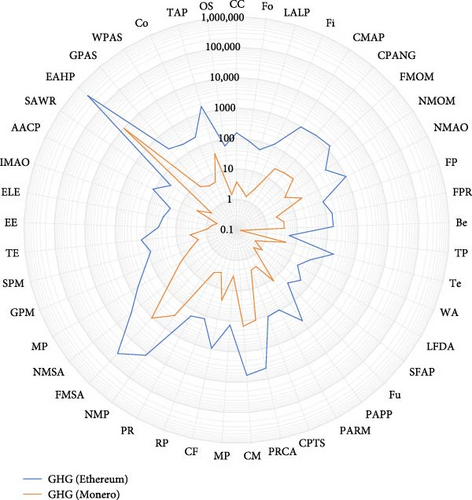
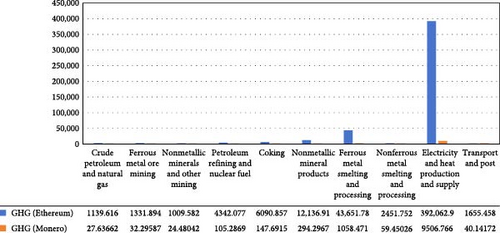
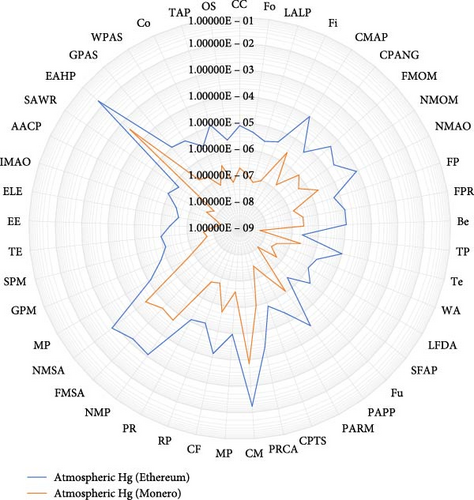
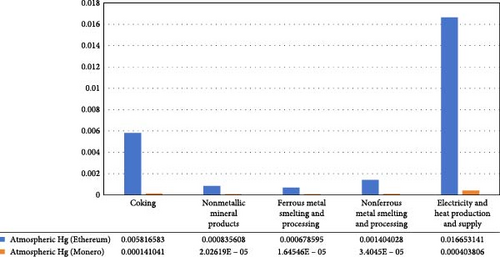
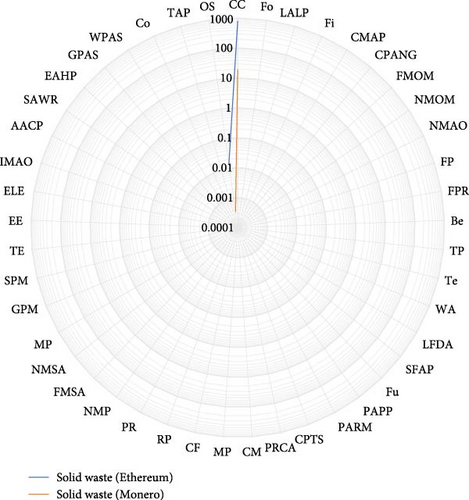
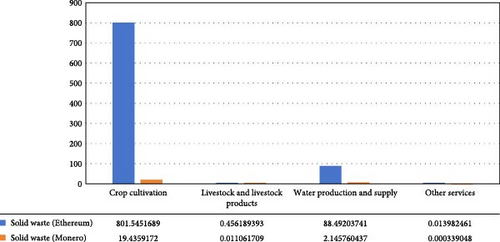
As shown in Figures 6–10, the power consumption of Ethereum technology in the two blockchain applications has a significantly greater impact on various industries compared to Monero technology. The chain reaction of other industries in China, driven by the power consumption of blockchain applications, is primarily concentrated in the consumption of freshwater resources. For example, the electricity and heat production sector accounts for 5,558,630.525 tons, followed by forestry (3,910,406.008 tons), fishery (369,472.642 tons), and paper and paper products (274,435.177 tons), as shown in Figure 6b.
In specific industries, Ethereum also impacts PM2.5 emissions (e.g., electricity and heat production and supply: 725.864 tons; nonmetallic mineral products: 144.043 tons, shown in Figure 7b and solid waste emissions (e.g., crop cultivation: 801.545 tons; freshwater production and supply: 88.492 tons, shown in Figure 10b. The impact on greenhouse gas emissions is also significant, with major contributions from electricity and heat production and supply (392,062.944 tons), ferrous metal smelting and processing (43,651.784 tons), nonmetallic mineral products (12,136.916 tons), coking (6,090.857 tons), and petroleum refining and nuclear fuel (4342.077 tons), as shown in Figure 8b.
However, the impact on atmospheric Hg emissions is minimal, with only small emissions from electricity and heat production and supply (0.017 kg), coking (0.006 kg), and nonferrous metal smelting and processing (0.001 kg), as shown in Figure 9b. Additionally, solid waste emissions in industries other than the ones mentioned are not prominent, approaching zero.
5.2. Forecast of the Future Environmental Impact of Ethereum and Monero
- •
Environmental Impact of Ethereum-Electricity-Consumption in 2030
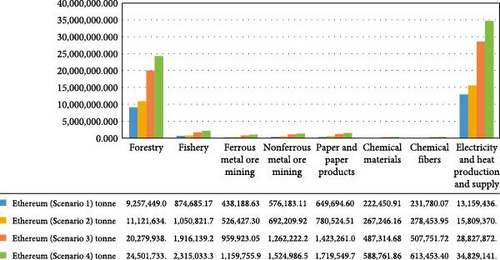
The impact of Ethereum technology on the consumption of freshwater resources is illustrated in Figure 11. Figure 11a compares different scenarios, showing that Scenario 4 (Net = linear, Eff = linear) results in the highest consumption, followed by Scenario 3 (Net = logistic, Eff = linear), Scenario 2 (Net = linear, Eff = exponential), and Scenario 1 (Net = logistic, Eff = exponential). As shown in Figure 11b, the electricity and heat production sector exhibits the highest freshwater consumption, with 34,829,141.23 tons in Scenario 4 and 28,827,872.67 tons in Scenario 3. The forestry sector follows, consuming 24,501,733.38 tons in Scenario 4 and 20,279,938.73 tons in Scenario 3. It can be seen that when the hash rate is linearly fitted, and the hardware efficiency is also linearly fitted, the power consumption of the Ethereum technology is the largest, and the consumption of freshwater resources is also the largest.
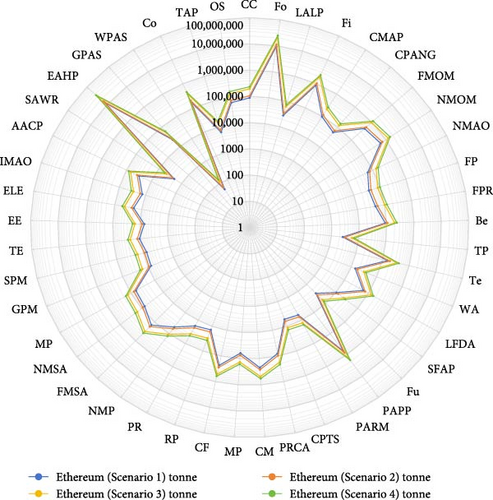
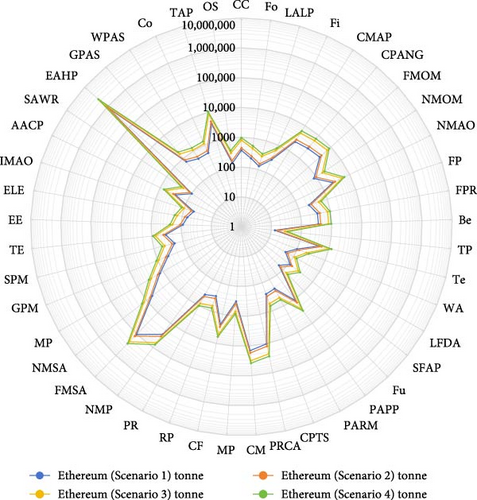
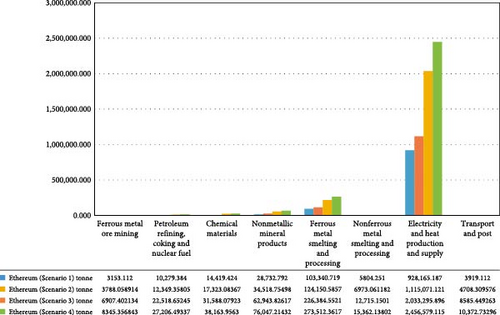
The impact of Ethereum technology on greenhouse gas emissions is illustrated in Figure 12. Figure 12a compares different scenarios, showing that Scenario 4 (Net = linear, Eff = linear) results in the highest emissions, followed by Scenario 3 (Net = logistic, Eff = linear), Scenario 2 (Net = linear, Eff = exponential), and Scenario 1 (Net = logistic, Eff = exponential). As shown in Figure 12b, the electricity and heat production sector contributes the highest emissions, with 2,456,579.11 tons under Scenario 4, followed by 2,033,295.90 tons in Scenario 3, 1,115,071.12 tons in Scenario 2, and 928,165.19 tons in Scenario 1. The ferrous metal smelting and processing sector also generates significant emissions, with 273,512.36 tons in Scenario 4, 226,384.55 tons in Scenario 3, 124,150.59 tons in Scenario 2, and 103,340.72 tons in Scenario 1. Additionally, the nonmetallic mineral products sector records 76,047.21 tons of emissions in Scenario 4.
The impact of Ethereum technology on PM2.5 emissions is illustrated in Figure 13. Figure 13a compares different scenarios, indicating that Scenario 4 (Net = linear, Eff = linear) results in the highest emissions, followed by Scenario 3 (Net = logistic, Eff = linear), Scenario 2 (Net = linear, Eff = exponential), and Scenario 1 (Net = logistic, Eff = exponential). As shown in Figure 13b, the electricity and heat production sector exhibits the highest PM2.5 emissions under Scenario 4 (4548.10 tons), followed by Scenario 3 (3764.44 tons), Scenario 2 (2064.44 tons), Scenario 1 (1718.40 tons), and another measurement under Scenario 4 (902.54 tons). These findings suggest that when both the hash rate and hardware efficiency follow a linear fitting model, Ethereum technology exhibits the highest power consumption, leading to the greatest PM2.5 emissions.
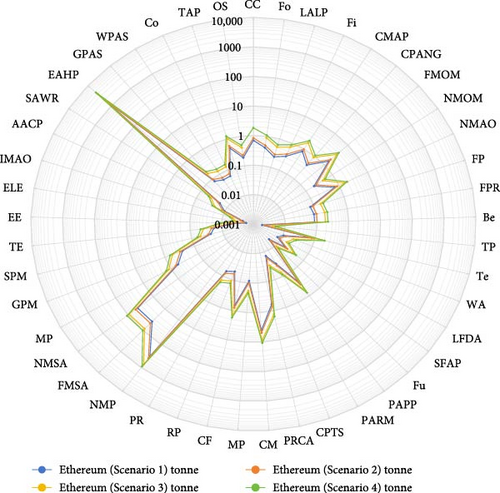
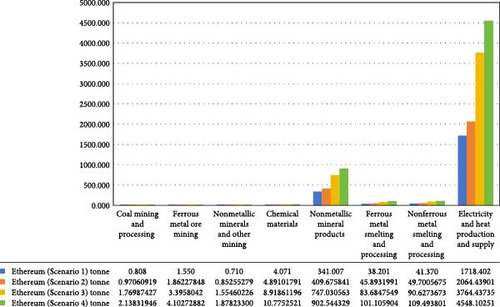
- •
Environmental Impact of Monero-Electricity-Consumption in 2030
The impact of Monero technology on the consumption of freshwater resources is illustrated in Figure 14. Figure 14a compares different scenarios, indicating that Scenario 4 (Net = linear, Eff = linear) results in the highest freshwater consumption, followed by Scenario 1 (Net = logistic, Eff = linear), Scenario 3 (Net = linear, Eff = logistic), and Scenario 2 (Net = logistic, Eff = logistic). As shown in Figure 14b, the electricity and heat production sector exhibits the highest freshwater consumption (1,026,950,082.00 tons in Scenario 4), followed by forestry (722,442,650.40 tons), fishery (68,259,611.43 tons), and paper and paper products (50,701,557.99 tons). It can be seen that when the hash rate is linear fitting, and the hardware efficiency is linear fitting, the Monero coin technology consumes the largest amount of electricity and consumes the largest amount of freshwater resources.
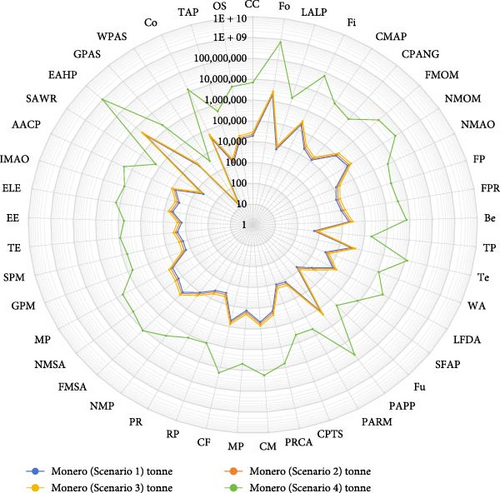
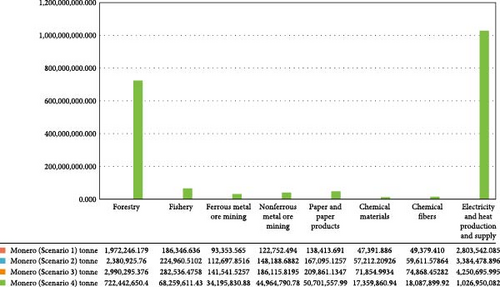
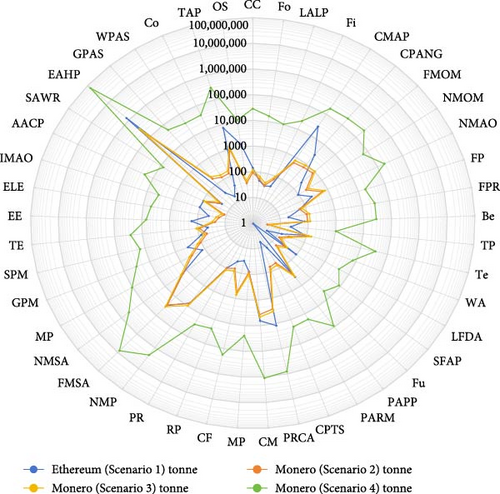
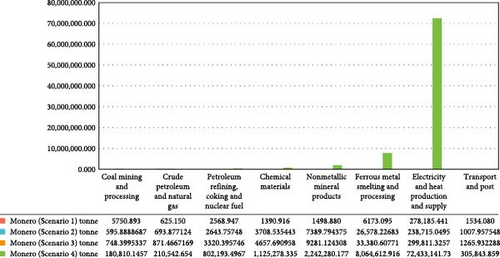
The impact of Monero technology on greenhouse gas emissions is illustrated in Figure 15. Figure 15a compares different scenarios, showing that Scenario 4 (Net = linear, Eff = linear) leads to the highest emissions. Figure 15b presents emissions from different sectors, with electricity and heat production contributing the most (72,433,141.73 tons), followed by ferrous metal smelting and processing (8,064,612.916 tons), coal mining and processing (180,810.1457 tons), petroleum refining, coking, and nuclear fuel (802,193.4967 tons), transport and postal services (305,843.859 tons), nonmetallic mineral products (2,242,280.177 tons), chemical materials (1,125,278.335 tons), and crude petroleum and natural gas (210,542.6548 tons). These results indicate that Monero technology significantly contributes to greenhouse gas emissions, particularly through electricity and heat production. Therefore, improving energy efficiency and exploring alternative energy sources are crucial for reducing its environmental impact.
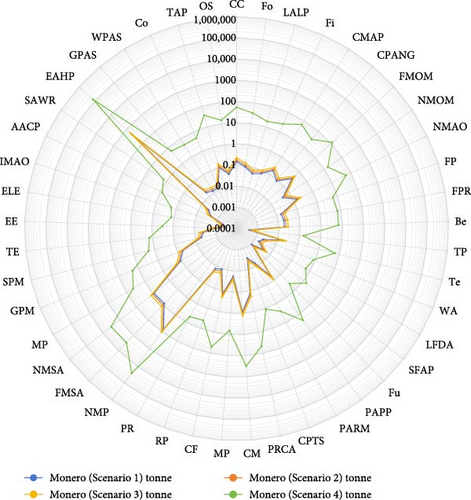
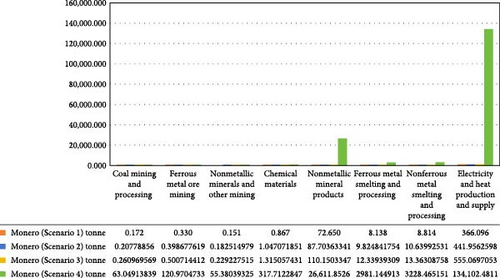
The impact of Monero technology on PM2.5 emissions is shown in Figure 16. In Figure 16a, different scenarios are compared: Scenario 4 (Net = linear, Eff = linear) results in higher emissions than Scenario 3 (Net = linear, Eff = logistic), Scenario 2 (Net = logistic, Eff = logistic), and Scenario 1 (Net = logistic, Eff = linear). The electricity and heat production sector contributes the highest emissions (134,102.4811 tons), followed by nonmetallic mineral products (26,611.8526 tons) and nonferrous metal smelting and processing (3,228.465151 tons), as shown in Figure 16b. Since both the hash rate and hardware efficiency follow a linear fitting model, Monero technology consumes the most electricity. Consequently, it generates the highest greenhouse gas emissions and depletes the most mineral resources. The above fitting situation is only the scenario analysis done in this article, and the future development trend needs to be further studied by integrating the real scenario.
6. Discussion
Blockchain applications will consume a lot of electricity. This part of the electricity consumption will bring corresponding resource consumption and environmental emissions to various industries as above. The reasons are as follows: Due to the relatively abundant coal resources in China, the coal-fired power generation technology is relatively mature. China’s power production structure is still dominated by thermal power. In the first three quarters of 2023, China’s total thermal power generation reached 52798.74545.2 billion kWh, which is about 68.7% of the country’s total power generation. Among them, the cooling process of thermal power generation is the main part of its freshwater consumption, causing the consumption of water resources. At the same time, thermal power generation will also cause a large amount of carbon dioxide emissions. Some power plants have added carbon capture and collection technology to control greenhouse gas emission reduction in coal power production. However, the technology itself not only increases freshwater consumption but also reduces thermal power generation. Production efficiency. In addition, the increase in power consumption caused by blockchain applications may increase the demand for metals, nonmetals, coal, and other mining, and increase the demand for electricity and heat production and supply (electricity and heat production and supply). All these will affect the increase of gaseous mercury emissions, solid waste emissions, and mineral resource consumption in various industries.
According to the scenario analysis results in Part (2), the Ethereum hash rate is a linear fit, the hardware efficiency is also a linear fit (Scenario 4), the Monero hash rate is a linear fit, and the hardware efficiency is a liner fitting (Scenario 4), the power consumption is the largest, which has the largest impact on freshwater, PM2.5, and greenhouse gases. This also echoes the forecast of electricity consumption of Ethereum and Monero in the next 30 years in 4.2. While both Ethereum and Monero have a much higher impact on electricity and heat production and supply, forestry, nonmetallic minerals and other mining than other industries, the environmental emission values under the four scenarios of Ethereum are not much different. Monero is in Scenario 4 (Net = linear, Eff = liner). The following values are particularly prominent, which are related to the fitting methods of Ethereum and Monero in four different scenarios.
7. Conclusions and Recommendations
In recent years, institutions such as the United Nations, the International Monetary Fund, and many developed countries (including the United States, the United Kingdom, Germany, and Canada) have successively released a series of reports on blockchain to explore blockchain technology and its applications. At present, the application fields of blockchain technology have surpassed the fields of finance and securities and are gradually being practiced in the fields of supply chain, social interaction, e-commerce, sharing economy, energy trading, justice, medical care, logistics, and the Internet of Things. At present, The number of transactions handled per second by the Ethereum blockchain is far higher than today’s centralized transaction models and applications such as Taobao and WeChat. In the future, if the blockchain is applied on a large scale and the processing speed of the system increases, it will consume a lot of energy.
According to the formula of power consumption, the greater the network hash rate, the greater the power consumption, the higher the hardware efficiency, and the less power consumption. Then, the network hash rate and hardware efficiency are set up to predict the power consumption between 2020 and 2030. And its impact on resource consumption and environmental emissions. The results show that the impact of Monero technology on the environment is higher than that of Ethereum. It will contribute to electricity and heat production and supply (freshwater resource consumption and greenhouse gas emissions), forestry (freshwater resource consumption), nonmetallic minerals and other mining (consumption of mineral resources), and other industries that have a greater impact. The reason is related to China’s power production structure and economic structure. But what is certain is that the massive energy consumption caused by the blockchain does create a new burden on natural resources and the environment. Therefore, improving transaction efficiency and reducing energy consumption are the keys to the large-scale application and sustainable development of blockchain. In view of the energy consumption and environmental impact of the blockchain, this article proposes the following policy recommendations from two perspectives: microlevel and macrolevel.
- •
Improve the Blockchain System Architecture
- •
Data Center Specialization
- •
Establish a Distributed Consensus Algorithm
There are many types of consensus algorithms in blockchain technology. Each algorithm has its own unique functions, advantages, and disadvantages, as well as different properties, such as scalability, security, resource consumption, and electricity cost. Optimizing the distributed consensus algorithm helps to process a large number of transactions or blocks in a reasonable time while increasing the number of users or nodes. For example, in 2014, the principal developer of BitShares, Dan Larimer, proposed the entrusted proof-of-stake method, which is the DPoS algorithm. Holders of coins can vote and elect some nodes as representatives to keep accounts. Such an algorithm consumes less energy and completes a high transaction volume per second, which can become the main way of energy-saving development of blockchain in the future.
- •
Establish a Relevant Platform for Blockchain Energy Consumption Research
- •
Establish a Clean and Distributed Power Supply System
- •
Relax the Relevant Regulations of the Relevant Energy Sector
Currently, the implementation of most energy projects in China requires policy approval; otherwise, the company must exchange qualifications, licenses, etc., to promote the project. As an important catalyst for the energy industry, blockchain companies should not be restricted by too many acquisition and licensing rules. China should introduce new laws to institutionally support the application of blockchain and supervise the energy consumption of blockchain.
At present, academic circles, industrial circles, and technology communities are committed to continuing to study and improve blockchain technology. Many high-efficiency (high performance, high throughput, low power consumption, high scalability) blockchain projects have been carried out in the world. Zilliqa in Singapore, for example, makes a commitment to achieve scalable and high throughput public blockchain platforms that support thousands of transactions per second. The team of Sun Yi, a researcher at the Institute of Computing, Chinese Academy of Sciences, also launched a high-throughput blockchain research project in the spring of 201815. In the future, the premise and key to realize the large-scale application of blockchain is to build the infrastructure and platform of high-efficiency blockchain, positively lay out the research and development of new terminals, innovate smart supervision, cultivate interdisciplinary talents, and formulate smart contracts.
Conflicts of Interest
The authors declare no conflicts of interest.
Funding
This paper is supported by the National Natural Science Foundation of China (Grant Nos. 42171278, 71991481, and 71991480), the Fundamental Research Funds for the Central Universities (Seek-Truth Scholar) (3-7-9-2024-10) (coupling and synergy optimization of low carbon policy mix in the power industry under “Double-carbon goals”).
Acknowledgments
This paper is supported by the National Natural Science Foundation of China (Grant Nos. 42171278, 71991481, and 71991480), the Fundamental Research Funds for the Central Universities (Seek-Truth Scholar) (3-7-9-2024-10) (Coupling and synergy optimization of low carbon policy mix in the power industry under “Double-carbon goals”).
Endnotes
Appendix A
| Sectors | Abbreviations |
|---|---|
| Crop cultivation | CC |
| Forestry | Fo |
| Livestock and livestock products | LALP |
| Fishery | Fi |
| Coal mining and processing | CMAP |
| Crude petroleum and natural gas | CPANG |
| Ferrous metal ore mining | FMOM |
| Nonferrous metal ore mining | NMOM |
| Nonmetallic minerals and other mining | NMAO |
| Food processing | FP |
| Food production | FPR |
| Beverages | Be |
| Tobacco products | TP |
| Textiles | Te |
| Wearing apparel | WA |
| Leather, furs, down, and related products | LFDA |
| Sawmills, fiberboard, and products of wood, bamboo, cane, palm, straw, etc. | SFAP |
| Furniture | Fu |
| Paper and paper products | PAPP |
| Printing and record medium reproduction | PARM |
| Cultural products, toys, sporting and athletic, and recreational products | CPTS |
| Petroleum refining and nuclear fuel | PRCA |
| Coking | CM |
| Chemical materials | MP |
| Chemical fibers | CF |
| Rubber products | RP |
| Plastic products | PR |
| Nonmetallic mineral products | NMP |
| Ferrous metal smelting and processing | FMSA |
| Nonferrous metal smelting and processing | NMSA |
| Metal products | MP |
| General purpose machinery | GPM |
| Special purpose machinery | SPM |
| Transport equipment | TE |
| Electrical equipment | EE |
| Electronic equipment | ELE |
| Instruments, meters, and other measuring equipment | IMAO |
| Arts and crafts products and other manufacturing products | AACP |
| Scrap and waste recycling | SAWR |
| Electricity and heat production and supply | EAHP |
| Gas production and supply | GPAS |
| Water production and supply | WPAS |
| Construction | Co |
| Transport and post | TAP |
| Other services | OS |
Open Research
Data Availability Statement
The data that support the findings of this study are included within the article, and the supporting information are also available from the corresponding author upon reasonable request.
- 1Cambridge Centre for Alternative Finance (CCAF). (n.d.). Cambridge Bitcoin Electricity Consumption Index. Cambridge Centre for Alternative Finance. https://ccaf.io/cbnsi/cbeci.
- 2For example: The backup verification and encryption mechanism of an ordinary central ledger is different in that if there are 100 million transactions that need to be processed, it may account for 200 million times or 1 billion times, while in a blockchain system with 500 million users, those transactions need to be accounted for 50,000,000,000,000,000 times.
- 3Ethereum is an open-source public blockchain platform with Smart Contract that deals with peer-to-peer contracts using its dedicated cryptocurrency-Ether to provide a decentralized Ethereum Virtual Machine. Bitcoin is the product of Blockchain 1.0, used to complete currency and payment transactions, while Ether is a product of Blockchain 2.0, used for recording and transferring complex types of assets. In the future, Blockchain 3.0 will extend beyond the monetary, financial, and business fields to the political, social, educational, medical, and other aspects of our lives. Ethereum offers an internal Ethereum Virtual Machine (EVM) code for users to construct Smart Contract or transactions that can be precisely defined.
- 4According to the availability and importance of data, freshwater, PM2.5, carbon dioxide emission, atmospheric Hg, and solid wastes were selected as the analysis objects.
- 5CEEIO website: http://www.ceeio.com/.
- 6Embodied Resource Consumption/Environmental Emission: It refers to the consumption of certain resources and environmental emissions by various sectors caused by consumer consumption.
- 7Digiconomist. (n.d.). Ethereum energy consumption index. Digiconomist. https://digiconomist.net/ethereum-energy-consumption
- 8In the calculation, an average of 10 cents per kilowatt-hour is set for the miners in Ethereum.
- 9Due to the real-time updates of the data on the digiconomist.net website, there is a slight difference between the data in June and the data in April on this website (the data used in this article). In January 2019, according to https://www.ethereum.org, there were 9971 active nodes of Ethereum in the world, 40.89% in the United States, 15.83% in China, 7.12% in Canada, 4.35% in Germany and 3.27% in Russia. In this paper, 15.98% is used as the proportion of exploitation of Ethereum in China.
- 10The average feed-in tariff of Chinese power producers in 2018 was 0.37387RMB/KWh. https://www.nea.gov.cn/138530255_15729388881531n.pdf.
- 11Ethereum Foundation. (n.d.). Home. Ethereum. https://www.ethereum.org.
- 12The abbreviation for Net is Network hash rate.
- 13The abbreviation for Eff is hardware efficiency rate.
- 14See Appendix I for details of the abbreviated names of the industries.
- 15Website: https://www.idcbest.com/idcnews/11002016.html.


