Determination of Minimum Miscible Pressure and Phase Behavior of CO2–Shale Oil in Nanopores
Abstract
CO2 injection into shale oil reservoirs has gained widespread attention as it not only enhances oil recovery but also facilitates the geological storage of CO2. Shale oil reservoirs are characterized by numerous nanopores, and the resident fluid exhibits unique phase behavior due to nanoconfinement effects, resulting in the failure of the traditional theoretical model and microfluidic experiment in depicting the minimum miscible pressure (MMP) of CO2–shale oil in nanopores. This study proposes a method for calculating the MMP of CO2–shale oil in nanopores. It combines the three-phase equilibrium calculation method of gas phase–liquid phase–adsorbed phase with the multiple mixing cell (MMC) method. The method considers capillary pressure and corrects the critical properties influenced by the nano-limited domain effect. Using this approach, the phase behavior of CO2–shale oil in nanopores and the MMP are investigated. It is found that as the pore radius decreases, the area of the two-phase region surrounded by the phase envelope of multicomponent fluids gradually shrinks. The smaller the pore radius, the more significant the shrinkage of the two-phase region. The entire phase envelope and the critical point shift to the left and down on the coordinates, and this phenomenon is more pronounced for pore radii less than 20 nm. The presence of CO2 increases the system’s critical condensation pressure and decreases the critical condensation temperature. The MMP of the 6-component system of CO2–shale oil for a pore radius of 5 nm in this paper is 63.7 bar at 101°C.
1. Introduction
Geological utilization of CO2 presents an effective strategy for mitigating CO2 emissions and advancing carbon capture, utilization, and storage (CCUS) initiatives [1–3]. In recent years, CO2-enhanced oil recovery (EOR) [4] has gained widespread application in unconventional reservoirs like shale oil and gas [5–7]. CO2 injection not only enhances the energy yield in shale reservoirs but also facilitates efficient CO2 storage within them [8]. Shale oil reservoirs are characterized by nanopores ranging from a few nanometers to hundreds of nanometers [9], exhibiting complex pore structures and challenging physical conditions [10]. These characteristics introduce uncertainty into the phase behavior of reservoir fluids [11–13], presenting a unique challenge for CO2-EOR. Accurately understanding and analyzing the minimum miscible pressure (MMP) [14–16] of CO2-hydrocarbons within nanopores is crucial for the success of both CCUS and CO2-EOR.
Shale reservoirs are primarily developed using CO2-EOR [5, 17, 18], which effectively utilizes shale oil in nanopores due to CO2’s unique physical properties. The mechanisms of CO2-EOR include supplementing formation energy, reducing crude oil viscosity, and extracting lightweight components, dissolution and swelling, and easy miscibility with crude oil [19–21]. Among these, forming a miscible drive is the most efficient means of CO2-EOR, making it crucial to determine whether the system is miscible. The basis for determining a miscible system is when the interfacial tension between injected CO2 and crude oil approaches zero, causing the phase interface to disappear and achieving a miscible state. The pressure corresponding to this state is the MMP. MMP is the most observable parameter for judging the miscible condition during CO2 injection [22]. The method for determining MMP usually involves experiments and numerical calculations. Slim tube tests are the most common and accurate means to determine MMP. However, the inner diameters of tubes used in conventional slim tube tests are not at the nanometer scale, making them unable to accurately characterize the MMP of CO2–shale oil in nanopores. In nanopores, CO2 and shale oil are subjected to the nanoconfinement, altering the critical properties of each component and shifting the MMPs. Currently, scholars predict MMP in nanopores using micro- and nano-fluidic techniques, molecular dynamics simulation (MDS), and theoretical calculations.
Microfluidics was initially widely used in life sciences and chemical engineering. Recently, it has been developed in the oil and gas industry, particularly in probing the phase behavior of oil and gas. Wang et al. [23] investigated the effect of adsorption on the MMP of CO2–oil. They found that, at a pore size of 5 nm, the MMP of the ternary mixture (methane, n-butane, and n-decane) was 27.8% lower than under bulk phase conditions. Pan et al. [24] utilized fluorescence and bright-field imaging techniques to characterize the miscible process of CO2–oil. They determined the MMP of CO2 with seven single-component alkanes and multicomponent mixtures within a 30-nm pore size at 70°C. Bo et al. [25] investigated the MMP of CO2-decane at both bulk (5 μm) and nanoscale (50 nm), with experimental results aligning well with literature data and theoretical predictions.
The microfluidics method is currently limited by its inability to reproduce the actual formation environment, high experimental costs, and harsh conditions. Consequently, the MDS method is also used to predict the MMP. Peng et al. [26] used MDS to study the effects of injected gas fraction, oil fraction, and reservoir temperature on the MMP. The results indicate that heavy components increase the MMP, while light components decrease it. Higher temperatures raise the MMP of CO2–oil. Wang et al. [27] investigated the miscibility behavior of different gases (CO2, N2, CH4, C3H8) and various crude oils under conditions of 413 K and 60 MPa. They examined the effects of gas type, crude oil polarity, and chain length on the gas-crude oil miscibility process. Additionally, Wang, Zhu, and Li [28] studied the effects of various surfactants, temperature, and pressure on CO2–oil interfacial tension using MDS.
MDS also has significant drawbacks for calculating MMP. The models built by MDS are generally small, mostly around 10–30 nm, and the modeling time is long, making the results unsuitable for mine-scale studies. This problem can be addressed with equation of state (EOS) calculations. Ahmadi and Johns [29] proposed a multimixed unit cell method for calculating MMP that is both simple and accurate. Teklu et al. [30] modified the Peng-Robinson EOS (PR-EOS) by coupling capillary pressure and critical point displacement during phase equilibrium, using it for multiple mixing cell (MMC) calculations. They observed a significant reduction in MMP at a pore radius of 4 nm due to confined domain effects. Sun and Li [31] developed an improved MMP calculation algorithm that considers pore size distribution, capillary action, and confinement effects. This algorithm also employs a volume-shifted PR-EOS for more accurate phase density predictions. Zhang et al. [32] introduced a new interfacial-thickness-based method for determining the MMP of the CO2–oil system in both the bulk phase and nanopores. Yang and Li [33] presented a correlation between the changes in critical temperature and pressure with nanopore dimensions and used this correlation to correct the PR-EOS.
All the existing methods for studying the CO2–shale oil MMP within nanopores have deficiencies. Most scholars apply traditional phase equilibrium calculations, which do not account for the adsorption phase and neglect the effect of component changes during the phase equilibrium of the adsorption phase. This work aims to investigate the MMP of CO2–shale oil in nanopores. A new integrated thermodynamic model of oil phase–gas phase–adsorbed phase equilibrium is developed using the classical MMC algorithm during phase equilibrium calculations. This model can more accurately predict the MMP of CO2–shale oil in nanopores, considering critical property shifts and capillary force. In this work, the role of CO2 in the miscible process is explored through theoretical calculations. The effects of pore size and component composition on the phase behavior and MMP of CO2–shale oil in nanopores are also investigated.
2. Methods
2.1. Mathematical Model of Phase Equilibrium in Nanopore Fluids
2.1.1. Critical Properties of Fluids in Nanopores
2.1.2. PR-EOS
2.1.3. Capillary Force Calculation in Nanopores
2.1.4. Adsorption Phase Fraction Calculation
2.1.5. Conditions of Three-Phase Phase Equilibrium
2.2. Calculation of Three-Phase Phase Equilibrium
- 1.
It is assumed that initially there is no adsorbed phase in the nanopores, and the fluid is entirely bulk phase fluid. The initial value of the equilibrium constant is estimated using an empirical formula employing Wilson’s method [39]:
- 2.
The phase fraction was calculated by combining the Rachford–Rice equations with Newton’s method of solution:
- 3.
As adsorbed phases gradually form in the system, the following relationship exists between the liquid and vapor phases within the bulk phase:
- 4.
The updated capillary pressure Pc is calculated.
- 5.
The fugacity coefficients for each component and their corresponding phase fractions in the vapor, liquid, and adsorbed phases are calculated:
- 6.
Calculate and update iterative equilibrium constants by fugacity:
- 7.
If the following conditions are met, the molar fraction of the components in each phase is output. Otherwise, steps (2)–(7) are repeated until the calculation results meet the conditions:
2.3. MMC Method for Calculating MMP
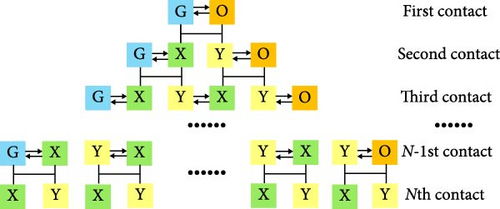
Based on the gas–liquid–adsorbed phase equilibrium calculation method proposed in this paper, the MMP of the CO2–shale oil system is calculated using the multimixed cell method proposed by Ahmadi and Johns. The principle of this method is to consider the initial reservoir fluid as two cells: one gas-filled cell (G) and one crude oil-filled cell (O). These two cells are mixed in a one-to-one ratio, and phase equilibrium calculations at a given temperature and pressure yield a new set of equilibrated gas–liquid compositions. At this stage, the gas–liquid components divide into two new phases: gas phase (Y) and liquid phase (X). This entire process is called the first mixing contact.
Next, the equilibrium Y phase mixes with the O cell, and the equilibrium X phase mixes with the G cell, maintaining the same mixing ratio as the initial one. Through these two-phase equilibrium calculations, a new set of phases is obtained, completing the second mixing contact. This process is repeated until each key tie-line (KTL) sinus is fully developed. The variation curve of the length of the TL with the number of cells generated after each mixing contact is called the TL profile. In the TL profile, each horizontal segment represents a TL, and its length corresponds to the TL length. Increase the pressure and repeat the above steps to obtain two data points. Extrapolate these data points to the y-axis at 0, and then the corresponding pressure is calculated as the first MMP estimate. Next, equalize the pressure corresponding to this point with its closest data point pressure to obtain a new pressure, and use this pressure as the initial pressure for the phase equilibrium calculation. Perform multiple linear regression on the resulting three points and extrapolate the regression line to the y-axis at 0. Repeat this process several times until the error between two consecutive MMP values is less than 1.4 bar. The schematic diagram of the MMC method is shown in Figure 1. The TL length is calculated as follows:
3. Model Validation
Due to the extremely small diameter of the nanopores in shale reservoir, which conventional experimental setups cannot accurately measure and describe, MDSs are used instead of physical experiments to validate the model accuracy. In this paper, the crude oil components are set as methane (CH4), n-butane (C4H10), n-hexane (C6H14), n-octane (C8H18), and n-dodecane (C12H26). The component ratios with CO2 are shown in Table 1.
| Molecule name | CO2 | CH4 | C4H10 | C6H14 | C8H18 | C12H26 |
|---|---|---|---|---|---|---|
| Molar fraction (%) | 20.000 | 26.500 | 16.800 | 13.600 | 11.300 | 11.800 |
| MW (g/mol) | 44.010 | 16.040 | 58.123 | 86.175 | 114.228 | 170.334 |
| Critical pressure, bar (bulk) | 73.820 | 45.990 | 37.460 | 30.900 | 24.910 | 18.200 |
| Critical temperature, K (bulk) | 304.190 | 190.560 | 425.120 | 507.889 | 568.82 | 658.250 |
| Acentric factor | 0.198 | 0.011 | 0.200 | 0.297 | 0.369 | 0.571 |
| Parachor | 82.000 | 74.000 | 190.449 | 270.800 | 350.401 | 509.500 |
- Abbreviation: MW, molecular mass.
In this section, Materials Studio (MS) is used to study the phase behavior of the CO2–shale oil system in nanopores, with the model aperture set to 5 nm. Initially, the “Smart” algorithm is employed to minimize the energy of the pore model with various alkane molecules, obtaining stable configurations to use as initial models for MDSs. Subsequently, the “Amorphous Cell” module places a specific proportion of alkane molecule mixtures in the simulation box of the nanopores, followed by energy minimization of the entire system to create the model used for simulating the phase behavior of the CO2–shale oil in nanopores.
After modeling, stable configurations of the multicomponent system are obtained using the “Forcite” module in MS, and MDSs are performed. The model is initially run under the canonical ensemble (NVT) ensemble with a time step of 1 ns, using the “Nose-Hoover” thermostat to regulate the system temperature and ensure the model system volume reaches equilibrium. The model is then run under the constant-pressure, constant-temperature (NPT) ensemble for 2 ns, again using the “Nose-Hoover” thermostat to regulate the system temperature. The “Ewald” and “Atom-based” methods are used to calculate electrostatic and van der Waals forces. Finally, the simulation data is obtained, and the results are processed.
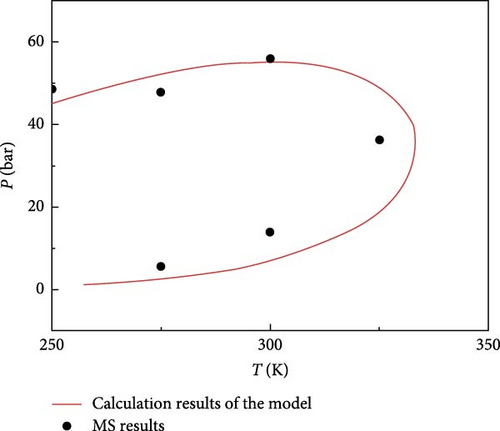
To analyze the phase behavior changes of the CO2–shale oil in nanopores under nanoconfinement and study the influence of different pressures and temperatures on fluid phase behavior in nanopores, the simulation temperature range in this section is set to 250−350 K, and the pressure range is 0–80 bar. The system’s saturation pressure is determined by observing the density change of each CO2–shale oil component under different pressure changes at the same temperature. Subsequently, the phase diagram of CO2–shale oil components in shale reservoirs is drawn.
The phase diagram obtained from molecular simulations is compared with that obtained from the phase equilibrium calculations proposed in this paper. The comparison diagram is shown in Figure 2, demonstrating a small error. This indicates that the phase equilibrium calculation method proposed in this paper has a certain degree of reliability and can be used for further analysis and calculations.
4. Results and Discussion
4.1. Analysis of CO2–Shale Oil Phase Behavior
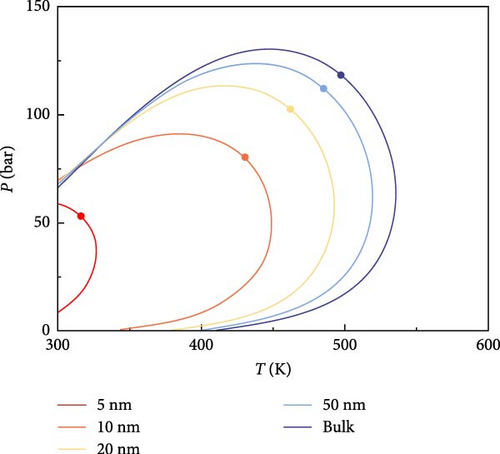
The phase behavior of the fluids consisting of the components listed in Table 1 is analyzed. According to the model proposed in this paper, the P–T phase diagrams of multicomponent fluids with different pore radii (5, 10, 20, 50 nm, and bulk phase) are plotted in Figure 3. As seen in Figure 3, the phase characteristics of the multicomponent fluid in shale oil are significantly affected as the pore radius decreases. The area of the two-phase region, enclosed by the phase envelope, gradually shrinks with smaller pore radii. The smaller the pore radius, the more pronounced the shrinkage of the two-phase region. The phase envelope and the critical point shift to the left on the coordinates, especially when the pore radius is less than 20 nm. The change in phase envelope is not significant when the pore radius is larger than 50 nm.
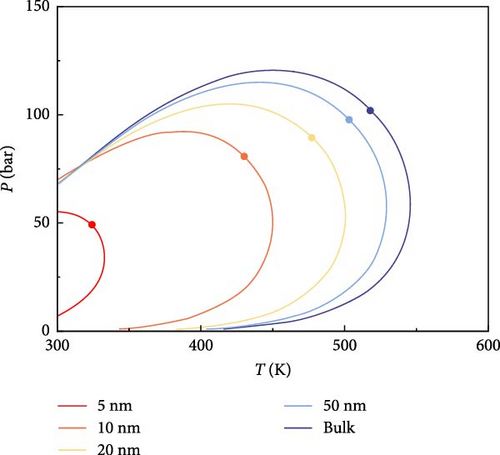
As the pore radius decreases, the influence of nanoconfinement becomes more significant. The proportion of adsorbed phases gradually increases, resulting in a decrease in bubble point and an increase in dew point of the multicomponent fluids at the same temperature. Additionally, the critical condensation pressure (the highest pressure at which two phases coexist) and the critical condensation temperature (the highest temperature at which two phases coexist) decrease.
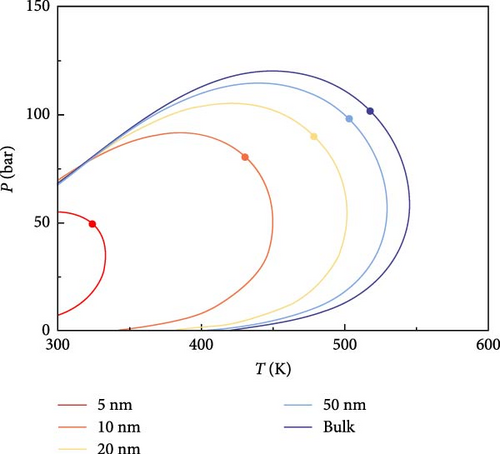
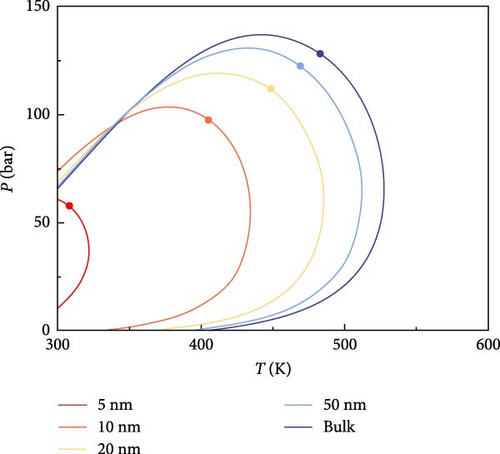
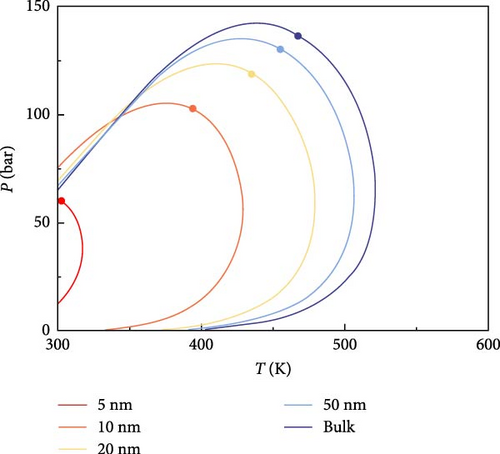
The effect of CO2 on the phase characteristics of multicomponent shale oil was explored by changing the original fluid composition and continuously increasing the molar percentage of CO2. Figure 4 shows the P–T phase diagrams of multicomponent shale oil under different CO2 molar percentages. As shown in Figure 4, the addition of CO2 decreases the critical temperature and increases the critical pressure at the same pore size, shifting the critical point to the upper left in the graph. This indicates that CO2 inhibits the decrease of critical temperature and promotes the increase of critical pressure under the domain-limiting effect. The presence of CO2 increases the critical condensation pressure and decreases the critical condensation temperature of the system, with this effect becoming more pronounced as pore size decreases. Furthermore, with the addition of CO2, the area of the two-phase region enclosed by the phase envelope decreases.
4.2. Analysis of CO2–Shale Oil MMP
The process of calculating the length of the KTL using the multimixed cell method for this 6-component system at 5 nm nanopores and 101°C is shown in Figure 5. This 6-component system has a total of five KTL: an injection gas KTL, a virgin oil KTL, and three cross KTL. By exploring 100, 200, 300, 400, and 500 contacts, the development process and the development patterns of the TLs are observed.
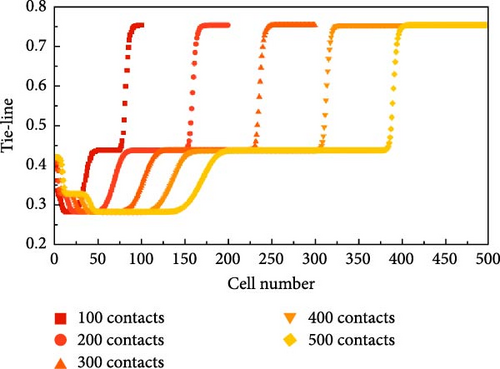
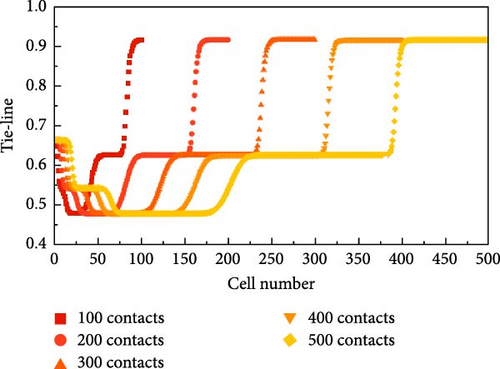
The generation process of the TL is accompanied by an increasing number of contacts. As shown in Figure 5a,b, the trends in the images are nearly the same, but the lengths of the connection lines differ. Figure 5a is taken as an example for detailed analysis here. In Figure 5, the first and second KTLs gradually begin to develop with an increasing number of contacts but are still not fully developed at 200 contacts. However, since their corresponding TL lengths are not minimum at that temperature and pressure, their developmental level has little effect on subsequent MMP probing. The second KTL gradually begins to develop with an increasing number of contacts and is fully developed by 300 contacts. The third key connection also gradually completes its development as the number of contacts increases. It is observed that once the development of the KTL is complete, its length remains constant despite further increases in the number of contacts. Additionally, as pressure increases, the development of the critical junction accelerates, and the number of contacts required for complete development decreases. At 200 contacts, the entire system can be regarded as a “self-sharpening” system, where the surfaces formed between two neighboring KTL are flat. According to the method of characteristics (MOCs) theory, two neighboring KTLs will intersect at a point in space without considering dispersion.
When the length of any KTLs in the system is zero, the corresponding pressure of the system is the MMP. This is predicted by calculating the minimum length of the KTL at a series of different pressures at the same temperature. Figure 6 shows the pressure path diagram of MMP in 5 nm nanopores calculated using this method. The pressure selection is determined by a multiple linear regression line, and the intersection of the regression line with the x-axis indicates the MMP value. For this 6-component system, the MMP in 5 nm nanopores is 63.7 bar.
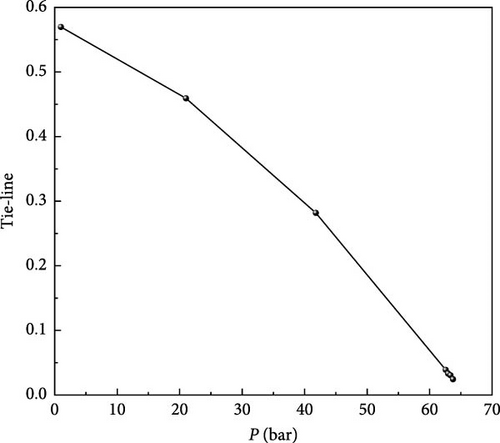
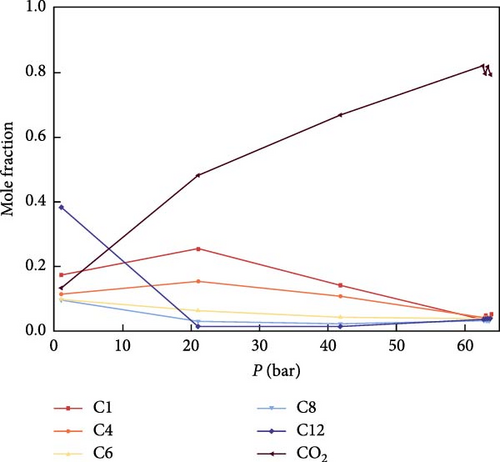
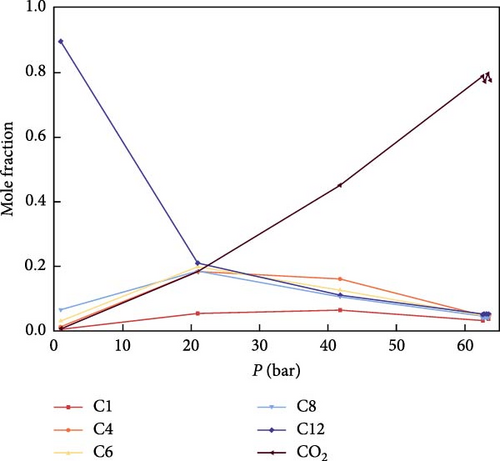
Figure 7 illustrates the variation of components in both the gas phase and the liquid phase before reaching the MMP. As shown in Figure 7, during the pressure increase toward MMP, there is a notable initial rise followed by a decrease in C1 and C4 in the gas phase, while C6, C8, and C12 exhibit an initial decrease followed by an increase. Ultimately, when MMP is achieved, the variations of all gas phase components stabilize. In the liquid phase, C1, C4, C6, and C8 initially rise and then fall, whereas C12 initially falls and then rises. Eventually, at MMP, the variations of all liquid phase components also stabilize. This phenomenon may be attributed to the continuous injection of CO2, leading to an increase in CO2 concentration and a corresponding decrease in the proportion of other components. Additionally, the high solubility of CO2 with light components in the gas phase aids in extracting these lighter components.
5. Conclusions
- 1.
In this paper, a three-phase phase equilibrium calculation of gas phase-liquid phase-adsorbed phase in nanoconfinement space is proposed based on the laws of thermodynamics, which integrates the effects of capillary pressure in nanopores, domain-limiting effect of nanopores, and adsorption of fluid in nanopores on the MMP calculation.
- 2.
The addition of CO2 decreases the critical temperature and increases the critical pressure at the same pore size, shifting the critical point to the upper left in the graph. This indicates that CO2 inhibits the decrease of critical temperature and promotes the increase of critical pressure under the domain-limiting effect. The presence of CO2 increases the critical condensation pressure and decreases the critical condensation temperature of the system, with this effect becoming more pronounced as pore size decreases. Furthermore, with the addition of CO2, the area of the two-phase region enclosed by the phase envelope decreases.
- 3.
When the development of the KTL is completed, the length of the KTL remains unchanged at a fixed value with the increase in the number of contacts. As the pressure increases, the development of the KTL is faster and faster, when the number of contacts required for the complete development also decreases with the increase of pressure. The MMP of the 6-component system of CO2–shale oil for a pore radius of 5 nm in this paper is 63.7 bar at 101°C.
Nomenclature
-
- ΔTc ∗:
-
- Relative critical temperature change
-
- ΔPc ∗:
-
- Relative critical pressure change
-
- Tcb:
-
- Critical temperature of the bulk phase fluid (K)
-
- Pcb:
-
- Critical pressure of the bulk phase fluid (MPa)
-
- Tcp:
-
- Critical temperature in the pore structure (K)
-
- Pcp:
-
- Critical pressure in the pore structure (MPa)
-
- σLJ:
-
- Lennard-Jones fluid sizing parameter
-
- T:
-
- Temperature (K)
-
- R:
-
- Gas constant, MPa·m3/(kg·mol·K)
-
- P:
-
- Pressure (MPa)
-
- v:
-
- Molar volume (m3/mol)
-
- a:
-
- Energy parameter
-
- b:
-
- Volume parameter
-
- Tc:
-
- Critical temperature (K)
-
- Pc:
-
- Critical pressure (MPa)
-
- Tr:
-
- Proposed temperature
-
- ω:
-
- Eccentricity factor
-
- xi:
-
- Mole fractions of the liquid phase corresponding to component i
-
- xj:
-
- Mole fractions of the liquid phase corresponding to component j
-
- yi:
-
- Mole fractions of the vapor phase corresponding to component i
-
- yj:
-
- Mole fractions of the vapor phase corresponding to component j
-
- kij:
-
- Binary interaction coefficient between component i and component j
-
- N:
-
- The total component fraction of the mixed system
-
- σ:
-
- Interfacial tension (N/m)
-
- θ:
-
- The contact angle between the vapor phase and the liquid phase (°)
-
- Pσi:
-
- Isotropic specific volume of component i
-
- ρL:
-
- Densities of the liquid phase (kg/m3)
-
- ρG:
-
- Densities of the gas phase (kg/m3)
-
- niabs:
-
- The absolute adsorption amount of component i
-
- nimax:
-
- The maximum adsorption amount of component i
-
- fb:
-
- Bulk fugacity (MPa)
-
- ρb:
-
- Density of the bulk phase fluid (kg/m3)
-
- V:
-
- Total pore volume (m3)
-
- Vabs:
-
- Volume of the adsorbed phase (m3)
-
- l:
-
- The pore length (m)
-
- r:
-
- The pore radius (m)
-
- d:
-
- The thickness of the total adsorbed layer (m)
-
- zif:
-
- The total system material input for component i
-
- wi:
-
- Mole fractions of the adsorbed phase corresponding to component i
-
- δL:
-
- Liquid phase molar phase fraction
-
- δV:
-
- Gas phase molar phase fraction
-
- δS:
-
- Adsorbed phase molar phase fraction.
Conflicts of Interest
The authors declare no conflicts of interest.
Funding
This work was supported by the joint funds of the National Natural Science Foundation of China (No. U22B2075).
Open Research
Data Availability Statement
The data that support the findings of this study are available from the corresponding author upon reasonable request.


