Numerical Investigation of Heat Transfer and Flow Patterns of Supercritical CO2 in Six-Start Spirally Fluted Tubes
Abstract
This research numerically investigates the heat transfer and flow patterns of supercritical carbon dioxide (sCO2) in a six-start spirally fluted tube. The research focuses on the geometrical optimization of the tube based on three key parameters: the groove depth (e1), the gap between the main tube and the outer sleeve (e2), and the thread pitch (p). The influence of these parameters on the heat transfer coefficient (h) and friction factor (f) was also investigated and analyzed. Furthermore, the study examined the overall impact of the gravity inclination angle (δ) on the thermal performance and flow velocity of the spirally fluted tube. The results indicated that the optimal geometrical parameters are as follows: e1/D = 0.33, e2/D = 0.04, and p/D = 8.33, yielding the highest values of h/h8/(f/f8) in the spirally fluted tub. The change in e2 has a more significant effect on turbulent kinetic energy (TKE) and thermal performance than the change in e1. The p value showed a more substantial effect on the f value compared with the h value. Furthermore, the h value was positively correlated with the gravity inclination angle δ in the region where Tb < Tpc. In the region where Tb > Tpc, increasing the gravity inclination angle δ led to a reduction in h value. When δ < 0°, the h value experienced a slight increase. However, the h value showed a substantial variation when δ > 0°, and the near-wall fluid experienced a reduced flow velocity because of the combined effects of gravity and buoyancy, leading to a decrease in heat transfer. Larger gravity inclination angles led to a more pronounced deterioration in heat transfer. This study is anticipated to provide a theoretical basis for the optimized design of heat exchangers and the enhancement of energy conversion efficiency.
1. Introduction
Following the implementation of the Montreal Protocol, there has been a phased out transition from the conventional hydrochlorofluorocarbons and chlorofluorocarbons (HFCs) refrigerants. Increasing concerns about global warming have accelerated the search for alternative solutions. Recently, carbon dioxide (CO2) has garnered attention from researchers for its excellent refrigeration properties, including being nonflammable, odorless, and nontoxic. More specifically, it is extensively employed in refrigeration systems and warmth pumps. Furthermore, CO2 is an economical, safe, and environmentally friendly refrigerant, with an ozone depletion potential (ODP) of 0 and a global warming potential (GWP) of 1. Therefore, the collection and utilization of CO2 are crucial for energy conservation and reducing emissions [1].
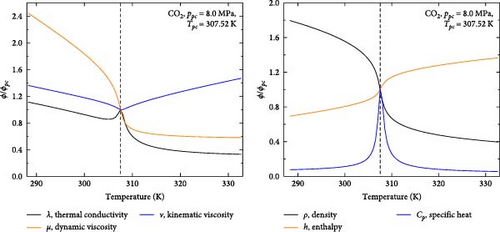
Due to the critical temperature of CO2 being lower (304.25 K at 7.39 MPa [2], far below the critical point of water), the supercritical CO2 (sCO2) state can be reached close to room temperature, which is an ideal working medium for thermal cycles [3]. Figure 1 illustrates the thermophysical curves of sCO2 at 8.0 MPa in the transcritical cycle, which can be calculated using the National Institute of Standards and Technology (NIST) standard reference database REFPROP version 9. In the subcritical region, the specific heat capacity (Cp) increased gradually with rising bulk temperature, then experienced a sharp rise near the critical point, followed by a sudden drop, and finally returned to its initial value in the supercritical region. The thermal conductivity (λ) followed a pattern similar to that of the specific heat capacity in both the subcritical and supercritical regions. Near the critical point, the kinematic viscosity (v) initially decreased to a minimum, then increased significantly to a maximum, and eventually stabilized. The bulk temperature was negatively correlated with the dynamic viscosity (µ) and density (ρ), with the steepest slopes observed near the quasicritical point. In other words, when the temperature is near the critical point (Tpc), CO2 has good flow performance, strong heat transfer effect, and small compressibility, which makes the sCO2 very efficient in the process of mass and heat transfer [4]. Hence, studying the thermal properties of sCO2 in the transcritical cycle holds great importance.
Recently, various gas cooler designs have been proposed to enhance the thermal performance of sCO2, including twisted structures [5], conical horizontal tubes [6], spiral [7–9], bellows, and so on, which have been proposed to enhance the thermal performance of sCO2. For instance, Khoshvaght-Aliabadi et al. [5] explored the flow and heat transfer of sCO2 in a precooler with both twisted tubes and twisted tapes. Their results indicated that the twisted tubes were more effective for sCO2 in a gas-like state, while the twisted tapes were better suited for sCO2 in a liquid-like state. Twisted configurations exhibited displayed a heat transfer coefficient ranging from 1.11 to 1.48 times higher than that of the straight mini tube. Zhu et al. [10] conducted experiments to investigate the thermal properties of sCO2 cooling in two types of grooved tube heat exchangers and one smooth tube heat exchanger. The results showed that the total heat transfer coefficient (h) of the spirally fluted tube was two to three times higher than that of the smooth tube, indicating a substantial improvement in heat transfer efficiency due to the implementation of the spirally fluted design. Yu et al. [11, 12] investigated the heat transfer of sCO2 cooling in a four-start spirally fluted tube, evaluating the influence of various geometrical parameters on thermal performance. Furthermore, Balla et al. [13] conducted simulations to illustrate that the heat transfer efficiency of a six-head spirally fluted tube is considerably enhanced compared to nonbellows tubes, with a 2.4–3.7 times higher efficiency than a round tube. However, the friction coefficient (f) was found to be 1.7–2.4 times higher than that of a nonbellows tube. Jin et al. [14] conducted simulations on six-start spirally fluted tubes, demonstrating that their thermal performance exceeded that of circular tubes and quadrangle spiral bellows, with flow resistance intermediate between the two. It is worth noting that these studies primarily used water as the working fluid, and there is limited research on the thermal properties of sCO2 in six-head spirally fluted tubes.
To sum up, the heat transfer performance of spirally fluted tubes is superior to that of conventional tube [15, 16], but there is a lack of research on the flow and heat transfer characteristics of sCO2 in spirally fluted tubes, particularly those with the six-start spirals. Therefore, this study is the first to numerically explore the thermal properties of sCO2 cooling in a six-start spirally fluted tube. The research is organized as follows: First, the heat transfers and friction coefficients were optimized with respect to groove depth (e1), the gap between the main tube and the outer sleeve (e2), and the thread pitch (p). The thermal efficacy was then investigated with regard to these parameters. The research investigated the overall effects of gravity inclination angles on thermal performance and examined the role of buoyancy under these different inclinations. The research findings are anticipated to provide a theoretical basis for the optimized design of heat exchangers and the enhancement of energy conversion efficiency, which holds significant importance for energy-intensive industries such as power generation, refrigeration, and heat pump systems.
2. Mathematical Description
2.1. Numerical Model
Figure 2a presents the three-dimensional model of the spirally fluted tube, with the flow of CO2 between the outer and inner walls. The inner wall served as the heat transfer surface, while the outer wall was a uniform cylinder. The symbols L and δ represent the length and inclination angles of the tube, respectively. To simplify the model, only the fluid domain on the CO2 side was considered, with the test section having a length of 500 mm. To ensure that the fluid entering the test section was fully developed and to eliminate outlet disturbance effects, two adiabatic smooth tubes, each 200 mm in length (27 de ~ 37 de, depending on the geometric parameters in the cross-section), were connected to the upstream and downstream ends of the test section [12].
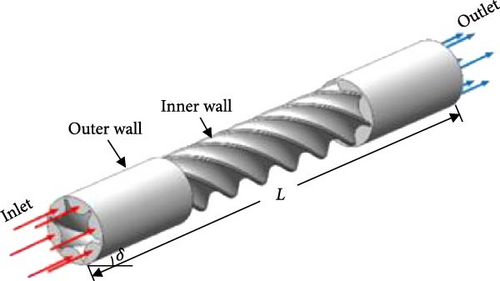
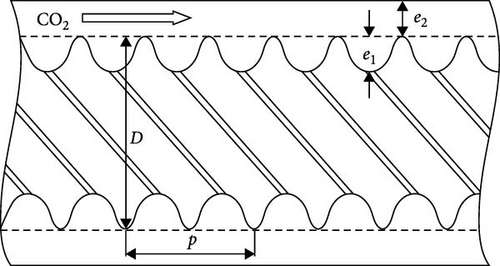
Figure 2b provides a longitudinal section of the threaded tube, where D denotes the diameter of the main tube. For consistency with the experiments, D and L were set to 12 mm and 1 m, respectively, while various designs were considered to optimize the geometry and enhance heat transfer. The study employed single-factor variation parameters based on existing geometrical shapes of six-start spirally fluted tubes. To make the results more universal, the dimensionless parameters were employed in the analysis, and the parameters for each scenario were detailed in Table 1. Moreover, Table 2 provides the gravity components along the x and y axes for various gravity inclinations.
| Case | e1/D | e2/D | p/D |
|---|---|---|---|
| 1 | 0.33 | 0.08 | 8.33 |
| 2 | 0.38 | 0.08 | 8.33 |
| 3 | 0.42 | 0.08 | 8.33 |
| 4 | 0.46 | 0.08 | 8.33 |
| 5 | 0.42 | 0.04 | 8.33 |
| 6 | 0.42 | 0.13 | 8.33 |
| 7 | 0.42 | 0.17 | 8.33 |
| 8 | 0.42 | 0.08 | 3.33 |
| 9 | 0.42 | 0.08 | 5.00 |
| 10 | 0.42 | 0.08 | 6.67 |
| Angle | −90° | −60° | −30° | 0° | 30° | 60° | 90° |
|---|---|---|---|---|---|---|---|
Flow direction |
Vertical downward |
Inclined downward |
Inclined downward |
Horizontal | Inclined upward |
Inclined upward |
Vertical upward |
| gx (m/s2) | 9.81 | 8.50 | 4.91 | 0 | −4.91 | −8.50 | −9.81 |
| gy (m/s2) | 0 | −4.91 | −8.50 | −9.81 | −8.50 | −4.91 | 0 |
Previous studies [17–19] have indicated that the renormalization group (RNG) k-ε model can simulate the turbulent heat transfer in the spiral pipes effectively, as it includes an additional term in its equations that enhances accuracy for rapidly strained flows, such as those found in spiral pipes. Therefore, this study employs the RNG k-ε turbulence model, which delivers accurate results for medium-complexity flows such as jet impingement, separation flow, secondary flow, and swirl flow. The governing equations of this model are as follows [20, 21]:
The empirical constants of the model are reported in [24].
2.2. Numerical Strategies and Boundary Condition
The model was implemented using Ansys Fluent 2021. The SIMPLE Consistent (SIMPLIC) algorithm was implemented to accomplish the semi-implicit solution of the coupled pressure and velocity, while the standard wall function method was applied for calculation. The second-order upwind scheme was used for momentum, TKE, turbulent dissipation rate, and energy equations. The thermophysical properties of CO2 were obtained from the NIST real-gas model provided by the Refprop database. Since the thermal properties of sCO2 were influenced by heat transfer, an under-relaxation factor of 0.8 was used for the energy term. The convergence criteria were set to achieve precision up to the sixth decimal point [23]. Convergence was determined when the absolute residuals of all equations were consistently less than 1 × 10⁻⁶ and the residuals in inlet and outlet mass flow were below 0.1%.
The acceleration of gravity was established in accordance with Table 2, and the mass-flow-inlet and the pressure-outlet boundaries were applied. For the test section, a constant heat flux of Q = 4500 W was applied to the inner wall, while the outer wall was maintained under adiabatic conditions.
2.3. Data Processing
The experimental section was divided into segments, and the local heat transfer coefficient hi for each segment i was calculated based on the relationship between the subsection temperature and the wall temperature. The subsection temperature can be defined as the average of the inlet and outlet temperature, as described previously [11].
2.4. Model Validation
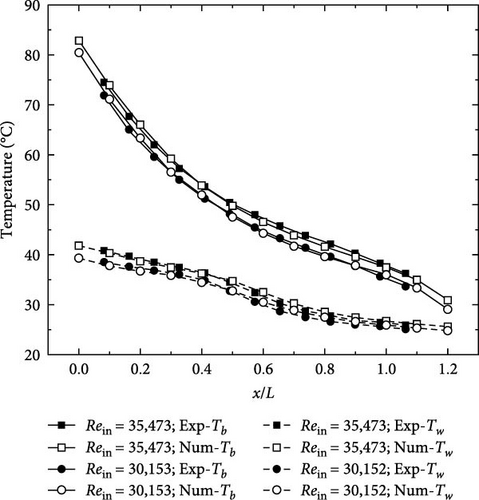
The experimental data were compared with the results to validate the turbulence model [10]. The dimensions of the simulated spirally fluted tube can be specified as follows: L = 1200 mm, R = 11.06 mm, e1 = 5.5 mm, and e2 = 4.00 mm. Furthermore, the boundary conditions for the spirally fluted tube that was simulated are as per the following: Tin = 356.15 K, Pin = 11.2 MPa, and Rein = 35,473. The heat flux q varied with the x-coordinate value and was incorporated into the software for analysis.
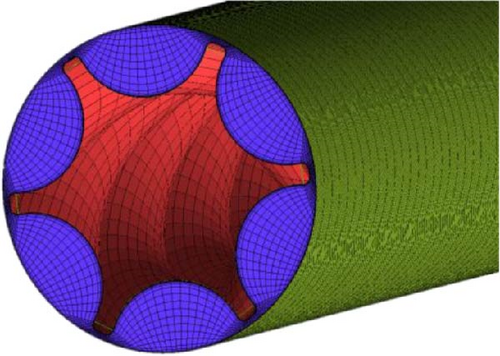
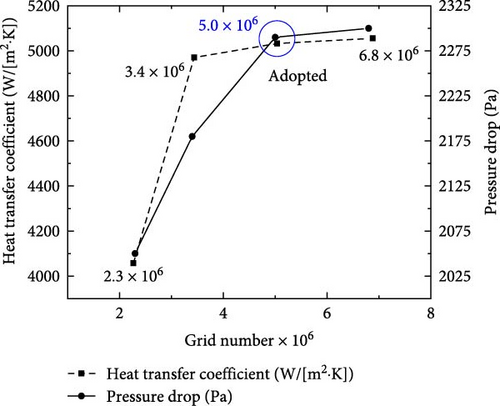
To ensure that the results were independent of mesh size, a grid independence test was conducted using four grids with resolutions of 2.3, 3.4, 5.0, and 6.8 million meshes. It was noted that while finer mesh resolutions provided more accurate results, they also resulted in higher computational costs. The dimensionless distance y+ of the wall surface reached 1.0 in all scenarios. The grid structure and results are presented in Figures 3 and 4, respectively. It was observed that the meshes with 2.3 and 3.4 million grids displayed a 19.28% difference in the calculation results. In contrast, the results from finer meshes differed by less than 2%. Therefore, a compromise was reached by selecting 5.0 million grids to balance accuracy and computational cost.
The simulation results were validated against experimental data [10], demonstrating a high degree of accuracy with a deviation of 2.4%. Consequently, the mesh with 5.0 million grids was found to accurately capture the turbulence phenomena in the threaded tubes (as shown in Figure 5).
3. Results and Discussions
3.1. Optimization of Geometrical Parameters
Three scenarios were examined for the geometric factors. The first scenario analyzed the effects of varying groove depth (e1) on the heat exchange and cross-sectional areas. The second scenario assessed the impact of changing the gap between the main tube and outer sleeve (e2) on the cross-sectional area while keeping the heat transfer area constant. The third scenario investigated how variations in thread pitch (p) affected the heat transfer surface area, with the cross-sectional area held constant. The results of these scenarios are discussed in the following sections. This study examined the total heat transfer and friction coefficients to assess how geometric variations influenced thermal performance and pressure drop in the spirally fluted tubes. The terms h/h8 and f/f8 were employed to optimize the geometry, where h8 and f8 represent reference values of h and f in Case 8, respectively.
3.1.1. Influence of e1 on h Value
Figure 6 illustrates the total heat transfer coefficient h for spirally fluted tubes under the same inlet conditions, with e1/D of 0.33, 0.38, 0.42, and 0.46, corresponding to Case 1 through Case 4, respectively. The results indicate that as e1 increases, the total h gradually decreased, while the f increased. In Case 1, the spirally fluted tube showed the highest value of h/h8/(f/f8) indicating the smallest friction coefficient and the greatest total h. This observation primarily stemmed from the increase in cross-sectional area as e1 increased and the resulting decrease in mass flow rate, which led to a reduction in h. As can be seen from Formula (16), there was a close relationship between f and density, pressure drop, average velocity, equivalent radius, and other factors. With the increase of e1, the cross-sectional area and equivalent radius increased, and the average flow velocity decreased, so the f gradually increased.
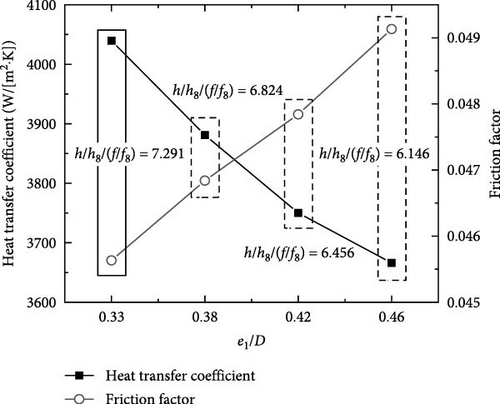
Figure 7 illustrates the relationship between bulk temperature and convective h. Tpc represents the critical temperature of sCO2, which was 307.5 K at a pressure of 8.0 MPa. The graph revealed the initial increase followed by the decrease in convective h with increasing bulk temperature. There was a remarkable enhancement in h as sCO2 passes through the pseudocritical point, and the h reached its maximum value when the temperature was slightly above Tpc. These were because that the fluid near the heat transfer wall had a lower temperature compared with the average fluid temperature, causing the near-wall fluid to reach Tpc earlier than the mainstream fluid and resulting in the maximum heat transfer coefficient occurring above Tpc [12]. This pattern also indicated that the region with the most significant difference in the convective h value was observed at the highest point. The temperature corresponding to the max h value remained relatively stable, indicating the limited influence of e1 on the radial turbulence intensity.
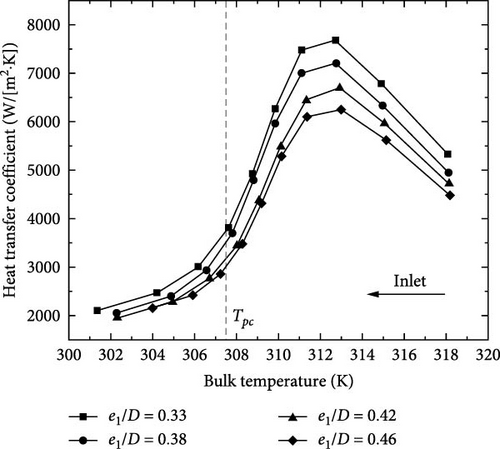
Throughout the entire test section, the spirally fluted tube with a smaller e1 consistently demonstrated a higher h value compared to the tube with a larger e1, both for the gas-like and liquid-like sCO2. Therefore, the optimal e1/D was 0.33, which would improve the flow heat transfer performance of the six-start spirally fluted tubes.
3.1.2. Influence of e2 on h Value
Figure 8 illustrates the distribution of total h for a constant inlet condition in spirally fluted tubes with varying values of e2/D, including 0.04, 0.08, 0.13, and 0.17, corresponding to Case 5, Case 3, Case 6, and Case 7, respectively. It was observed that the h value decreased rapidly with an increase in e2, which may be primarily due to the increase in cross-sectional area, which resulted in a reduction in mass flow and the spoiler effect between walls. Furthermore, the friction coefficient demonstrated a negative correlation with e2. This occurred because the change in pressure drops associated with a higher e2 was more significant than the change caused by e1, resulting in a lower friction coefficient. The spirally fluted tube with e2/D of 0.04 demonstrated the highest value of h/h8/(f/f8), indicating that the decline rate of the h value was faster than the rate of increase in the friction coefficient with an increase in e2.
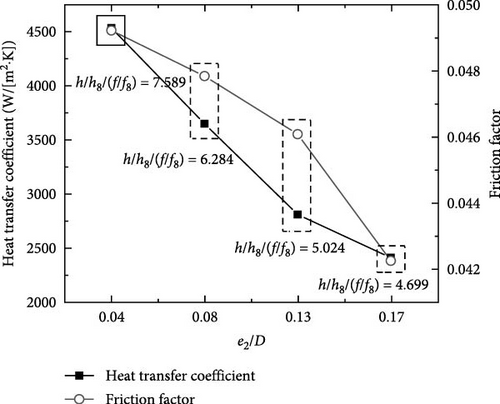
Figure 9 shows the correlation between the bulk temperature and h value. It suggested that the h value initially increased and then decreased as the bulk temperature decreased. It is important to note that the h values for the four distinct e2/D values exhibited substantial differences, all of which exceeded 10.4%. This observation demonstrates the importance of e2 as a critical parameter that affects the h value of spirally fluted tubes. The temperature corresponding to the peak h value increases as the wall spacing increases and the h value changes gradually. This phenomenon may primarily originate from the decrease in mass flow rate and turbulence intensity between the walls with increasing e2, thereby reducing the h value and increasing the temperature difference between the fluid near the wall and the mainstream fluid. Based on the results, it was inferred that the impact of e2 on the h value was primarily due to the change in fluid turbulence, which was agreement with Yang et al. [9].
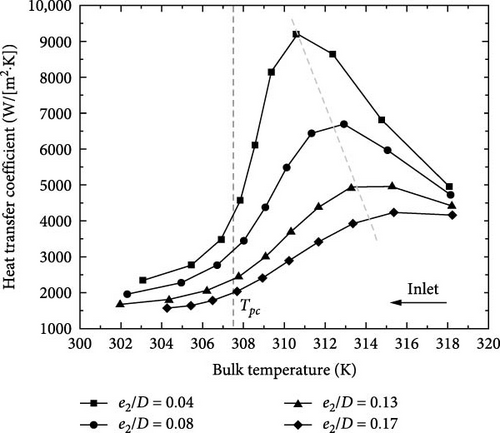
Figure 10 illustrates the variations in TKE for various values of e1 and e2. Similar to the pattern observed for the h value, TKE showed a negative correlation with both e1 and e2. On the high-temperature side, TKE gradually increased due to the progressive development of the flow boundary layer in the inlet section. However, TKE decreased with lower temperatures, primarily due to the changing physical properties of CO2. As the temperature dropped, CO2 density decreased, leading to a reduction in fluid velocity within the spirally fluted tube and consequently, a decrease in TKE. Moreover, Figure 10 reveals that changes in TKE due to variations in e2 have a more pronounced impact than those caused by e1, particularly in the temperature range exceeding Tpc. This finding illustrates that a more substantial variation in TKE was associated with a larger variation in heat transfer coefficient caused by wall spacing.
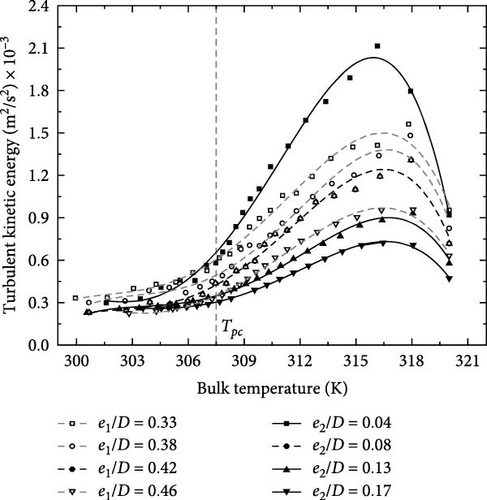
Therefore, it can be concluded that when e2/D = 0.04, the flow thermal performance of spirally fluted cylinders was more effectively improved and e2 demonstrated a relatively more significant effect on the h value compared with the e1.
3.1.3. Influence of the Thread Pitch (p) on the h Value
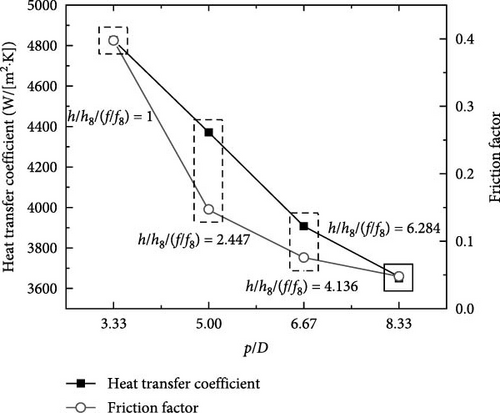
Figure 11 shows the distribution of the h value and friction coefficient of spirally fluted tubes with different p/D, 3.33, 5.00, 6.67, and 8.33, corresponding to Case 8, Case 9, Case 10, and Case 3, respectively. It illustrates the concurrent decrease in both the h and f values with an increase in p. Notably, the value of h/h8/(f/f8) was the highest in the spirally fluted tube with p/D = 8.33 (Case 3). This result confirms the idea that the p has a greater influence on the friction coefficient compared to its effect on the h value.
The distribution of the h value in the spirally fluted tube for various p/D and temperatures is depicted in Figure 12. It reveals a pattern similar to the results observed for the first two geometric factors, where the h value initially increased and then decreased. In contrast to the total h value, larger p values in the inlet section of the spirally fluted tube were associated with lower heat transfer coefficients. When the mainstream fluid’s h value reaches its maximum, lesser p values lead to higher h values as the fluid continues to cool. To further analyze the cause, the tangential velocity distribution in the spirally fluted tube for various p/D values and temperatures is displayed in Figure 13. The points positioned at r/r0 = 0.4 can be defined as follows:
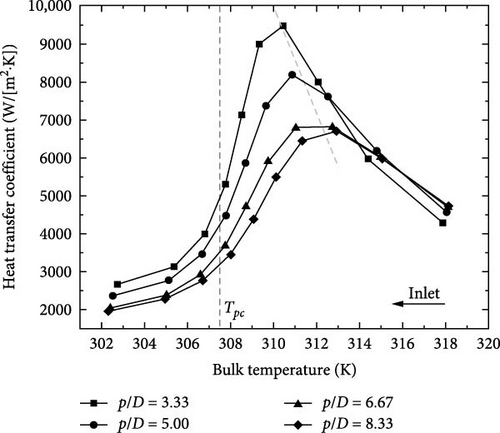
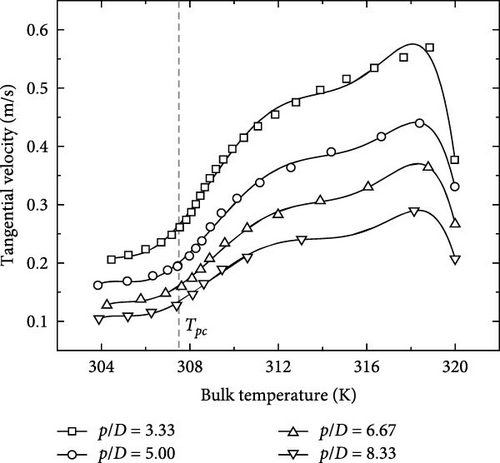
Figure 13 shows the initial increase followed by the subsequent decrease in the tangential velocity. When the bulk temperature was higher than Tpc, the tangential velocity decreased rapidly. This phenomenon may be attributed to the transition of CO2 from a gas-like state to a liquid-like state during the cooling process, resulting in increased density and dynamic viscosity. Therefore, at the same mass flow rate, the tangential velocity gradually decreased, with the reduction being particularly pronounced in the transcritical region. This was consistent with the research result of Yu et al. [11]. The figure also revealed that the smaller p values resulted in higher tangential velocities, which explained the observations in Figure 12. Laminar flow was the predominant flow in the inlet section, as fluid turbulence had not yet completely developed. The radial heat transmission was hindered by the higher tangential velocity in this region, resulting in a substantial temperature disparity between the mainstream fluid and the fluid near the wall. Therefore, larger p values led to a lower heat transfer coefficient. Smaller pitch values led to a stronger TKE and higher h values as the turbulent boundary layer developed.
In conclusion, the section above explores the influence of change in the value of e1/D, e2/D, and p/D on the h value. The optimal geometric parameters were determined to be the following: e1/D = 0.33, e2/D = 0.04, and p/D = 8.33. Among these parameters, e1 had the lowest influence on the h value, while primarily influencing heat transfer via alteration in the cross-sectional structure. Moreover, e2 significantly affected the h value by altering the TKE of the fluid. Compared to e1, smaller e2 values were observed to notably increase TKE, which subsequently led to a higher h value. Meanwhile, it was found that p affected the h value by altering the degree of tangential swirl in the fluid. Specifically, smaller p values resulted in a greater degree of swirl and, consequently, a higher h value. However, p showed a more substantial impact on the f value than on the h value. Although a decreased p value increased the h value, it also resulted in a significant increase in the f value, which could potentially compromise flow efficiency. Consequently, the performance of the spirally fluted tube was dependent on a larger p value (p/D = 8.33, p = 100 mm).
3.2. Influence of the Gravity Inclination Angle on the h Value
This section examines the overall effect of varying inclination angles on the h value in the spirally fluted tube. Figure 14 shows that the variation in the h value when considering the gravity factor aligns with the changes observed in the previous section where gravity was not considered. Furthermore, the h value reached its maximum in the region where the fluid temperature was slightly higher than that of Tpc. The reasons were that the primary heat transfer resistance was located in the near-wall fluid, while the change in the value of h was influenced by TKE and mainly determined by the velocity gradient. In the region where Tb > Tpc, the mainstream of sCO2 was in a gas-like state, and the velocity of the mainstream fluid was much higher than that of the fluid near the heat transfer surface. Where Tb was in close proximity to Tpc, the mainstream fluid experienced a significant increase in fluid density as the phase of the fluid transformed from gas to liquid in the region. The fluid velocity decreased, and the difference of velocity between the mainstream fluid and the near-wall fluid also decreased. Therefore, the h value reached its maximum in the region where the fluid temperature was slightly higher than that of Tpc.
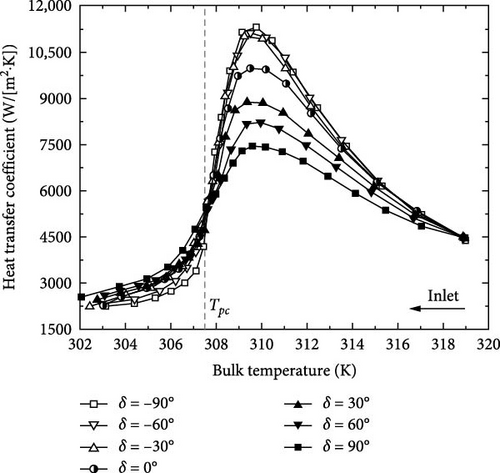
It can also be seen that in the region where Tb < Tpc, the h value was positively correlated with δ, which may be primarily associated with the fact that the key factors influencing heat transfer performance depend on multiple variables. In the region where Tb > Tpc, the h value decreased with increasing δ. When δ was less than 0°, the h value varied slightly, while the changes were significant when δ was greater than 0°. The reasons were that as the δ decreased, the velocity gradient of the fluid increased under the action of gravity, and the heat transfer coefficient increased. Therefore, the h value showed a negative correlation with δ.
To further evaluate the influence of velocity gradients at various inclination angles in the region where Tb > Tpc, Figure 15 illustrates the velocity vector and magnitude in a section of the spirally fluted tube. In this section, the h value reached its maximum (Tb/Tpc = 1.01). Three scenarios were considered with δ values of −60°, 0°, and 60°. The cross-section velocity remained nearly unaltered when δ = −60°, as shown in Figure 15a. A low-speed fluid region was observed near the wall at δ = 0°, and at δ = 60°, this low-speed region was substantially enhanced and occurred in each groove. The observed phenomenon may be attributed to two factors: Firstly, the sCO2 density increased significantly during the cooling process and phase transition from gas to liquid. The fluid phase increased when δ > 0°, and the velocity was decreased by gravity. Secondly, the buoyancy effect led to the accumulation of quasi-liquid fluid near the wall surface, which substantially decreased the flow rate near the wall surface and may even induce countercurrent phenomena. These results are consistent with the findings in Fan et al. [25].


Figure 15b displays the velocity vector of the near-wall fluid in a single groove. The fluid velocity decreased and approached zero when δ exceeded 0°. The results indicate that heat transfer experienced a decrease in the region where Tb > Tpc when δ > 0°. The deteriorating effect was more pronounced as the inclination angle increased. This occurred because the influence of the gravity factor and buoyancy effect led to a low flow rate of the near-wall fluid, explaining the dominance of the velocity gradient in altering the heat transfer coefficient observed in Figure 14.
In addition, the buoyancy in the spirally fluted tube with various gravity inclination angles was analyzed to further investigate the influence of buoyancy on sCO2 cooling (as illustrated in Figure 16). The ratio of buoyancy to viscous force is represented by the Grashof number in the current study, which can be defined as follows:
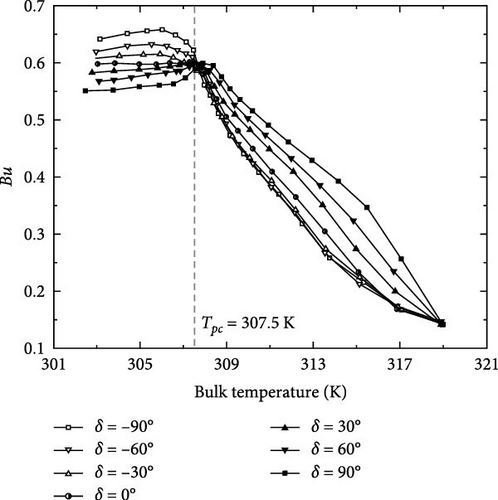
Figure 16 demonstrates that the buoyancy variation trends were fundamentally comparable and reached a turning point at Tpc. In the region where Tb > Tpc, Bu increased gradually with the cooling process. The observed phenomenon primarily originated from the increase in fluid density and the decrease in mainstream flow velocity, leading to lower Re. In the area where Tb < Tpc, Bu remained high with minimal changes. Therefore, the h value in this region was greatly influenced by buoyancy and increased with higher gravity inclination angles, which was consistent with the result of Yu et al. [12].
4. Conclusions
- 1.
The optimal parameters for the six-start spirally fluted tube were determined to be e1/D = 0.33, e2/D = 0.04, and p/D = 8.33 under specific conditions, including an inlet temperature of 320.15 K, an operating pressure of 8.0 MPa, an inlet Reynolds number of 21,000, and a constant heat flux of 4500 W.
- 2.
In this study, a smaller e1 led to improved flow heat transfer performance under the specified working conditions, despite the relatively minor impact on heat transfer. In comparison, e2 demonstrated a relatively more pronounced effect on the h value, while p showed a more substantial impact on the f value than on the h value. Although a decreased p value increased the h value, it also resulted in a significant increase in the f value, which could potentially compromise flow efficiency. Consequently, the performance of the spirally fluted tube was dependent on a larger p value.
- 3.
The h value was positively correlated with δ in the temperature range where Tb < Tpc. While in the temperature range of Tb > Tpc, the h value increased with the decrease in gravity inclination angle δ. This phenomenon occurred because the primary heat transfer resistance was located in the near-wall fluid, while the change in the value of h was mainly determined by the velocity gradient, which can be accelerated due to gravity, thereby enhancing heat transfer.
- 4.
The h value was found to be increased with decreasing δ. When δ < 0°, variations in the h value were negligible. However, for δ > 0°, there was a significant variation in the h value. This was because the flow velocity in the near-wall fluid was reduced and the countercurrent phenomena might even be induced due to the combined effect of gravity and buoyancy, leading to a deterioration in heat transfer. A larger gravity inclination angle δ was associated with a more serious heat transfer deterioration.
In the subsequent stages of our research, based on the geometric optimization of six-head spirally fluted tube, we will further investigate and discuss the detailed effects of gravity inclination δ on the flow and heat transfer behavior of sCO2.
Nomenclature
-
- A:
-
- Area (mm2)
-
- Bu:
-
- Buoyancy parameter
-
- Cp:
-
- Specific heat (J/[kg·K])
-
- Ac:
-
- The area of cross-section (mm2)
-
- D:
-
- The diameter of inner tube (mm)
-
- de:
-
- Equivalent diameter (mm)
-
- e1:
-
- The depth of the groove (mm)
-
- e2:
-
- The distance between the main tube and the outer sleeve (mm)
-
- f:
-
- Friction factor
-
- h:
-
- Heat transfer coefficient (W/[m2·K])
-
- g:
-
- Gravitational acceleration (m/s2)
-
- G:
-
- Mass flux (kg/m2·s)
-
- Gr:
-
- Grashof number
-
- k:
-
- Turbulent kinetic energy (m2/s2)
-
- L:
-
- Length (m)
-
- p:
-
- Pitch of thread (mm)
-
- P:
-
- Pressure (Pa)
-
- Pr:
-
- Prandtl number
-
- q:
-
- Heat flux (W/m2)
-
- r:
-
- The radius of the main tube (mm)
-
- Re:
-
- Reynolds number
-
- T:
-
- Temperature (K)
-
- u:
-
- Velocity (m/s)
-
- Lp:
-
- Wetted perimeter (mm).
Greek Symbol
-
- δ:
-
- Inclination angle (°)
-
- ρ:
-
- Density (kg/m3)
-
- ε:
-
- Dissipation rate of turbulent energy (m2/s2)
-
- λ:
-
- Thermal conductivity (W/m K)
-
- μ:
-
- Dynamic viscosity (kg/[m·s]).
Subscripts
-
- avg:
-
- Average
-
- b:
-
- Bulk fluids
-
- h:
-
- Cooling surface
-
- i:
-
- Subsection
-
- in:
-
- Inlet
-
- out:
-
- Outlet
-
- pc:
-
- Pseudocritical
-
- t:
-
- Testing point
-
- w:
-
- Inner wall.
Ethics Statement
The authors declare no ethical issue in relation to this study.
Conflicts of Interest
The authors declare no conflicts of interest.
Funding
This research is funded by the National Natural Science Foundation of China (51971113), the Inter-Governmental S&T Cooperation Project (Research Personnel Exchange Program Between China and Serbia, China and North Macedonian), the Natural Science Foundation of Zhejiang Province (LY20A020004, LY21A020002, and LQ23A020001), the Higher Education Scientific Research Planning Project of China Association of Higher Education (24KC0419), the General Project of Zhejiang Provincial Department of Education (Y202250294 and Y202456499), the Natural Science Foundation of Liaoning Province/Joint Open Fund (2022-KF-24-04), the Foundation of State Key Laboratory of Automotive Simulation and Control (20210235), the Natural Science Foundation of Ningbo Municipality (2023J179 and 2023J389), the Ningbo Major Special Project of the Plan “Science and technology innovation 2025” (2022Z11 and 2023Z036), the Scientific Cultivation Project of Ningbo University of Technology (2022TS15 and 2022TS17), and the National Innovative Training Program for College Students (202411058047). The project is also inseparable from the technical and financial support of Ningbo Liangye Electric Appliance Co., Ltd.
Acknowledgments
This research is funded by the National Natural Science Foundation of China (51971113), the Inter-Governmental S&T Cooperation Project (Research Personnel Exchange Program Between China and Serbia, China and North Macedonian), the Natural Science Foundation of Zhejiang Province (LY20A020004, LY21A020002, and LQ23A020001), the Higher Education Scientific Research Planning Project of China Association of Higher Education (24KC0419), the General Project of Zhejiang Provincial Department of Education (Y202250294 and Y202456499), the Natural Science Foundation of Liaoning Province/Joint Open Fund (2022-KF-24-04), the Foundation of State Key Laboratory of Automotive Simulation and Control (20210235), the Natural Science Foundation of Ningbo Municipality (2023J179 and 2023J389), the Ningbo Major Special Project of the Plan “Science and technology innovation 2025” (2022Z11 and 2023Z036), the Scientific Cultivation Project of Ningbo University of Technology (2022TS15 and 2022TS17), the National Innovative Training Program for College Students (202411058047). The project is also inseparable from the technical and financial support of Ningbo Liangye Electric Appliance Co., Ltd.
Open Research
Data Availability Statement
The data that support the findings of this study are available from the corresponding author upon reasonable request.


