Energy, Environmental, and Economic Feasibility Assessment of Solar Adsorption Cooling System Under Different Climate Conditions in China
Abstract
The ever-increasing cooling demands in China give rise to huge impact on power grid and lead to massive CO2 emissions, exacerbating ecological issues, such as global warming. It is urgent to develop clean, environmental friendly, and low-carbon refrigeration technology to achieve decarbonization in the cooling process. This work aims to evaluate the application potential of a solar adsorption cooling (SADC) system based on a novel aluminophosphate adsorbent in various climatic zones of China through TRNSYS simulation. For a comprehensive evaluation, solar absorption cooling (SABC) and vapor compression cooling systems are selected as reference systems. Energy, environment, and economy analyses of SADC are conducted in 12 representative Chinese cities. The results show that the studied solar adsorption system outperforms in energy conservation and emission reduction, particularly in hotter zones, where it can save up to 23% of primary energy and reduce at most 46% of CO2 emission per year compared to vapor compression cycle. Meanwhile, the system demonstrates strong economic benefits and market competitiveness in hotter zones. Moreover, the proposed system shows higher energy efficiency and faster response speed than SABC system, especially in zones with moderate solar energy resources. The performances make the proposed system a practical alternative to realize near-zero-carbon refrigeration powered by renewable energy.
1. Introduction
Air conditioning and refrigeration systems are crucial for enhancing building comfort and living conditions. However, the rapidly growing demand for refrigeration has exerted significant pressure on the power grid. Reports from the International Institute of Refrigeration (IIF/IIR) in Paris show that ~15% of the global electricity production is consumed by heating, ventilation, and air conditioning (HVAC), accounting for over 45% of the energy consumption in residential and commercial buildings [1]. In 2019, about 100 million tons of CO2 emissions were attributed to the use of refrigeration systems [2]. Due to the heavy reliance of China’s power structure on fossil fuel, and the widespread use of hydrofluorocarbons (HFCs) as refrigerants in the traditional vapor compression cooling (VCC) system, the increase in electricity consumption indirectly contributes to ecological imbalances such as climate change and global warming. Hence, it is urgent to explore and develop energy-efficient and eco-friendly refrigeration technologies.
Solar energy is seen as a vital solution to address energy crises and environmental pollution due to its clean, inexpensive, and widely distributed advantages. In most cases, the availability of solar radiation aligns temporally with the cooling needs of buildings, making solar refrigeration systems a viable alternative to VCC. The International Energy Agency (IEA) forecasts a potential market of 417 TWh per year for solar-powered refrigeration by 2050 [3]. As the world’s largest producer and consumer of solar thermal systems, as of the end of 2022, China’s total solar thermal application retention was 619.7 million m2, with an additional 23.725 million m2 installed in 2022 [4]. Meanwhile, to facilitate the achievement of “dual carbon goals,” the Chinese government has implemented numerous policies in recent years to stimulate the field of solar thermal utilization. These factors show the significant potential and market prospects for solar thermal refrigeration technology.
In recent decades, the research and application of solar refrigeration technology have grown rapidly, particularly in solar absorption cooling (SABC) system, which occupies the major market share [5]. However, absorption cooling (ABC) system faces a series of issues such as crystallization and equipment corrosion under certain operating conditions. In contrast, adsorption cooling (ADC) system, despite facing challenges like lower COP, less efficient heat and mass transfer, and longer cycle times, offers a lower driving temperature, which facilitates better utilization of low-grade energy sources, especially solar energy. Additionally, the use of solid adsorbents eliminates moving components like rectifiers and solution pumps, thus avoiding corrosion and crystallization issues associated with salt solution. The ADC also shows lower sensitivity to impact and installation location [6], simpler control mechanisms, lower operation, and maintenance costs, and consumes almost no electric energy. It typically uses safe and clean refrigerants like water and methanol, which are eco-friendly. Due to its potential for energy conservation and environmental protection, ADC is considered one of the most promising refrigeration technologies. Based on the above factors, the research and application of the solar adsorption cooling (SADC) system are increasingly growing.
For solar-driven adsorption chillers, adsorbents play a crucial role in determining the system performance. The selection of adsorbent mainly depends on material properties and economic factors. Traditional adsorbents, such as activated carbon [7, 8], zeolite [9–11], and silica gel [12, 13], despite showing advantages of desirable stability and acceptable production costs, have drawbacks like high regeneration temperatures and low water adsorption capabilities, which result in lower energy efficiency and poor economics for SADC. Alternatively, metal–organic frameworks (MOFs) with excellent adsorption properties have received extensive research and attention in recent years [14, 15]. Nevertheless, the challenges from expensive production costs make MOFs unaffordable for the market. In recent years, aluminophosphates (AlPOs) molecular sieves, a series of zeolite-derivatives-based porous materials, have shown remarkable potential in ADC. Among these, Liu et al. [16] reported a zeolite-like AlPO with an SFO topology (AlPO-SFO) tailored for water-based ADC, which demonstrates excellent adsorption performance and competitive raw costs, significantly superior to other reported adsorbents. However, current researches and applications of AlPO-SFO still remain at the prototype scale [17], further studies and analyses are urgently needed to evaluate its feasibility and performance when coupled with low-grade energy sources.
Over the past few years, SADC has received widespread attention due to its advantages such as environmentally friendly, pollution-free, and low maintenance costs. Technological advancements in this field have been continuously deepening, including the development of adsorption working pairs, optimization of the adsorbent bed [18, 19], and the improvement of system structures [20–22]. These developments have further strengthened the feasibility of SADC. From the perspective of energy and environment, SADC can significantly reduce electricity dependence, thereby lowering energy consumption and carbon emissions. Singh and Das [23–26] investigated the potential application and operational strategies of solar energy in the field of building air-conditioning systems, the findings revealed that the incorporation of solar energy can substantially decrease the energy consumption of air-conditioning systems while enhancing their economic viability. In a case study conducted in Riyadh, a silica gel/water ADC system driven by solar energy for large-scale cooling needs can reduce energy costs (ECs) by up to 74% annually compared to traditional vapor compression cycles [27].
From an economic perspective, however, the tradeoff between cost and performance remains the biggest challenge in the application process of SADC. While studies have shown that SADC is cost-effective in small-scale applications [28], it still faces high initial investment costs and a long payback period (PBP) [29]. Nonetheless, several studies in the literature have confirmed the technical and economic feasibility of SADC. Eicker et al. [30, 31], compared solar photovoltaic cooling system and SADC under different climatic conditions, finding that if no feed-in tariff is imposed on excess photovoltaic electricity, the cooling costs and primary energy savings of the two solutions were comparable, and SADC typically provided a higher solar fraction. The simulation results of Mehmood et al. [3] in major cities of Pakistan showed that SADC reduced operating costs and carbon emissions by 4.1 times and 3.19 times, respectively, compared to VCC. Due to the uneven spatial distribution of solar energy, the economy of SADC varies under different climatic conditions. Several studies conducted by Palomba et al. [32–34] have corroborated these findings and highlighting SADC’s competitive performance in diverse zones. Furthermore, Eicker et al. [35] developed a dynamic model to analyze SADC under different climates. The results showed that SADC exhibits greater feasibility in hot climates compared to temperate environments. As far as authors know, no comprehensive feasibility analysis of SADC in combination with China’s diverse climatic conditions has been reported in the literature. This represents a significant gap, since the use of adsorption chillers is becoming relevant, reliable guiding analysis and research methods are urgently needed.
Herein, we report, to the best of our knowledge, the first-ever comprehensive analysis of the feasibility of a SADC system utilizing AlPO-SFO under various climatic conditions in China from the viewpoint of energy, environment, and economy. Meanwhile, a comparative analysis was also conducted between the proposed system and these two conventionally used ones, namely, SABC and VCC. The purpose of this paper is to (a) comprehensively evaluate the feasibility of the studied system from three aspects: energy, environment, and economy, with the VCC as the reference system, (b) revealing the potential advantages and challenges of the SADC compared to the SABC, and (c) providing practical guidance for the application of the SADC.
2. Method
2.1. System Model
To facilitate a comprehensive comparison, this work simulates and analyzes three distinct systems: solar-powered ADC and ABC, and electrically driven VCC. Each system is designed to meet the cooling needs of a 384-m2 office building. A commercial tool (TRNSYS 18) was used to simulate the annual transient operation of each cooling system. The schematic diagram of the simulated systems, including TRNSYS components, is presented in Figure 1. Since the SADC and SABC have the same components except for the chiller, the absorption system will not be listed separately here. The detailed assumptions and model descriptions for each component can be found in the TRNSYS help documentation [36]. The solar thermal refrigeration cycle comprises two subsystems: the solar subsystem and the cooling subsystem. The former consists of a solar collector array, an insulated water storage tank, a controller, and pumps. The cooling subsystem mainly comprises an adsorption/absorption chiller, a cooling tower, pumps, and the cooling space. Herein, the solar collector serves as the heat source to drive the cooling system. Considering the tradeoff between performance and cost, an evacuated tube collector (ETC) is employed here. The entire system comprises four circuits: hot water, regenerated water, cooling water, and chilled water. During system operation, hot water, heated by the collector, flows into the storage tank to maintain a high temperature within the tank. Subsequently, water from the storage tank is pumped through the desorption adsorption bed via the regeneration water pump to facilitate desorption and then returns to the tank. The cooling water, cooled by the cooling tower, flows into the adsorption chiller to take away the heat from both the condenser and the adsorbing adsorption bed. Lastly, the chilled water, after absorbing cooling energy from the evaporator of chiller, flows into the cooling space. Different from other systems, the present system employs AlPO-SFO as the adsorbent. On the other hand, the VCC mainly consists of an electrically driven chiller, a circulating pump, a cooling tower, and the cooling space.
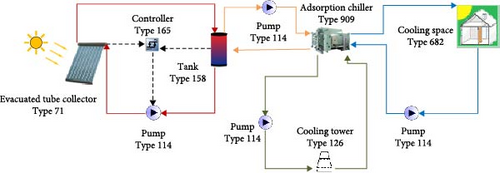
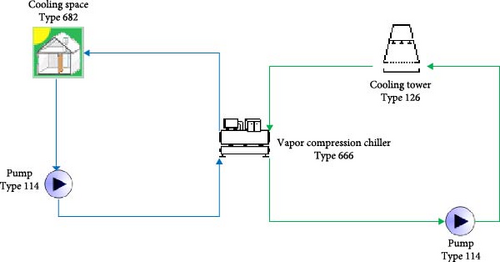
2.1.1. Weather Data
TRNSYS can read meteorological data from database files (TMY2) for calculations. In this study, hourly typical meteorological data for all investigated cities in various climatic zones were exported using Meteonorm software. These data were then processed through the TRNSYS weather component (Type15) and connected to other relevant components, such as the solar collector, cooling tower, and water tank. The selection of investigated cities was determined based on two standards: the Design Standard for Energy Efficiency of Public Buildings issued by the Ministry of Housing and Urban-Rural Development of the People’s Republic of China [37]; and the Assessment Method for Solar Energy Resource proposed by the China Meteorological Administration [38] with reference to the thermal design zones of buildings and the global horizontal radiation (GHR) level of typical years in each city. The chosen investigation cities and their locations are listed in Table 1. Among them, the GHR ratings A/B/C/D represent the four levels of irradiation: richest, very rich, rich, and average, respectively.
| City | Position | Climate zone/GHR |
|---|---|---|
| Golmud | 36.4°N/94.9°E | Severe cold zone/A |
| Chaoyang | 41.6°N/120.5°E | Severe cold zone/B |
| Harbin | 45.8°N/126.8°E | Severe cold zone/C |
| Lhasa | 29.7°N/91.2°E | Cold zone/A |
| Yinchuan | 38.5°N/106.2°E | Cold zone/B |
| Beijing | 39.9°N/116.3°E | Cold zone/C |
| Hangzhou | 30.2°N/120.2°E | Hot summer and cold winter zone/C |
| Chongqing | 29.5°N/106.5°E | Hot summer and cold winter zone/D |
| Sanya | 18.2°N/109.5°E | Hot summer and warm winter zone/B |
| Guangzhou | 23.1°N/113.3°E | Hot summer and warm winter zone/C |
| Kunming | 25.0°N/102.7°E | Mild zone/B |
| Guiyang | 26.6°N/106.7°E | Mild zone/C |
2.1.2. Building Model
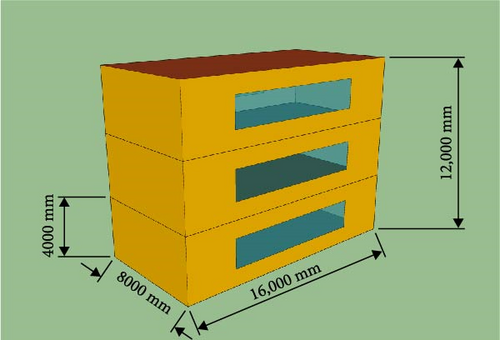
In this study, the building model is a three-storey office building created using TRNbuild and SketchUp software, in accordance with relevant national standards and specifications, as shown in Figure 2. The building has a total area of 384 m2 and a volume of 1536 m3. It features windows on both the north and south facades, with a window-to-wall area ratio of ~27.09%. The cooling season is set from May 1–October 1 each year, with specified indoor conditions: a temperature of 26°C, a relative humidity of 50%, an infiltration rate of four times per hour, and a living population of 38 people. Meanwhile, the cooling system operates from 7 AM to 7 PM on weekdays [37, 39]. The internal heat gains include metabolic activity from occupants at 69.78 W/m2, lighting at 9 W/m2, and computers and office equipment at 230 W/person [40]. Table 2 lists the settings for the building envelope structure, and the heat transfer coefficients are determined in reference to the relevant national standards [37, 39].
| Exterior wall | Roof | External window | Floor | Interior wall | Ceiling |
|---|---|---|---|---|---|
| 0.293 | 0.220 | 1.100 | 0.295 | 0.394 | 0.896 |
2.1.3. Cooling Load
The transient cooling load primarily originates from the heat exchange between the building and the external environment, as well as the heat gain from occupants, equipment, lighting, and other sources within the building. To determine the transient thermal behavior of the building, a simulation system for building cooling demand was established in TRNSYS. The building model from TRNBuild was exported as a TRNSYS building component (Type 56) through TRNSYS simulation studio. Various building characteristics, such as building materials, internal heat gains, mechanical ventilation, and air changes per hour, can be coupled with the building component (Type 56) through TRNBuild, explained using multizone building modeling. Furthermore, the meteorological data, including dry-bulb temperature, relative humidity, horizontal irradiance, and incidence angle, are also connected to the building model.
2.1.4. ETC
2.1.5. Hot Water Storage Tank
The thermal storage tank, simulated by Type 158 from the TRNSYS standard library, is employed to store hot water heated by the ETC. It provides a stable heat source for the desorption process of the refrigerant and plays a certain role in heat storage, ensuring continuous operation of the system during periods of insufficient solar energy. The tank is divided into n equal volume, uniformly mixed isothermal segments, and each segment interacts thermally with the adjacent nodes through fluid conduction and convection. In this study, the total loss coefficient of the tank is assumed to be 3 kJ/h m2 K [42, 43], and the tank volume is set to 60 or 80 m3 based on the collector area.
2.1.6. Adsorption Chiller
The adsorption chiller, simulated using Type 909 from the TRNSYS TESS library, utilizes a normalized performance table to determine the performance of the ADC under given operating conditions. Based on measured experimental data, including cooling capacity and COP under various operating conditions (such as heat source temperature, chilled water temperature, and cooling water temperature), the built-in solver in TRNSYS interpolates these values to obtain the response under instantaneous conditions. Since the data files are standardized, the capacity of the model can be scaled to match the cooling demand.
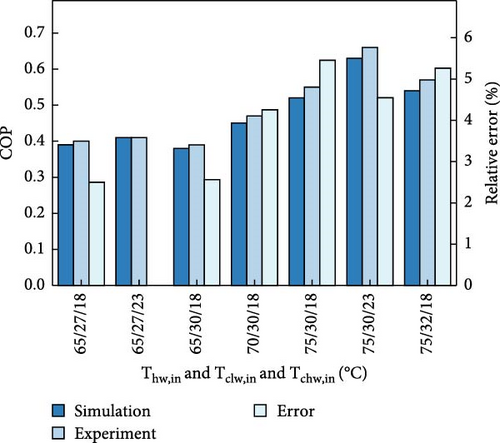
The AlPO–water adsorption chiller unit used in this study adopts a heat and mass recovery process to improve system performance. The chiller is capable of operating with a heat source temperature above 60°C. Specifically, when the regeneration water temperature, cooling water inlet temperature, and chilled water inlet temperature are set at 75°C, 30°C, and 23°C, respectively, the chiller can achieve a COP of 0.66 and a cooling capacity of 64.93 kW. A more detailed description of the chiller and its performance can be found in [44]
2.1.7. Absorption Chiller
In contrast to adsorption refrigeration cycles, which utilize solid adsorbents, single-effect ABC chiller employs a solution (typically ammonia or lithium bromide) to absorb the refrigerant vapor returning from the evaporator. Subsequently, this solution is pumped into the generator, where it absorbs heat from the hot water source, leading to the desorption of the refrigerant and its transfer to the condenser.
In this study, TRNSYS Type 107 was used to simulate the water-cooled single-effect absorption chiller driven by hot water. This model bears similarities to the adsorption model and also relies on a normalized catalog data table provided by the user to determine the performance of chiller. Herein, the rated COP of the absorption chiller is 0.7, with a driving temperature of 95°C.
2.1.8. Vapor Compression Chiller
The water-cooled vapor compression chilling unit was simulated using Type 666. This model also uses directory data sourced from external files to determine performance. During operation, it consumes electricity to chill the water flow on the evaporator side, while discharging heat to the cooling water flow on the condenser side. The rated COP of this unit is 4.45.
2.1.9. Cooling Tower
TRNSYS Type 126 was employed to simulate the cooling tower, which is utilized to absorb the heat rejected during the desorption process of the adsorbent in the adsorption bed and the condensation of the refrigerant in the condenser. This model employs predesigned inlet and outlet conditions to calculate the overall heat transfer coefficient (UA) of the cooling tower. Subsequently, this UA value is applied to estimate the performance of the tower at specific inlet conditions. The minimum outlet temperature is constrained by the wet-bulb temperature of the ambient air.
2.1.10. Pump
The water pumps, modeled using Type 114, were utilized to circulate fluids in various loops, namely solar loop, regeneration loop, cooling loop, and chilled loop. In the SADC simulation system, a total of four fixed-speed circulating water pumps are incorporated (whereas, for the VCC, only cooling loop pumps and chilled loop pumps are employed). The ranges of mass flow rate and power variation for these four pumps are presented in Table 3, the flow rate of each circuit is primarily determined based on the specific operational characteristics of the respective system. The principle for setting the values is to maintain a certain temperature difference between the inlet and return water temperatures, in order to more accurately simulate actual operational conditions.
| Pump | Flow rate (m3/h) | Power (W) |
|---|---|---|
| Solar loop | 2–17 | 150–1500 |
| Regeneration loop | 8–16 | 1100–1500 |
| Cooling loop | 12–20 | 1100–2200 |
| Chilled loop | 3–6 | 150–750 |
2.2. Energy and Environmental Analysis
2.2.1. Solar Heating Rate
Specifically, the heating season is set from November 15 to March 15 each year, and the energy term in the equation is derived by integrating the instantaneous output values from TRNSYS over the specified time step.
2.2.2. Energy Analysis
The purpose of energy analysis is to compare the SADC with the traditional VCC in terms of primary energy savings. Thus, like the SADC, the VCC has been simulated in TRNSYS employing the same weather data and load files.
The national efficiencies for production in public electricity ηpd have been taken from [46] and is 0.32.
2.2.3. Carbon Emission Analysis
The data utilized for computing CO2 emissions derived from primary energy production were sourced from [48], while the following data have been defined and used for calculations of indirect CO2 emissions: refrigerant charge of 0.328 kgR410a/kW of refrigeration capacity [49], GWP of 1924 [49], and leakage rate of 10% [50].
2.3. Economic Analysis
SADC technology is typically characterized by high initial investment and low operating costs compared to conventional mechanical cycles. This significant upfront cost serves as the primary obstacle for solar cooling systems in the marketplace. Therefore, it is crucial to take economic factors into account in the feasibility assessment of SADC, for informed long-term decisions. To conduct a comprehensive economic analysis of the proposed systems, several necessary assumptions were made, as summarized in Table 4. Since the lifetime of VCC is shorter than that of SADC, it is assumed that the same type of conventional chiller will be replaced at the end of its lifetime to compare these two systems within the same period of time [51]. Furthermore, to simplify calculations, the effects of inflation, electricity price escalation, and variations in CO2 emission costs on the overall system cost have been disregarded in this section.
| Parameters | Value | Unit |
|---|---|---|
| Interest discount rate (i) | 5 | % |
| Carbon tax for CO2 emission () | 0.01654 | USD/kg CO2 |
| Average electricity price (cel) | 0.0752 | USD/kWh |
| Maintenance cost of the SADC (rOMC,SADC) | 1.25 | % (of capital cost) |
| Maintenance cost of the VCC (rOMC,VCC) | 1.75 | % (of capital cost) |
| CO2 emission factor for electricity grid () | 0.249 | kg CO2/kWh |
| Primary energy factor for electricity grid (PEFel) | 3.125 | kWhPE/kWhel |
| Installation cost of the chilling system | 15 | % (of capital cost) |
| Lifetime of the SADC | 20 | year |
| Lifetime of the VCC | 8 | year |
2.3.1. CIL Cost
The CI consists of the purchased equipment cost(Z)and installation cost (CINS). The purchased equipment cost of each component within the system (Zk) is estimated based on the cost data listed in Table 5. Therefore, the levelized CI cost can be calculated by the following equation [51]:
| System component | Capital cost(USD) |
|---|---|
| ETC collector | 48.31/m2 |
| Hot water storage tank | 60/m3 |
| Adsorption chiller | 250/kW |
| Vapor compression chiller | 146/kW |
| Cooling tower | 10.2/kW |
| Pump | 38/kW |
2.3.2. OMCL
2.3.3. ECL
2.3.4. CDECL
2.3.5. Economic Evaluation Criteria
There are several economic criteria to assess the economic performance of energy systems. In the present study, PBP, net present value (NPV), and internal rate of return (IRR) have been used as economic indicators to evaluate the profitability of the SADC.
2.4. Collector Saving Rate (CSR)
2.5. Preheating Process
Given the significant disparity between the driving temperature of the chiller and the ambient temperature, and the absence of auxiliary heating equipment in the proposed system, a “preheating process” is required before system startup. This process entails activating the solar collector loop prior to the cooling season, elevating the water temperature in the tank above the driving temperature. The duration of this preheating process (preheating time) serves as a crucial indicator for evaluating the system’s startup efficiency. A shorter preheating time signifies that the system can enter operational status more rapidly, thereby enhancing the overall system efficiency. Additionally, the electricity consumed during the preheating process (preheating energy consumption) reflects the energy expended during the system’s startup process. For solar energy systems, lower preheating energy consumption indicates reduced operating costs, which is a crucial aspect for market promotion and commercial viability. Considering the distinct driving temperatures and collector area requirements of ADC and ABC, it is imperative to delve into a discussion on the differences in preheating time and preheating energy consumption between these two systems.
3. Results and Discussion
3.1. Model Validation
TRNSYS is a potent tool for energy analysis and design, extensively employed in simulating transient energy systems, the accuracy and reliability of its components have been fully validated [33, 60–64]. Since the adsorption chiller component (Type 909) in TRNSYS relies on user-provided performance files for linear interpolation calculations, and the accuracy of the calculations is related to external data files, it is necessary to validate the output of this model. To this aim, the predicted performance output of the model was compared with experimental data from an adsorption chiller loaded with AlPO-SFO. Figure 3 presents the results of the model validation, revealing a remarkable concordance between the model’s predictions and the real data, with a maximum deviation of COP below 5.5%.
3.2. Operational Characteristics
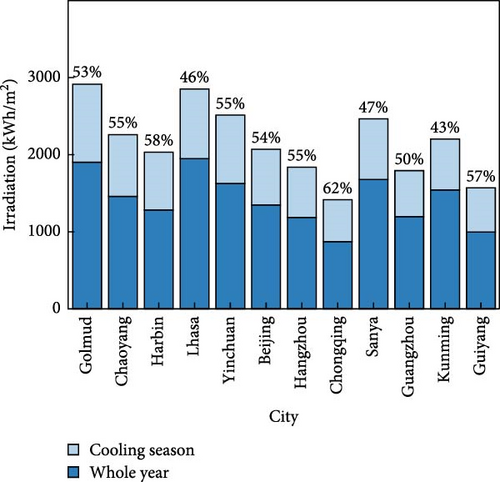
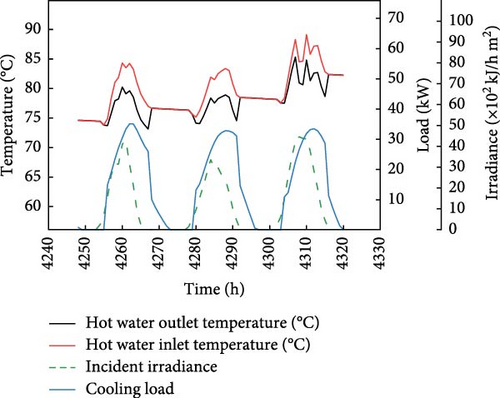
The SADC established in this study, which utilizes a novel adsorbent, is applied to the reference office buildings in various climatic zones in China. With a simulation time step of 1 h, the proposed system provides a comprehensive reflection of its operational status. Figure 4a illustrates the annual horizontal irradiation and the proportion of irradiation during the cooling season in various investigated cities. Evidently, in all climatic zones, the irradiation during the cooling season accounts for over 46% of the annual irradiation, showing a temporal alignment between the availability of solar radiation and the need for cooling. This further reinforces the feasibility of solar-powered refrigeration. To demonstrate the dynamic behavior of the SADC, three representative summer days in Beijing are considered, as shown in Figure 4b. Table 6 summarizes the main input parameters in the system. The coupling of the ETC equipment and the hot water storage tank ensures a stable and relatively high hot water temperature. Meanwhile, by scheduling the cooling operation to run from 7 : 00 AM to 7 : 00 PM, while meeting the cooling demands of office buildings, the impact of solar intermittency resulting from diurnal variations can be significantly mitigated. These approaches ensure that the solar thermal collector can provide sufficiently hot water to the chiller, regardless of whether solar radiation is intermittent. It is worth noting that variation in solar radiation intensity has an immediate effect on hot water temperature. From the image, the trend of hot water temperature closely follows the fluctuations in solar radiation intensity. However, there is a noticeable delay in the impact of solar radiation on the cooling load, revealing a dynamic relationship between solar radiation and cooling load. This suggests that monitoring solar radiation could enable predictions of cooling load, thereby achieving dynamic control over the entire cooling system.
| Parameter | Unit | Value | Parameter | Unit | Value |
|---|---|---|---|---|---|
| Collector area | m2 | 399.84 | Tank volume | m3 | 60 |
| Vrew | m3/h | 16 | Vhw | m3/h | 12 |
| Vclw | m3/h | 20 | Vchw | m3/h | 6 |
| Trew,in | °C | 60–95 | Tclw,in | °C | 10–32 |
| Tchw,out | °C | 12 | — | — | — |
3.3. Energy Performance Assessment
The SHR calculation results are presented in Figure 5a. It should be noted that Guangzhou and Sanya are located in hot summer and warm winter zones with almost no heating demand, hence no SHR data are available for these two cities. Generally, the thermal load of the building is lower than its cooling load. Therefore, in most climatic zones, the SADC can provide more energy than is required for heating in winter, which means SHR is greater than 1, effectively meeting the heating demand. This implies that the SADC can be employed during winter to reduce energy consumption and heating costs, thereby shortening the PBP of the SADC and enhancing its economic viability. Moreover, this offers a feasible solution for the construction of distributed heating systems in cities of Southern China where central heating is not available.
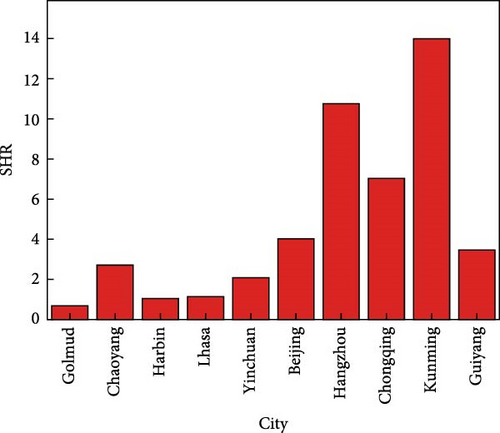
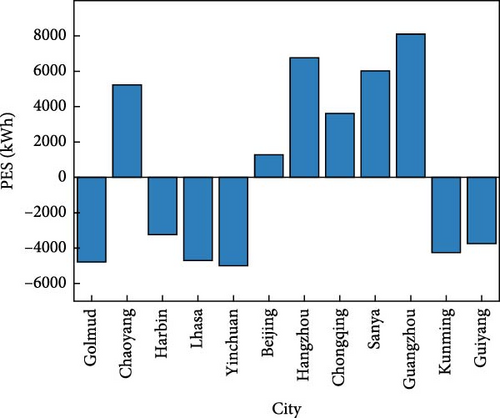


Figure 5b illustrates the primary energy savings for each city. It is worth noting that although the adsorption chiller itself consumes minimal electricity, the solar thermal system introduces additional power-consuming components such as solar loop pump and regeneration loop pump compared to traditional systems. Moreover, due to the heat generated during the adsorption process, a larger cooling water flow rate is required. Consequently, the solar thermal system still consumes a considerable amount of electricity during operation. As observed from the figure, the SADC does not always yield significant energy savings in all zones. There are three main reasons for this: first, the energy consumption of VCC primarily stems from the operation of the chiller, which is closely related to changes in cooling load. Conversely, the energy consumption of the SADC is influenced not only by the cooling load but also by multiple factors such as solar radiation and ambient temperature. Therefore, under conditions of low cooling loads, the reduction in energy consumption of VCC may be more significant, while the SADC may experience a relatively smaller decrease due to the need for continuous collection of solar energy to maintain system operation. This difference can lead to higher electricity consumption for SADC compared to VCC under certain conditions. Second, in terms of research methodology, this study aims to explore the feasibility of renewable energy refrigeration technology in depth, therefore no auxiliary heating equipment is set up. However, to ensure the continuous and stable operation of the system, this methodology may require additional collector area and water tank volume during a few extreme weather conditions, resulting in increased pump flow and energy consumption. Furthermore, dynamic regulation of the system is not considered in this study. Solar thermal systems show significant temporal fluctuations due to their reliance on natural light sources. In the absence of dynamic adjustments based on real-time demand, the system still maintains a high water pump flow rate even when the energy captured by the collector or the heat demand of the chiller decreases. This not only reduces the heat transfer efficiency of the system but also leads to unnecessary pump energy losses.
Figure 5c illustrates the correlation between the PESR and the cumulative cooling load during the cooling season in the studied cities. Generally, the trend of the PESR aligns with the variation in total cooling load across different cities. The application of SADC proves beneficial in terms of primary energy conservation only in cities with higher cooling loads. Since reducing energy consumption is the primary objective of replacing traditional systems with solar thermal systems, the SADC is more suitable for hotter zones with higher summer cooling loads, specifically in hot summers and cold winters zones, hot summers and warm winters zones, and similar cities of other climatic zones.
3.4. Environmental Performance Assessment
The results of the environmental analysis are presented in Figure 5d. Although mainstream refrigerants, represented by R22 and R410a, have an ODP of zero, they still possess a relatively high GWP. Consequently, even though the SADC may consume more primary energy and generate higher direct CO2 emissions in cities with lower cooling loads, the use of water as the refrigerant in ADC reduced indirect CO2 emissions caused by refrigerants, thus enabling the SADC to show good emission reduction effects in all zones.
Furthermore, by the end of 2022, the central heating area in China had reached 11.125 billion m2, which is approximately twice that of 2013 [65]. According to previous calculations by the Building Energy Efficiency Research Center of Tsinghua University, the energy consumption for heating in Northern Chinese towns and cities had already reached 212 million tons of standard coal in 2018, with carbon emissions of ~550 million tons. As mentioned earlier in this paper, the SADC can effectively meet the heating needs of buildings during winter in most climatic zones. Therefore, employing the SADC for decentralized heating in winter, partially replacing coal-based central heating, can significantly reduce carbon emissions and coal consumption, which also carries certain economic significance.
3.5. Economic Feasibility
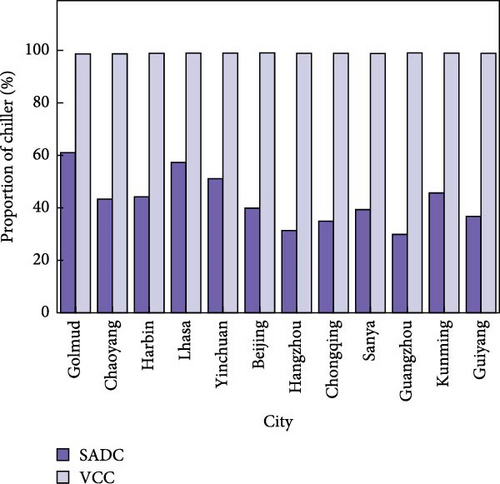
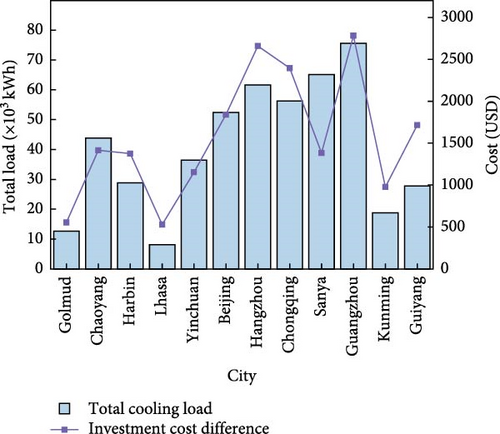
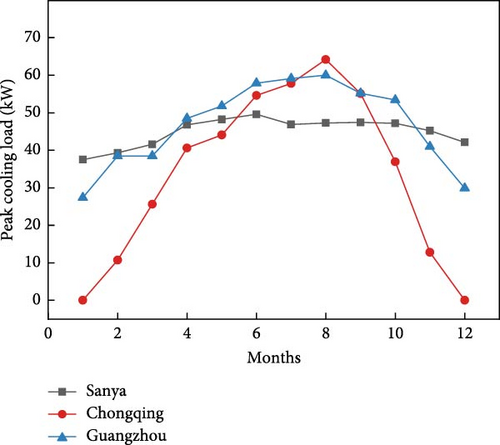
Table 7 presents the economic analysis results of the SADC in various investigated cities. Due to the additional investment for the solar field, the LCC of the SADC is ~2–4 times higher than that of the VCC. However, considering the shorter lifetime of VCC, more frequent replacement of components or even the entire system is required during its operational life, increasing extra maintenance costs. Furthermore, a shorter lifetime implies faster degradation of energy efficiency, further escalating the system’s operating costs. In contrast, the SADC, with its longer design life and superior durability, is capable of maintaining stable performance output over an extended period. From a long-term operational perspective, the SADC possesses a distinct cost advantage. Therefore, when the CRF is applied to levelize the system’s costs within the same timeframe, the gap between the levelized total costs of the SADC and VCC narrows to a range of 1.4–2 times. Figure 6a illustrates the proportion of chiller cost to total investment costs for both the SADC and VCC. For SADC, due to the additional investment in solar collectors, the chiller cost only accounts for ~30%–60% of the total. In contrast, the chiller cost of the VCC accounts for over 98% of the entire system’s CI. Therefore, since the cost of chiller is only related to capacity in this study, variations in cooling load have a more pronounced impact on the VCC’s total investment cost compared to the SADC. Consequently, as depicted in Figure 6b, for most cities, a higher cooling load leads to a wider difference in CI costs between the SADC and VCC. It is noteworthy that despite Sanya, located in the hot summer and warm winter zone, having a higher total load input than Hangzhou and Chongqing, located in the hot summer and cold winter zone, its annual cooling load is more evenly distributed, with a peak load of only 49.6 kW—lower than Guangzhou’s 60.2 kW and Chongqing’s 64.2 kW, as shown in Figure 6c. This more uniform distribution of cooling load contributes to a smaller investment gap in Sanya compared to other cities.
| City | CItot,L,SADC (USD) |
CItot,L,VCC (USD) |
LCCSADC (USD) |
LCCVCC (USD) |
PBP (year) |
NPV (USD) |
IRR (%) |
|---|---|---|---|---|---|---|---|
| Golmud | 2066.51 | 1513.09 | 25,753.27 | 9779.43 | −4.99 | −1612.50 | — |
| Chaoyang | 3885.18 | 2470.10 | 48,417.96 | 15,964.81 | 8.14 | 857.64 | 51.90 |
| Harbin | 3381.69 | 2006.01 | 42,143.28 | 12,965.28 | −28.47 | −1910.81 | — |
| Lhasa | 1610.90 | 1081.18 | 20,075.36 | 6987.88 | −4.25 | −1687.07 | — |
| Yinchuan | 3336.04 | 2183.20 | 41,574.48 | 14,110.49 | −12.30 | −2146.68 | — |
| Beijing | 4310.19 | 2470.93 | 53,714.47 | 15,970.16 | 22.84 | −873.81 | 24.62 |
| Hangzhou | 5297.24 | 2638.89 | 66,015.27 | 17,055.70 | 12.73 | −61.63 | 62.74 |
| Chongqing | 5032.10 | 2637.97 | 62,711.11 | 17,049.75 | 17.44 | −725.32 | 42.80 |
| Sanya | 3670.92 | 2288.49 | 45,747.83 | 14,791.01 | 7.64 | 1003.78 | 49.67 |
| Guangzhou | 5428.68 | 2647.72 | 67,653.40 | 17,112.76 | 11.66 | 208.11 | 70.32 |
| Kunming | 2376.56 | 1399.95 | 29,617.17 | 9048.14 | −10.18 | −1978.22 | — |
| Guiyang | 3486.99 | 1771.67 | 43,455.65 | 11,450.70 | −22.54 | −2550.69 | — |
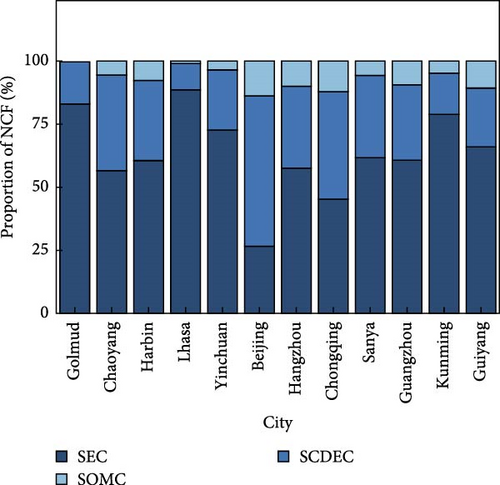
The PBP is defined as the ratio of the initial investment cost of the system to the annual cash inflow and refers to the time required to recover the initial investment. The calculation result reflects the time required for the system to achieve profitability from the start of the investment. Given that the SADC is an energy-consuming system without direct cash revenue, the present study uses the VCC as a reference system. The additional initial CI of the SADC compared to the VCC is considered as the initial cost of the proposed system, while the costs of energy, carbon emissions, and operation and maintenance saved by the SADC are considered as annual cash inflow. Thus, the actual PBP represents the time needed for the SADC to recoup its additional costs due to long-term economic advantages during operation. Figure 6d illustrates the proportion of each component in the NCF. In most zones, saved EC account for more than half of the NCF. Therefore, the PBP of the SADC is largely influenced by the SEC. In cities with poor energy performance, it is difficult to achieve positive cash flow, even if cost savings are achieved in CO2 emissions and operation. This results in a PBP less than 0, making it challenging to recoup the additional CI. The PBP calculation results are shown in Table 7. Six cities located in severe cold, cold, and mild zones, including Golmud, Lhasa, Yinchuan, Harbin, Kunming, and Guiyang exhibit negative PBPs. This indicates that the SADC has poor economic performance during the expected operation period, resulting in long-term losses and an inability to recoup additional costs in the future. Compared to the VCC, its economic feasibility is lower. However, in the remaining cities (Chaoyang, Beijing, Hangzhou, Chongqing, Sanya, and Guangzhou), the SADC is expected to recoup the additional investment costs through economic advantages during operation within a certain period. It is worth noting that among these six cities, Beijing, located in cold zone, has the longest PBP of 23 years, exceeding the lifetime of SADC. This implies that the cost cannot be fully recovered within its entire service life. From the traditional PBP perspective, investing of SADC in Beijing is not an economically attractive choice. Therefore, factors such as technological advancements and financial subsidies that may influence future operating costs still need to be considered during decision-making. Additionally, the SADC shows the most significant economic advantage compared to the VCC in Sanya which is located in hot summer and warm winter zone, with a PBP of only 7.7 years, indicating strong market competitiveness.
The PBP primarily focuses on the speed of capital recovery, considering only the project’s cash flow, while ignoring the time value of money, profitability, and risk level of the system. Therefore, in this study, NPV and IRR are also employed as indicators for economic analysis. Among the six cities with positive PBPs, Beijing, Hangzhou, and Chongqing which are located in the cold, hot summer, and cold winter zones demonstrate negative NPVs, implying that despite the SADC can generate positive cash flow and recoup investments in these three cities during long-term operation, the high initial investment costs and lower future cash inflows, when considering the time value of money, result in a later time to profitability or smaller profit amounts, leading to a lower expected rate of return. Conversely, Chaoyang, Sanya, and Guangzhou exhibit positive NPVs, indicating that the project’s expected earnings, after considering the time value of money, still exceed its costs. This suggests a good return on investment and economic attractiveness. Furthermore, all six cities show positive IRRs, indicating that the investment is expected to generate a return greater than the cost of capital, capable of generating positive cash flow in the long term.
After conducting a comprehensive analysis of these three criteria and the investment cost difference, it has been observed that the SADC demonstrates poorer economic feasibility in colder zones such as Golmud, Lhasa, Yinchuan, Harbin, Kunming, and Guiyang compared to VCC, potentially requiring policy incentives to further reduce initial costs. Conversely, In Beijing, Hangzhou, and Chongqing, SADC possesses potential profitability and cash flow generation abilities, enabling it to achieve a certain earning in the long term without relying on external investments, albeit with limited profitability that may not cover all costs. Moreover, Chaoyang, Sanya, and Guangzhou exhibit strong performance in terms of payback speed, long-term profitability, and return on investment, showing excellent economic benefits and high investment attractiveness.
3.6. Comparison with the SABC
Figure 7a presents the average COP during the cooling season for various cities under investigation. The adoption of AlPO-SFO as adsorbent has significantly enhanced the COP of the adsorption chiller compared to traditional adsorbents such as silica gel and activated carbon, a more detailed performance comparison of different adsorbents at the prototype scale can be found in [44]. However, at lower temperatures, the performance of ADC cycles still remains lower than reported absorption chillers [66]. Nevertheless, even with such performance, due to the lower driving temperature, the required collector area for ADC is less than or equal to that of ABC in all the investigated cities. This further demonstrates the potential of adsorption technology as a viable replacement for absorption technology in the future. Figure 7b presents the correlation between the CSR and the horizontal irradiation during the cooling season in the investigated cities. As observed from the figure, there is a negative correlation between irradiation and the CSR across various cities within the same building thermal design zone. The primary reason for this trend is that in zones with abundant solar energy resources, solar thermal systems can more easily maintain higher driving temperatures. In addition, the efficiency of solar collector is closely correlated with irradiance. Under conditions of lower irradiance, the thermal efficiency of the collector decreases, implying that a larger collector area is necessary to achieve the same heat output. Since the absorption system requires higher temperatures, the reduction in thermal efficiency has a more significant impact on the demand for collector area under low irradiance conditions.
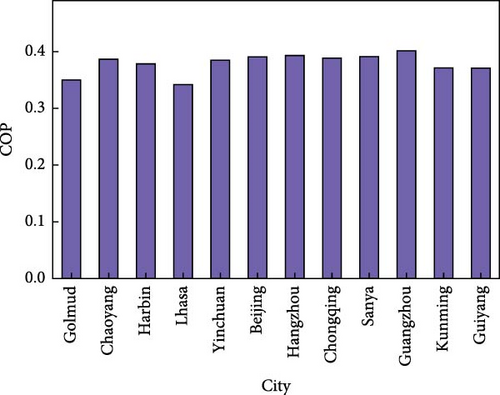
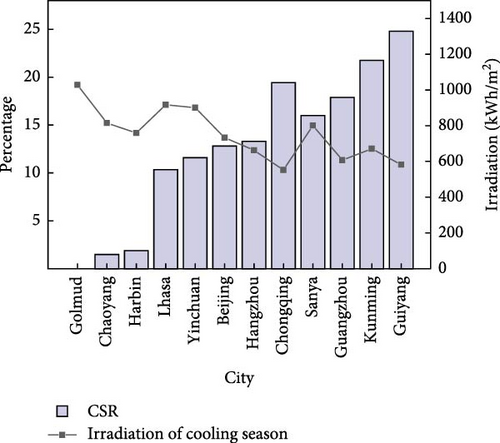
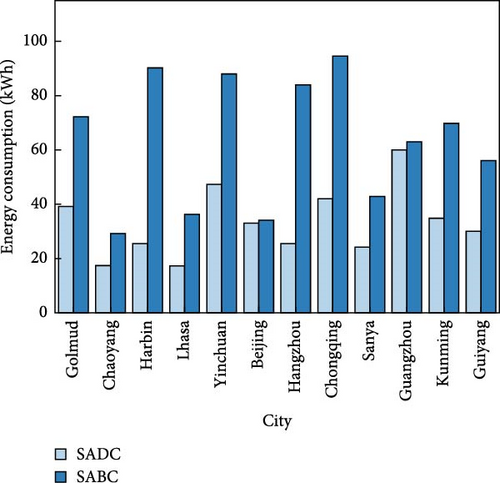

Figure 7c,d presents a comparison of the preheating energy consumption and preheating time required for the SADC and the SABC in various cities. As evident from the figures, despite the absorption system having a larger collector area, its higher driving temperature results in higher preheating energy consumption and longer preheating time in all cities compared to the adsorption system. This implies the superior energy efficiency and faster startup speed of the ADC technology during the preheating process, enabling a more flexible response to cooling demands while consuming less energy and highlighting the significant technical potential of ADC technology. However, since only the solar loop water pump requires activation during the preheating process, the preheating energy consumption only accounts for 0.24%−1.33% of the total operating consumption, thereby having a relatively low impact on the system’s economy.
4. Conclusion
- a.
The energy analysis results show that the SHR values exceed 1 in most zones, significantly enhancing the economic efficiency of the SADC and offering a practical solution for distributed heating construction in China. Moreover, the PES shows a correlation with the cooling load. In hotter zones (such as Guangzhou and Hangzhou), the SADC shows notable energy-saving effects, achieving a maximum saving of 23.22% in primary energy consumption. Conversely, in colder zones (such as Lhasa and Golmud), the performance is not as significant and may even lead to additional consumption in some cases. As for environmental analysis, the results show that the SADC can considerably reduce CO2 emissions, even in zones with poor energy-saving performance. Specifically, in certain hotter zones, the proposed system can save up to 46.55% of CO2 per year. When winter heating needs are taken into account, this figure is expected to increase considerably. However, the economic performance varies significantly across different cities. The proposed system shows substantial economic benefits and investment attractiveness in hotter zones. Conversely, in colder zones, economic feasibility is weaker, related policy support is required to further reduce CIs.
- b.
The employment of the AlPO-SFO and lower driving temperature reduce the required collector area for SADC compared to the SABC under equivalent operating conditions, with a maximum saving of 24.8%. It is worth noting that the system’s CSR demonstrates a negative correlation with the solar irradiation within the same thermal design zone. Consequently, the cost advantage of the SADC may be less pronounced in zones with rich solar radiation. Considering the more advanced technological status of SABC, the proposed system appears to be less competitive in these zones. Furthermore, the lower driving temperature facilitates a reduction in preheating energy consumption and a shorter preheating time for the SADC. This highlights the system’s superior energy efficiency and rapid response time, revealing the significant technical potential of adsorption refrigeration technology.
- c.
The presented results clearly demonstrate the considerable advantages of the SADC in hotter zones. Its notable energy-saving capabilities and substantial potential in reducing carbon footprint, coupled with an affordable capital cost, in zones with high cooling loads, make it a strong competitor to the VCC and SABC. Furthermore, the corresponding policy incentives and advancements of adsorption refrigeration technology are expected to further enhance application feasibility in colder zones.
This work elucidates the substantial potential of ADC technology in the domain of low-temperature solar thermal utilization. However, although the simulation model developed in this study, based on experimental data, accurately reflects system performance under specific conditions, it faces limitations in comprehensively and flexibly exploring the influencing factors of system performance. Consequently, future work will be directed toward the development of a more detailed chiller model and will undertake further investigations into the optimization strategies of ADC system. These efforts are expected to enhance system performance and improve the overall feasibility of practical applications.
Nomenclature
-
- A:
-
- Heat transfer surface area (m2)
-
- ABC:
-
- Absorption cooling
-
- ADC:
-
- Adsorption cooling
-
- c:
-
- Cost (USD)
-
- CDE:
-
- Carbon dioxide emission (kg)
-
- CDEC:
-
- Carbon dioxide emission cost (USD)
-
- CI:
-
- Capital investment (USD)
-
- COP:
-
- Coefficient of performance
-
- CRF:
-
- Capital recovery factor
-
- CSR:
-
- Collector saving rate
-
- E:
-
- Energy (kWh)
-
- EC:
-
- Energy cost (USD)
-
- EF:
-
- Emission factor
-
- ETC:
-
- Evacuated tube collector
-
- GT:
-
- Global solar irradiance on the tilted collector (kJ/h m2)
-
- GWP:
-
- Global warming potential
-
- i:
-
- Interest discount rate
-
- IRR:
-
- Internal rate of return
-
- LCC:
-
- Lifecycle cost (USD)
-
- m:
-
- Quality (kg)
-
- n:
-
- Plant lifetime (year)
-
- NCF:
-
- Net cash flow (USD)
-
- NPV:
-
- Net present value (USD)
-
- ODP:
-
- Ozone depletion potential
-
- OMC:
-
- Operating and maintenance cost (USD)
-
- PBP:
-
- Payback period (year)
-
- PE:
-
- Primary energy
-
- PEC:
-
- Primary energy consumption (kWh)
-
- PEF:
-
- Primary energy factor
-
- PES:
-
- Primary energy saving (kWh)
-
- PESR:
-
- Primary energy saving rate
-
- Q:
-
- Heat transfer rate (kW)
-
- r:
-
- Rate
-
- SCDEC:
-
- Saved carbon dioxide emissions cost (USD)
-
- SEC:
-
- Saved energy cost (USD)
-
- SOMC:
-
- Saved operating and maintenance cost (USD)
-
- SHR:
-
- Solar heating rate
-
- T:
-
- Temperature (°C)
-
- USD:
-
- Dollar
-
- V:
-
- Volume flow rate
-
- Z:
-
- Purchased equipment cost (USD)
Greek symbols
-
- α:
-
- Characteristic coefficient
-
- η:
-
- Thermal efficiency
-
- Δ:
-
- Difference
Subscripts
-
- aux:
-
- Auxiliary equipment
-
- chw:
-
- Chilled water
-
- clw:
-
- Cooling water
-
- el:
-
- Electricity
-
- H:
-
- Heating
-
- hs:
-
- Heating season
-
- hw:
-
- Hot water
-
- in:
-
- Inlet
-
- INS:
-
- Installation
-
- lr:
-
- Leakage rate
-
- L:
-
- Levelized
-
- pd:
-
- Production and distribution
-
- rew:
-
- Regenerated water
-
- SABC:
-
- Solar absorption cooling
-
- SADC:
-
- Solar adsorption cooling
-
- SC:
-
- Solar collector
-
- tot:
-
- Total
-
- VCC:
-
- Vapor compression cooling
Conflicts of Interest
The authors declare no conflicts of interest.
Author Contributions
Degen Zhou: data curation, formal analysis, investigation, methodology, software, validation, writing–original draft. Min Xu: conceptualization, resources, validation, writing–review and editing. Yuqi Zhang: investigation. Xunfeng Li: project administration. Xiulan Huai: supervision.
Funding
This work was supported by Strategic Priority Research Program of the Chinese Academy of Sciences (grant no. XDA0400102) and special funds for Science and Technology Innovation of Carbon Peaking and Carbon Neutrality in Jiangsu Province (Major S&T Demonstration, no. BE2022614).
Open Research
Data Availability Statement
The data that support the findings of this study are available from the corresponding author upon reasonable request.


