A Robust Control Method for Reliability Improvement of Cascade H-Bridge STATCOM Under DC-Link Capacitance Uncertainty
Abstract
This paper proposes a robust DC-link voltage controller designed for a multilevel-based static synchronous compensator (STATCOM), addressing both DC-link capacitance degradation and load variations. The uncertainty in DC-link capacitance is modeled as an external perturbation, leading to the development of a second-order sliding mode controller (SOSMC) based on a twisting algorithm. This controller effectively manages these uncertainties, providing high stability and robustness against parameter variations and external disturbances. Furthermore, it reduces unwanted chattering and enhances overall system performance. The impact of DC-link capacitance uncertainty on the reliability of multilevel converters is analyzed, comparing the proposed SOSMC with traditional proportional–integral (PI) controllers in the Simulink MATLAB environment. The results demonstrate that the SOSMC method outperforms the PI controller under 33% uncertainty in DC-link capacitance over 5 years. The proposed control scheme not only meets reactive power demands but also effectively manages uncertainties in DC-link capacitors. Additionally, the twisting algorithm maintains an acceptable total harmonic distortion (THD) index on the AC side, thereby improving overall reliability while reducing maintenance costs.
1. Introduction
The reliable and optimal operation of high-power static synchronous compensators (STATCOMs) is crucial for addressing the challenges faced by modern power grids. These challenges include reactive power demands, nonlinear loads, and unbalanced conditions [1]. STATCOMs provide responsive reactive power control and thus help to stabilize grid voltage, improve power factor, and enhance overall power quality [1]. Maintaining the reliability of these critical compensators is paramount to ensuring the secure and efficient operation of modern power systems.
Since a common two-level converter cannot correct the desired output voltage in high-power applications, it is necessary to use a multilevel converter. Among different multilevel topologies, the cascade H-bridge (CHB) converter is an appropriate choice in STATCOM applications because of its modularity and scalability, especially for high-voltage, high-power applications [2, 3].
In CHB converters, the high number of submodules can negatively impact the overall reliability of the STATCOM system. In this regard, DC-link capacitors contribute to nearly 30% of component failures [4]. Both aging and cell/fuse failures (e.g., thermal and electrical stresses) can degrade DC-link capacitance, leading to an increase in DC-link voltage ripple, fluctuations in grid currents, and an increase in the AC-side current total harmonic distortion (THD) index [5]. This condition not only impacts the optimal performance of the system but can also lead to unexpected outages. The greater the degradation of DC-link capacitance is, the more the result is pronounced. THD can further exceed the permissible range provided by the IEEE 519 standard. Although it does not directly cause a problem, it prompts unstable modes and activates the protection devices to disconnect the entire STATCOM system if the degradation continues [6]. To address this issue, several effective methods must be employed to enhance the system’s reliability while considering the required level of maintenance [7]. These methods cannot only reduce the required repairs and maintenance but also significantly decrease the probability of STATCOM shutdown [8].
Reliability can be improved in the design phase (before operation) using different modification techniques such as reliability-oriented design [9, 10] and analytical analysis [11, 12]. Adding redundant cells [7] can be also helpful in ensuring the reliable operation of the converter after a predefined number of failures. Sousa et al. [11] proposed a reliability-oriented design with redundancy factor selection in a 13.8 kV/17 MVA multilevel STATCOM. Additionally, a redundancy-based fault tolerant strategy has been proposed in [13] to enhance reliability and extend the useful lifetime in postfault conditions.
Instead of the design phase, the reliability can be also examined in the operational phase (during operation) via condition monitoring [14] and fault tolerant control methods [15]. Proposing a new effective control scheme (DC-link control while limiting THD on the load side) is vital to guarantee the STATCOM’s reliable performance without interruption under faulty conditions [16]. This finally leads to a relatively lower need (cost) for repairs and maintenance over a long-term period.
The control schemes in STATCOM are typically implemented in three different stages: DC-link average voltage control, output current control, and capacitor voltage balancing. First, the DC-link voltage control loop is primarily used to eliminate DC-link voltage ripple, followed by a current control loop to inject or absorb reactive power [17]. In the field of modular multilevel STATCOMs, different linear and nonlinear current control schemes are reviewed in [18]. Due to the nonuniform instantaneous active power distribution among cells, an individual DC-link voltage balancing scheme is finally applied by either exploiting switching redundancy [19] or adding a compensating term to the modulation voltage [20].
These controllers are mainly classified into linear and nonlinear methods. Linear controllers, such as proportional-resonance (PR) [17] and proportional–integral (PI) [21] have obtained significant attention in both academic and industrial due to their simplicity. However, they are not model-based and cannot consider uncertainty in the system’s model. Therefore, various nonlinear methods have devoted considerable attention to STATCOM applications, addressing uncertainty, perturbations, and load fluctuations. They include hysteresis control [22], fuzzy control [23], backstopping control [24], model predictive control [25], and neural network passivity-based control [16]. In all aforementioned works, the reliability concern with a specific focus on the capacitor bank (CB) faults has not been addressed yet.
Focusing on reliability, an adaptive nonlinear control algorithm is proposed in [26] to regulate the DC-link voltage of grid-connected converters. An adaptive controller is also introduced in [4] to improve converter reliability by controlling the cell reference voltages based on the minimum required voltage in each operational condition. Sajadi et al. [19] presented a modification mechanism based on modulation index magnitude to regulate the DC-link voltage set-point. In all mentioned studies, the robust DC-link controller is effectively utilized at a lower complexity while achieving the control objectives (improving reliability) efficiently.
In power electronics applications, sliding mode control (SMC) has recently been recognized as a promising method [27] due to its inherent robustness against parameter variations and external disturbances. In this regard, several research studies and practical applications have especially focused on the challenges of implementing SMC in power electronics systems, such as [28] highlighting its industrial applications. However, the implementation of SMC in practical settings also faces certain limitations in real-word such as chattering phenomena, which can result in high-frequency switching and increased system complexity. Furthermore, the appropriate design of sliding surfaces and reaching conditions requires careful consideration to ensure stable and optimal system performance. Ongoing research continues to explore advanced SMC techniques aimed at overcoming these limitations and further enhancing the applicability of SMC in power electronics and other real-world systems [28]. To achieve this goal, the second-order SMC (SOSMC), for example, twisting SMC, not only addresses these aforementioned key concerns but also provides higher accuracy and superior tracking performance in dynamic environments [27]. A SOSMC is also developed in [29] for a three-level four-leg D-STATCOM based on symmetrical components. A fractional-order SMC has been proposed in [30] for the D-STATCOM application, considering its parametric variations in the outer current loop. A SMC has been studied for D-STATCOM application considering DC-link voltage variations [8]. The presented controller is robust against DC-link uncertainties and load variations, offers low current THD in steady-state conditions, and enhances the system’s reliability and stability margins.
- •
PI controllers are often ineffective in handling uncertain conditions over extended periods. Since the reduction in DC-link capacitance can be modeled as an external perturbation in the DC-link equations, there is a need for a robust controller to handle this uncertainty. This paper presents a SOSMC to address the uncertainty in DC-link capacitance.
- •
Existing literature largely focuses on developing robust SMCs, but reliability concerns in STATCOM control remain underexplored. In a three-phase multilevel converter, the high number of cells increases the probability of failure, which can lead to lower reliability. Typically, reliability improvements are made during the design phase rather than during actual operation causing higher initial costs. This study investigates the positive impacts of a DC-link voltage controller on reliability, operational lifespan, and required maintenance intervals of a multilevel CHB-based STATCOM system. Consequently, we have developed a new SOSMC approach aimed at enhancing reliability while decreasing the THD index on the AC side during real-time STATCOM operations without incurring additional costs.
- •
Primarily, reliability improvements are achieved during the design and operational phase through redundancy assessment and maintenance intervals, which impose additional initial and operational costs on the system. It is important to consider whether to incur higher initial costs for redundancy or to enhance the expected lifetime through a control system, thereby decreasing the maintenance intervals. Implementing the proposed SOSMC method results in an increased lifespan of the STATCOM and a reduced need for redundancy and maintenance intervals, ultimately contributing to the system’s cost-effectiveness.
- •
A novel SOSMC scheme is proposed for controlling the DC-link voltage in a multilevel STATCOM.
- •
Compared to the PI controller, the SOSMC demonstrates superior capability in maintaining the THD index within acceptable limits for extended periods, showcasing improved reliability due to its robustness and handling of structural uncertainties.
- •
The proposed SOSMC method leads to higher reliability, reduced maintenance intervals, and consequently lower operational and initial costs.
The rest of the paper is organized as follows: Section 2 discusses the modeling of the CHB-based STATCOM system. Section 3 provides details of the controllers and their formulation. In Section 4, we present our proposed twisting-based SOSMC. Section 5 presents the simulation results. Finally, we conclude the paper in Section 6.
2. STATCOM and Uncertainty Modeling
An appropriate model of the AC side of the STATCOM is necessary for the design of the controller. In this section, we develop a mathematical model for multilevel STATCOM applications. Figure 1 shows a CHB-based STATCOM. As illustrated in Figure 1a, it consists of a multilevel cascade-voltage-source converter with separate DC-link capacitors. The coupling inductors in each phase (La, Lb, Lc) act as current harmonic filters mainly created by modulation. Since the stray inductance of connections and cables (L1a, L1b, L1c) is much smaller than the filter inductance, they can be ignored in the converter modeling. Each cell contains four switches with antiparallel diodes and one DC-link capacitor (CSM) as depicted in Figure 1b. The sum of nominal value (C0) and uncertainties (ΔC) in the equivalent capacity can be considered as CSM = C0 + ΔC to account for capacitor uncertainness. Furthermore, the switching and conduction losses in each cell are modeled with a parallel resistor (RP).
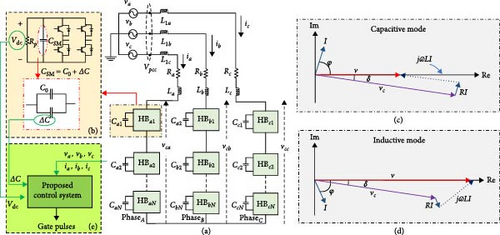
The control system in STATCOM regulates the output reactive current by controlling the fundamental voltage on the AC side of the converter. Additionally, the active power flowing from the grid to the STATCOM is controlled by introducing a small phase shift (δ) between the grid voltage and the AC voltage at the terminals of the H-Bridge. This helps compensate for the losses in the H-bridge cells which are estimated at ~5% of the nominal power of the voltage source converter (VSC) [8]. Figure 1c,d shows the CHB-STATCOM phasor diagram in the inductive and capacitive modes. As it is shown, the reactive power is injected into or absorbed from the grid by STATCOM (capacitive/inductive mode), when vc = (vca, vcb,vcc) is greater or smaller than v = (va, vb, vc).
2.1. AC Side Modeling
According to Equations (3) and (4), the active power reference is derived from the output of average DC-link voltages, while the reactive power reference (Qref) can be set by the external control system. Consequently, the q-axis current reference is determined by .
2.2. DC Side Modeling
Since capacitance uncertainty manifests as external perturbations (ΔU) in the model, the conventional PI controller cannot effectively handle these perturbations and does not demonstrate satisfactory dynamic performance. This term must be included in the DC-link voltage control system, as illustrated in Figure 1e. Thus, a SOSMC controller based on a twisting algorithm is introduced and investigated in the following section.
3. Control Scheme
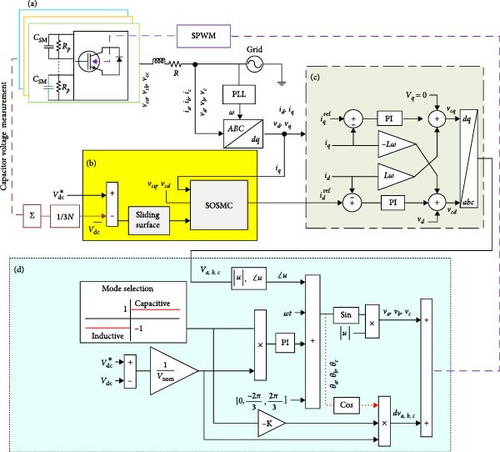
Figure 2 illustrates the proposed overall control scheme for multilevel-based STATCOM. Figure 2a shows the H-bridge converter connected to the grid, while the subsequent sections (Figure 2b–d) depict the various components of the control system. This control scheme aims to achieve the following objectives:
- a.
Control the average DC-link voltage to determine the d-axis current reference (Figure 2b).
- b.
Manage the exchange of reactive power transmitted between the converter and the PCC point through current control (Figure 2c).
- c.
Control the DC-link capacitor voltage to ensure voltage balancing across all cells (Figure 2d).
The DC-link voltage controller operates within the primary control loop to regulate DC-link capacitor voltages in each phase and generates the required d-axis current reference for the secondary loop. The current controller then subsequently produces the reference signals for the PWM modulator to inject or absorb the required reactive power (Figure 2d) [24].
As indicated in Figure 2d, the outer loop facilitates the control of all individual DC-link voltages by effectively exchanging active power with the grid. A balanced voltage across each cell is achieved by incorporating a compensation term into PS-PWM modulation. Consequently, the modulator plays a crucial role in determining the switching performance of the converter. As shown in Figure 2d, a DC term (vA, vB, vC) and a complementary term (dvA, dvB, dvC) are combined to form the reference voltage of each H-bridge. The DC term is derived from the mean DC capacitor voltage and easily provides the jth phase-clustered balancing control signal (vA, vB, vC).
The DC term is a vector that is in phase with the input current and is added to the complementary term. This DC term compensates for the unequal power losses in the H-bridge cells. For the j-phase of the ith converter, the PI controller tracks each H-bridge DC voltage (vdc,i,j) as well as the actual average capacitor voltage (). To adjust, they are multiplied by the cosine of the reference current angle, and reference phase voltages (vA, vB, vC) are added. By now, the active and reactive powers are equally shared among the cells.
As mentioned above, uncertainty in the DC-link capacitance significantly impacts the control performance of the CHB converter. Capacitor failure can lead to a degradation of the DC-link voltage, resulting in voltage divergence among the capacitors. This may cause unacceptable voltage drop or overvoltage due to non-uniform power distribution across the cells. Therefore, implementing an effective DC-link control scheme is crucial.
The following sections outline the developed SOSMC-based DC-link control scheme designed to address these challenges.
4. Proposed DC-Link Controller
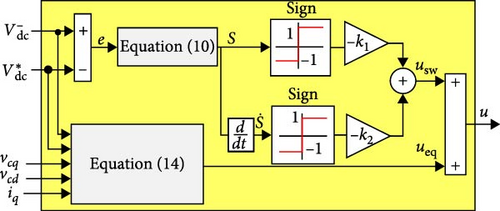
In this section, a second-order sliding-mode controller is designed based on predefined state variables to tackle the challenges mentioned earlier. SMC involves defining a sliding surface (S) that guarantees Lyapunov stability, guiding the system states toward an equilibrium point. Additionally, an appropriate control law (u) is implemented to ensure that the system trajectory not only approaches the equilibrium point (ueq) but also remains on the sliding surface (usw). While a first-order SMC controller can reduce the sliding variables to zero, it cannot deal with zeroing the derivatives of these variables effectively. As a result, even minor fluctuations in the sliding variables can lead to the chattering in the control signal.
This can be mitigated by designing a control signal that aims to set the first derivative of the sliding variable to zero. This approach facilitates the convergence of system trajectories in the plane toward the equilibrium point, thereby enhancing the overall stability and performance of the control system [27].
This expression for ueq is critical for ensuring that the system remains on the sliding surface, thereby achieving the desired performance criteria. Besides, the subsequent component of the control law addresses dynamic behavior and facilitates the system’s response to parametric uncertainty.
This formulation integrates both the equivalent control and the discontinuous control components, ensuring the system’s stability and convergence to the sliding surface. Figure 3 shows the structural schematic of the proposed SOSMC controller. The relevant SOSMC parameters (k1, k2) are essential for deriving the final control law. Consequently, the second derivative and the first derivative be utilized to establish the defined boundary limits for usw as follows.
These conditions are crucial for guaranteeing the performance and stability of the sliding-mode control system as outlined in [32].
Subsequently, the stability of the proposed controller is maintained throughout the sliding phase.
5. Results and Discussion
This section focuses on validating the performance of the developed SOSMC design presented in Section 3. To evaluate the effectiveness of the SOSMC, a three-phase CHB-based STATCOM has been utilized, consisting of 13 power cells per phase. The converter is configured as shown in Figure 1, with a compensation capacity of 10 Mvar, and is connected to a 20 kV voltage network. Additionally, the PWM phase-shift modulation method has been implemented. Relevant technical parameters associated with the STATCOM and control schemes are summarized in Tables 1 and 2, respectively.
| Converter | |||
|---|---|---|---|
| Symbol | Value | Symbol | Value |
| S (MVA) | 10 | 20 | |
| L (mH) | 4.2 | C (mF) | 9.2 |
| f (Hz) | 50 | fsw (Hz) | 500 |
| Vnom,dc (V) | 1500 | R (Ω) | 0.1 |
| Controller | |||
|---|---|---|---|
| Type | Symbol | Value | |
| DC-link | SOSMC | (k1, k2) | (20, 1) |
| PI | (KP, KI) | (10, 800) | |
| Current | (KP, KI) | (0.8, 8) | |
| Individual balancing | (KP, KI) | (0.5, 5) | |
- Abbreviations: PI, proportional–integral; SOSMC, second-order sliding mode control.
The parameters for the PI controller are determined based on [33]. The overall system model changes continuously due to the reduction in DC-link capacitance, making it unfeasible to identify optimal control coefficients for the PI controller. In contrast, the proposed SOSMC consistently demonstrates superior performance.
In the SOSMC method, the controller parameters (k1, k2) are calculated as Equation (25), based on the constraint parameters (φ, Γm, ΓM) defined by Equations (20)–(22). These parameters are approximately φ ≈ 11.3 × 10⁶, Γm = 12 × 106, and ΓM = 19.87 × 10⁶. Furthermore, the performance of the presented controller is evaluated and compared under two different operating scenarios.
In Case 1, the reactive power change is analyzed, where it decreases from 10 MVAr to −10MAr at t = 0.4 s. In Case 2, the DC-link capacitance is reduced to 33% of its nominal value at t = 0.4 s, while the reactive power demand also decreases from 10 MVAr to −10 MVAr at t = 1 s. The DC-link side consists of film-type CBs, with a total capacitance of 9.2 millifarads. The failure rates for these capacitors can range from 0.1% to 1% per 1,000 h under nominal operating conditions. Considering these factors, a reasonable assumption of a 30% failure rate has been made over 5 years [8, 34].
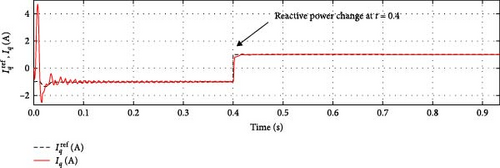
In Case 1, the dynamic performance of the STATCOM is validated in both capacitive and inductive operating modes, where the nominal reactive power transitions from capacitive mode to inductive mode at t = 0.4 s. Figures 4 and 5 illustrate the grid/converter voltage, grid current, average DC-link voltage, and active/reactive power for both the proposed SOSMC and the conventional PI controller. The results indicate that the SOSMC scheme effectively drives the DC-link voltage to track the reference value with minimal overshoot. Assuming that reactive power variation is the only variable, Figures 6 and 7 illustrate the performance of the SOSMC and PI controllers, respectively, regarding the d–q components of grid currents (id, iq).


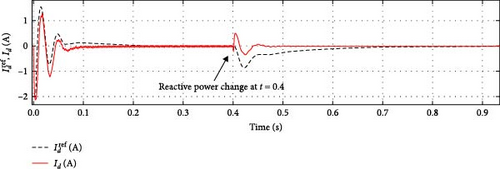

As shown in Figures 4 and 5, both the SOSMC and PI controllers exhibit negligible overshoot in the DC-link voltage during the transition with an approximate peak of 5 V. However, Figure 4 demonstrates that the SOSMC effectively prevents additional overshoots, unlike the results from the PI controller depicted in Figure 5. Both controllers take about 30 ms to track the DC-link reference voltage. Additionally, the proposed SOSMC scheme significantly reduces the chattering problem, resulting in minimal ripple.
The validation of the proposed SOSMC scheme demonstrates the controller’s efficiency, highlighting its robustness, good dynamic response, and rapid tracking of the DC-link reference.
Case 2: Comparing the performance of control systems under DC-link uncertainty.
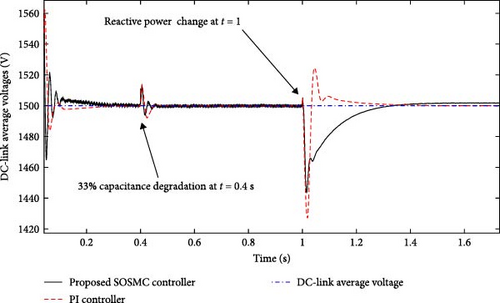
To investigate and confirm the robustness of the SOSMC controller, the dynamic performance of both the SOSMC and PI controllers under two different scenarios is presented in Figures 8 and 9, respectively. These scenarios are as follows.


In the first scenario, the converter capacitor was changed from 9.2 mF to 66% × 9.2 mF at t = 0.4 s. In the second scenario, the converter mode transitions from full capacitive operation (10 Mar) to full inductive operation (−10 Mar) at t = 1 s.
Figures 10 and 11 present the performances of the SOSMC and PI controllers, respectively, concerning the d–q components of grid currents (id, iq).
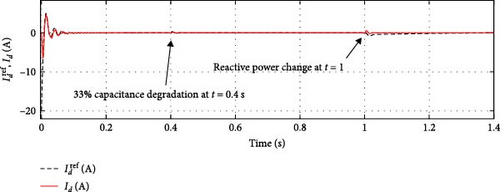
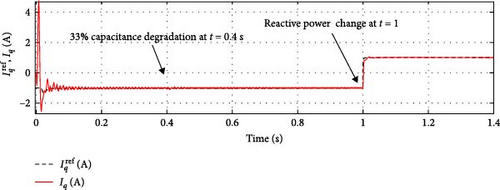
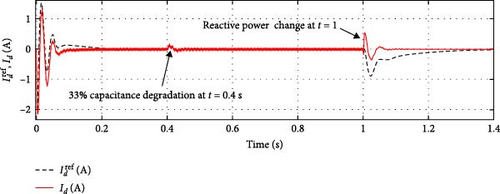
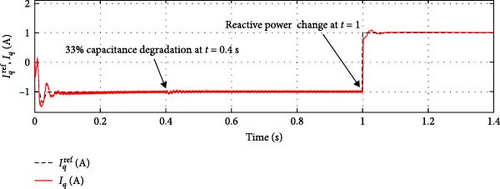
The validation of the proposed SOSMC scheme confirmed that the DC-link tracking process is faster with limited overshoot (approximately 12 V). Additionally, this result illustrates how the proposed SOSMC controller impacts reactive power demand tracking.
Figure 12 compares the DC-link voltages for the PI and SOSMC designs. As shown in this figure, DC-link voltage regulation is maintained throughout the entire duration, with a voltage ripple of less than 5% for each DC link. Although the average voltage ripples for both controllers were approximately the same, the PI controller had a settling time of 13 ms, while the proposed SOSMC controller achieved a significantly faster settling time of ~2 ms. Table 3 displays the THD index for the STATCOM output current, highlighting the superiority of the proposed SOSMC. The THD index of the SOSMC is recorded at 3.27% and 0.87% during capacitance reduction in capacitive mode in inductive modes, respectively. While these results are comparable and acceptable when contrasted with the conventional PI controller, even minor differences can lead to significant discrepancies over time.
| Controller | PI | SOSMC | ||
|---|---|---|---|---|
| Mode | Capacitive (%) | Inductive (%) | capacitive (%) | inductive (%) |
| Steady state response | 3.07 | 0.26 | 3.12 | 0.20 |
| Capacitance change | 3.27 | 0.87 | 3.43 | 1.20 |
- Abbreviations: PI, proportional–integral; SOSMC, second-order sliding mode control.
Additionally, comparative results of employing a first-order sliding mode controller in a distribution STATCOM indicate that the THD index for the first and SOSMCs, corresponding to inductive and capacitive modes, are similar. According to Hashemzadeh et al. [8], the THD values are 4.37% in capacitive mode and 3.21% in inductive mode, respectively.
5.1. AC Side THD
This section examines the effect of capacitance degradation on the AC side THD. Since the required reactive power (Q) is a constant value, the DC-link voltage ripple of the STATCOM will increase as some of the capacitors in the CB fail. Additionally, when the DC-link capacitance decreases, keeping output voltage constant, the amplitude of will increase, leading to a rise in the AC-side current THD.
Considering that the uncertainty in DC-link capacitance is modeled as an external perturbation in Equation (8), the proposed controller is capable of sustaining enhanced performance during DC-link capacitor failures. As a result, the fluctuations in DC-link voltage are more favorable to the proposed SOSMC controller. The output voltage waveforms under normal and aged conditions are illustrated in Figures 13a,b, respectively.
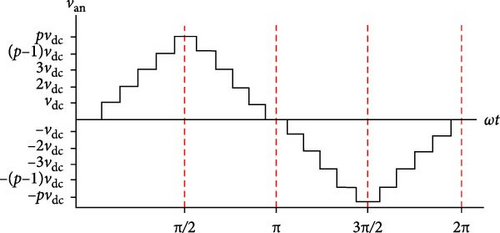
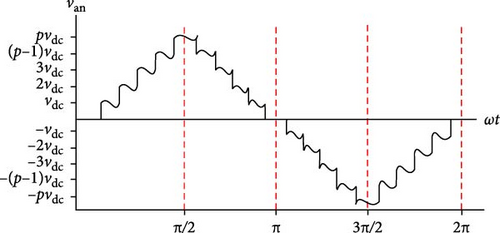
Therefore, when the DC-link capacitors fail, both voltage and current harmonics tend to increase. In this study, the performance of the system is fundamentally linked to the AC-side current THD, in accordance with IEEE−519 standards. The findings indicate that the proposed control system has a more substantial impact on AC-side current THD compared to conventional PI controllers.
5.2. Reliability
This section presents the impact of SOSMC design on the reliability index and the reliability model of the DC-link capacitors. We then estimate the lifetime of the STATCOM by considering the operating lifetime of the capacitors and the permissible THD for the system.
Figure 14 summarizes the harmonic characteristics of the control schemes and compares them with the operational lifespan.

It can be concluded that the probability of capacitor failure increases over time, leading to a decrease in the reliability index. Since capacitor failure contributes to higher THD, a reduction in capacitance over time further elevates THD levels. According to the IEEE-519 standard, the permissible THD zone for high voltage–power levels is set at 6%. Consequently, the proposed SOSMC controller can ensure system performance remains within the acceptable THD range for 5 years, while this duration is shorter for the conventional PI controller, which is only 3 years.
Considering the impact of the proposed SOSMC controller on the expected lifespan of the system, it can be inferred that this controller enhances reliability on the DC-link side. It not only maintains efficient performance while accommodating uncertainties in DC-link capacity within the allowed THD range but also demonstrates improved reliability. As a significant outcome, the proposed SOSMC controller exhibits notable advantages over the conventional PI controller, particularly in terms of achieving a lower THD value and providing a very fast transient response. Overall, the performance of the proposed SOSMC scheme from the point of view of reliability is better than the PI controller. Furthermore, due to the variations in DC-link capacitance, the PI controller cannot be optimized with suitable coefficients, thus failing to achieve high reliability.
5.3. Cost Evaluation
The reliability of multilevel converters is influenced by both redundancy and maintenance levels. While increased redundancy enhances reliability during the design phase, it significantly raises initial costs. Additionally, proper maintenance routines during system operation can improve reliability, although they may also increase operational costs. Therefore, shorter maintenance intervals combined with high redundancy may enhance reliability but also incur high costs.
According to Figure 14, the maintenance interval for the SOSMC scheme is longer than that of the PI controller, allowing for reduced maintenance costs with the SOSMC control system. Consequently, the required redundancy level for the proposed SOSMC is lower than that of the PI controller, leading to decreased redundancy costs.
This paper suggests that implementing the proposed SOSMC method will extend the system’s maintenance interval while reducing shutdown and overall operational costs. Since maintenance costs are inversely related to redundancy costs, a tradeoff between them is necessary. To evaluate this tradeoff, the total cost for a multilevel STATCOM, considering redundancy and maintenance intervals, is calculated in this subsection, considering two different cases. In all scenarios discussed, it is assumed that the STATCOM operates for 8760 h per year and has a lifespan of 20 years. The two case studies are as follows:
Case I: Increasing reliability through maintenance without redundancy.
Case II: Increasing reliability through maintenance with redundancy.
5.4. Case I: Increasing Reliability Through Maintenance
The total cost for Case I is determined by considering maintenance intervals for both PI and SOSMC controllers. The required maintenance intervals are based on the pre-calculated lifetime provided in Figure 14. According to this table, at least 6 maintenance sessions (i.e., 3-year intervals) are recommended for the PI controller to achieve 89.6% reliability. In contrast, ~4 maintenance sessions (i.e., 5-year intervals) are required for the SOSMC controller to attain 99% reliability. The total maintenance cost is calculated based on the average cost associated with each maintenance interval [9]. Further details on the proposed maintenance cost modeling scheme can be found in Appendix B.
The SOSMC controller results in fewer maintenance sessions, leading to a lower overall cost. In this case, the cost of the STATCOM system is 1,518,800 €;. As shown in Table 4, not only is the maintenance interval for the proposed SOSMC longer than that of the conventional PI controller, but the reliability of the proposed SOSMC is also greater at the same cost.
| Case study | Assumption | Cost (€) | ||
|---|---|---|---|---|
| Initial cost | Operational cost | Total cost | ||
| Case I: maintenance |
|
1.779 × 10⁵ | 1.352 × 10⁶ | 1.530 × 10⁶ |
|
1.779 × 10⁵ | 1.340 × 10⁶ | 1.518 × 10⁶ | |
| Case II: redundancy and maintenance |
|
2.053 × 10⁵ | 1.354 × 10⁶ | 1.559 × 10⁶ |
| SOSMC with 10% redundancy (reach 99.9% reliability) | 2.053 × 10⁵ | 1.342 × 10⁶ | 1.547 × 10⁶ | |
- Abbreviations: PI, proportional–integral; SOSMC, second-order sliding mode control.
A system with more redundancies typically requires longer maintenance intervals; however, the reliability improvement becomes more significant as the redundancy level increases. Therefore, a comprehensive approach addressing reliability assessment in terms of both redundancy and maintenance is still necessary.
5.5. Case II: Increasing Reliability Through Redundancy and Maintenance
The proposed SOSMC does not require redundancy to achieve 99% reliability, whereas the PI controller necessitates at least 10% redundancy. As indicated in Table 4, implementing 10% redundancy along with appropriate maintenance intervals can increase the reliability of the PI controller from 89.6% to 98.6%, although this also raises the total cost of the STATCOM.
6. Conclusion
- •
Employing a robust DC-link controller enhances the operational lifespan of the CHB STATCOM during DC-link faults. The proposed SOSMC controller maintains system performance within the THD range for 5 years, as the current THD remains below 6%, satisfying the IEEE-519 standard. In contrast, the conventional PI controller may require service after just 3 years.
- •
The proposed control method improves system performance and leads to reduced maintenance intervals and repair costs, as well as an extended operational lifespan of the STATCOM system, making it economically justifiable.
- •
According to the comparative results, a robust controller can achieve desirable dynamic performance over an extended time horizon. This is a significant achievement in terms of reliability and cost considerations, as well as dynamic response.
Nomenclature
Abbreviations
-
- CHB:
-
- Cascade H-bridge
-
- FACTS:
-
- Flexible AC transmission system
-
- PCC:
-
- Point of common coupling
-
- PS-PWM:
-
- Phase-shifted pulse width modulation
-
- SOSMC:
-
- Second-order sliding mode control
-
- THD:
-
- Total harmonic distortion
Indexes
-
- t:
-
- Index of time
Variables
-
- vc(vcavcb, vcc):
-
- Converter voltages at the three-phase AC terminals (a, b, c)
-
- v(va, vb, vc):
-
- Grid voltages at the PCC
-
- θ:
-
- Phase angle between the grid voltage and the output current
-
- φ:
-
- Phase angle between the fundamental component of STATCOM output voltage (vc) and the grid voltage (v)
-
- P/Q:
-
- Instantaneous STATCOM active/reactive power
-
- L(La, Lb, Lc):
-
- Inductance of output filter
-
- L1a, L1b, L1c:
-
- Stray inductance of connections and cables
-
- R(Ra, Rb, Rc):
-
- Series resistance of output filter in each phase
-
- id/iq:
-
- Current terms in d-axis/q-axis
-
- vd/vq:
-
- Grid voltage components in d-axis/q-axis
-
- vcd/vcq:
-
- Converter output voltage components in d-axis/q-axis
-
- Vdc:
-
- DC-link voltage of each cell
-
- :
-
- Total average of DC-link voltages
-
- Vdci,j:
-
- DC-link voltage of the ith: H-bridge cell in jth phase (j = a, b, c)
-
- S:
-
- Sliding surface
-
- :
-
- Derivate of sliding surface
-
- ∅(x, t), γ(x, t):
-
- Corresponding smooth functions
-
- Φ:
-
- Upper Limit of ∅(x, t),
-
- Γm, ΓM:
-
- Boundaries of γ(x, t)
-
- k1, k2:
-
- Related SOSMC parameters
Parameters
-
- ω:
-
- Angular frequency
-
- CSM:
-
- Equivalent capacitance of the DC-link
-
- RP:
-
- Resistive loss model of CHB
-
- S:
-
- Rated apparent power
-
- :
-
- Nominal voltage at PCC
-
- F:
-
- Angular frequency
-
- C0:
-
- Nominal value of DC-link capacitance
-
- ΔC:
-
- Uncertainties in equivalent capacity
-
- C:
-
- Equivalent capacitance of DC-link for each cell
-
- N:
-
- Number of CHB converters in each phase.
Conflicts of Interest
The authors declare no conflicts of interest.
Funding
The authors received no specific funding for this work.
Appendix A: State Space Equation
Appendix B: Maintenance Cost Modeling
The related parameters of maintenance cost are given in Table A1 based on [35].
| Data of maintenance cost | ||
|---|---|---|
| Parameter | Abbreviations | Value |
| Fixed cost per maintenance (k€) | Lf | 1.5 |
| Cost of power outage | Lo | 0.15 |
| Maintenance duration (h) | To | 8 |
| Cost of each SM module replacement (k€) | Lr | 1.7 |
Open Research
Data Availability Statement
The data that support the findings of this study are available upon request from the corresponding author. The data are not publicly available due to privacy or ethical restrictions.


