Analytical Modeling of Photovoltaic Systems Under Partial Shading Conditions Incorporating Bypass and Blocking Diodes Influence
Abstract
This paper presents an innovative analytical model for photovoltaic (PV) systems operating under partial shading conditions (PSCs). The model is developed through a detailed analysis of the current–voltage (I–V) curves of PV systems affected by PSCs and employs a straightforward computational algorithm by adjusting every time the number of cells or modules contributing to power generation and calculating the voltage across these cells or modules, the Newton–Raphson algorithm is then used to solve the developed analytical model efficiently, ensuring accurate integration of all data into the equation of the output current. The proposed model accounts for the effects of bypass and blocking diodes, which are critical for managing partial shading and ensuring efficient power flow. It is applicable to various configurations, including individual PV modules and PV arrays in series (S), parallel (P), and series-parallel (SP) arrangements. The results are validated through comparisons with Simpowersystem tools in the MATLAB-Simulink environment. The model showcases notably accelerated execution times and dependable convergence toward the global maximum power point (GMPP). Additionally, the proposed algorithm can be implemented using any computational software, highlighting its versatility and potential for practical applications in PV system optimization and real-time simulation environments.
1. Introduction
1.1. Background and Motivation
Photovoltaic (PV) systems have gained significant attention as a sustainable and clean energy solution. They harness solar energy to convert it into electricity, contributing to the reduction of greenhouse gas emissions and dependence on fossil fuels. However, PV systems often operate under challenging environmental conditions, such as partial shading, which can significantly impact their performance and efficiency. Partial shading occurs when some solar cells or modules [1] within a PV system are subjected to varying degrees of shading due to factors like nearby buildings, trees, or cloud cover. The presence of shading can lead to significant power losses [2], mismatched currents, and even hotspot formation [3], posing operational and reliability challenges for PV systems.
The impact of partial shading on PV installations is far from negligible [4]. Studies, such as the one referenced in [5], have shown that partial shading can account for power losses ranging from 10% to 20%, underscoring its critical role in diminishing system efficiency. This stark statistic highlights the pressing need for innovative strategies to address shading-induced challenges and ensure the optimal operation of PV systems in diverse environmental conditions. To address these challenges, modeling PV systems under partial shading conditions (PSCs) is critical. Accurate models enable precise performance prediction, facilitate optimized system design, and ensure financial feasibility. By guiding the layout of modules and driving technological innovation, such models enhance operational efficiency by identifying and mitigating underperformance caused by shading effects [6].
1.2. Related Works and Literature Gap
The existing literature on PV system modeling has primarily focused on ideal operating conditions, assuming uniform irradiance distribution across all modules [7–14].
Other studies have focused on modeling PV systems under PSCs. A number of these studies have employed electrical components available in simulation software such as Simulink and PSIM [15–19]. These software tools provide a wide array of features for simulating and analyzing the performance of PV systems under different shading conditions. However, one challenge with these tools is that they can be time-consuming, especially when complex models are involved. Additionally, the flexibility of implementing detailed PV models can be somewhat limited, affecting the quality and scope of the simulations. Arjun et al. [20] propose an analytical method for calculating the maximum power point (MPP); however, their approach does not fully capture all relevant characteristics of PV systems, particularly under shading conditions, limiting its practical applicability. In [21], an analytical approach is introduced to estimate the global MPP (GMPP) by utilizing a shading index (SI) derived from irradiance levels. This method predicts the GMPP location and determines the voltage and current at the MPP for series and series-parallel (SP) configurations. While this approach offers valuable insights into GMPP estimation, it primarily focuses on power prediction rather than providing a comprehensive electrical modeling framework. Moreover, it does not explicitly consider the electrical interactions involving bypass and blocking diodes, which play a significant role in the performance of PV arrays under PSCs. AI-based modeling of PV systems under PSCs has been investigated in [22–24], yet these methods face a significant challenge due to their dependence on large datasets for accurate training and prediction, making them less effective in scenarios where sufficient data are unavailable.
Analytical modeling has been widely studied, but many approaches overlook the role of bypass diodes, which are essential for protecting PV cells and improving system performance under shading conditions [25–29]. Additionally, some studies, such as [30], focus exclusively on small-scale configurations where only two series-connected PV modules are considered, limiting their applicability to larger PV arrays. This narrow scope fails to account for the complexities of partial shading across extensive configurations, the influence of bypass and blocking diodes, and the need for dynamic simulation considerations. While works, such as [31–33], have advanced analytical modeling under PSCs, they present notable gaps, including a lack of clarity regarding the impact of bypass and blocking diodes—critical components in mitigating shading effects. Moreover, their results lack rigorous validation, raising concerns about accuracy and real-world implementation. Another key limitation is the absence of discussions on simulation time, an important factor for evaluating the efficiency of a modeling approach. In contrast, [34] integrates the impact of bypass and blocking diodes into its analytical modeling, offering a more comprehensive perspective. However, this study remains limited to large-scale PV systems configured in a series arrangement. Consequently, its findings are not easily generalizable to other common configurations, such as SP, or to standalone PV modules used in residential and public lighting applications. Despite significant advancements in PV system modeling, existing analytical approaches often fail to generalize across various configurations, such as series, parallel, SP arrays, and individual modules. These limitations are further compounded by their inability to effectively account for the impact of bypass and blocking diodes, which are essential for mitigating shading-induced power losses and maintaining efficient power flow. Additionally, many existing models lack rigorous accuracy validation and fail to address the speed of execution, limiting their practical applicability.
To address these gaps, this paper introduces a comprehensive analytical modeling framework designed to operate across diverse PV array configurations while incorporating the critical effects of bypassing and blocking diodes. The proposed approach ensures both high accuracy, validated through Simpowersystem tools in the MATLAB-Simulink environment, and rapid execution, making it suitable for real-time applications. Moreover, its compatibility with various computational software tools enhances its versatility and usability.
A key contribution of this work lies in integrating the PV generator model with practical components, such as MPP tracking (MPPT), to demonstrate its effectiveness in optimizing system performance under realistic operating conditions. By bridging the identified gaps, this model offers a robust and scalable solution for managing partial shading. Table 1 provides a summary of the literature review presented in this section, highlighting key methodologies and findings relevant to our study.
| Studies | Application scale | Results validation | Considerations |
|---|---|---|---|
| [21] | Series and series-parallel configurations | Experimental validation | Bypass and blocking diodes not considered |
| [33] | Individual PV module | SimPowerSytem tools | Bypass and blocking diodes not considered |
| [18] | Series-parallel configuration | Experimental validation | Bypass and blocking diode considered |
| [30] | Two series-connected modules | Not validated | Bypass and blocking diodes not considered |
| [31] | Series and series-parallel configurations | Not validated | Bypass and blocking diodes not considered |
| [32] | Individual PV module | Experimental validation | Bypass and blocking diodes not considered |
| [34] | Series connection | SimPowerSystem tools | Bypass and blocking diodes considered |
2. Modeling of PV Module, Array
The mathematical description of the PV cell derives from the inherent physical principles that govern its functional operation. By using the PV principle, a PV cell converts sunlight directly into electrical energy [24]. The predominant mathematical framework employed to characterize the cell behavior is the single diode model [4, 16, 25, 26] which finds extensive usage in the literature. The adoption of the single-diode equivalent circuit, depicted in Figure 1, is motivated by its capacity to facilitate rapid numerical computations while upholding a satisfactory level of precision. This circuit encompasses a controlled current source, Ipc, and a shunt diode, along with internal series and parallel resistances, Rs and Rsh, respectively [3].
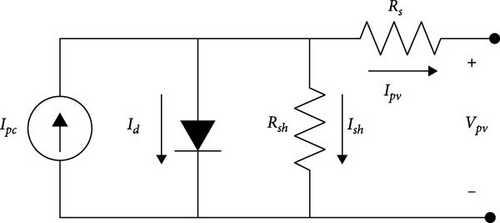
In Equation (1), Ipv represents the module current, which is the output current generated by the PV cell. The term Ipc refers to the photocurrent, representing the current generated by incident sunlight on the PV cell; the diode current, Id, accounts for the losses resulting from charge recombination within the PV cell. Lastly, Ish denotes the shunt current, which arises due to leakage paths in the PV cell.
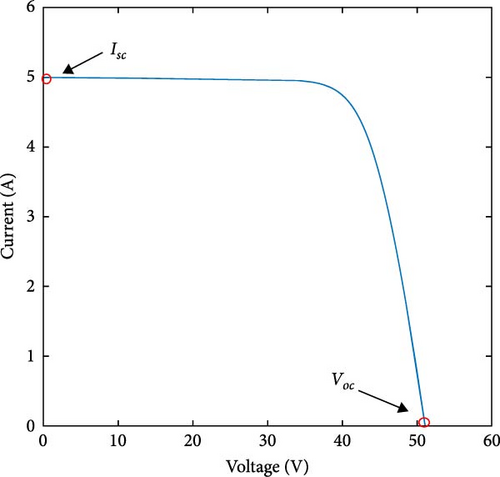
Here, Isc represents the short-circuit current, Voc denotes the open-circuit voltage, Impp and Vmpp correspond to the current and voltage at the MPP, respectively, P4 parameter is utilized in the calculation of the saturation current.
Equation (11) expresses the shunt current Ish:Vsh represents the voltage across the shunt resistor (Rsh), which represents losses caused by cell nonidealities, such as fault-induced currents and leakage currents due to impurities, the resistor Rs, that is connected in series with the cell, takes into account the power losses due to the physical properties of the PV cell and the interconnections between the cells [3].
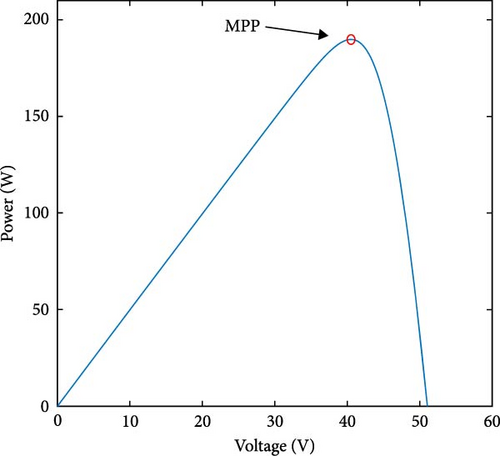
Figure 2 illustrates the performance output of the model used under STC. This one consists of 60 interconnected cells, producing a peak power output of 198 W at 25°C. Detailed information regarding the other parameters can be found in Table 2.
| Parameter | Value |
|---|---|
| Peak power (MPP) at STC | 198.52 W |
| Voltage at MPP (Vmpp) | 42.43 V |
| Current at MPP (Impp) | 4.68 A |
| Short circuit current (Isc) | 5 A |
| Open circuit voltage (Voc) | 51 V |
| Number of series cells (ns) | 60 |
| Series resistance (Rs) | 0.46 Ω |
| Shunt resistance (Rsh) | 106 Ω |
| P1 | 0.005 |
| P2 | 7.27 10−5 |
| P3 | −1.1369 10−5 |
| P4 | 38.8 |
| Converter capacitor (C1) | 470 µF |
| Converter capacitor (C2) | 47 µF |
| Converter inductance (L) | 0.001 H |
2.1. Effects of Partial Shading on PV Generators
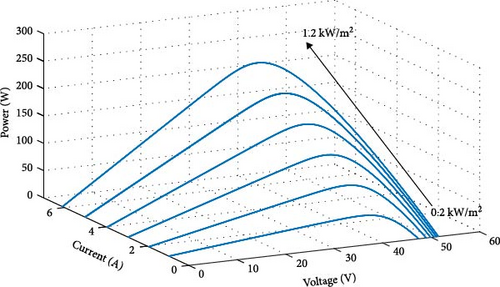
The strong relationship between the photocurrent Ipc and irradiation presented in Equation (2) results in the output current of a PV cell being directly proportional to the intensity of sunlight it receives (Figure 3).
When sunlight is unevenly distributed across a PV module or array, certain cells may become shaded and generate a reduced current compared to the unshaded cells. This imbalance in the current generation creates a reverse bias effect, as presented in Figure 4, where the voltage across the shaded cells is opposite to their intended operation [37]. Consequently, unintended leakage currents can occur, resulting in power dissipation within the shaded cells as power losses [38, 39].
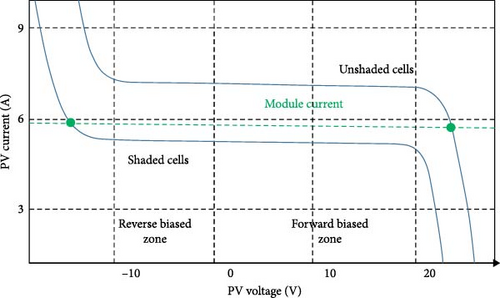
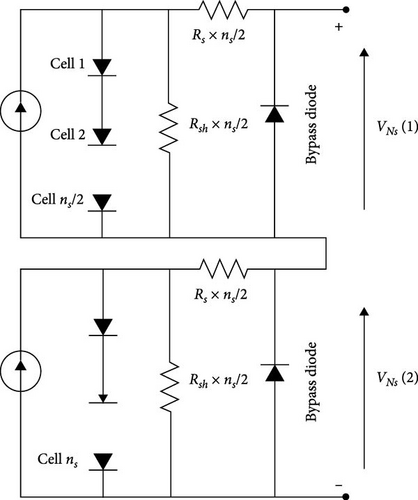
When the remaining unshaded cells in the module continue to generate current, a portion of that current is compelled to flow through the shaded cells. This localized current flow through the reverse-biased cells leads to excessive heat generation, leading to the formation of hot spot phenomena [3, 4, 40]. To address the issue above, the addition of bypass diodes to the PV cells or module is necessary. This configuration is depicted in Figure 5. In this scheme, half of the PV cells are connected to each other in series, alongside a bypass diode connected in parallel [38, 41].
2.2. Bypass and Blocking Diodes Influence
Analyzing the current–voltage (I–V) characteristics of a PV module that includes shaded PV cells and parallel bypass diodes connected with a group of cells (Figure 6), the following behavior can be observed:
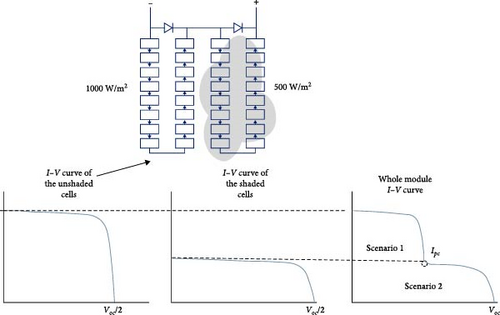
Scenario 1: When the PV module operates at Ipv >Ipcs (Ipcs is the photocurrent of the shaded cells, Ipv is the module/array current), it functions with the presence of the bypass diode. In this case, the shaded cells become reverse-biased, causing the current to flow through the bypass diode instead of contributing to the module’s output power generation.
Scenario 2: At low levels current than Ipc (Ipv <Ipcs) the both shaded and the unshaded cells are biased forward. As a result, all the PV cells will contribute to the generation of power. This configuration causes the partially shaded module to show several peaks on itsP–V curve, attributed to the presence bypass diode. Incorporating bypass diodes into the PV module minimizes the negative impact of shading (Figure 7) [3]. These diodes create alternative paths for the current, diverting it away from the shaded cells. As a result, the bypass diodes enable the shaded cells to bypass the current flow, preventing excessive heating, electrical imbalances, and potential damage [39, 42].
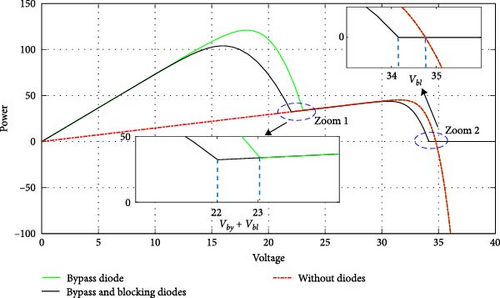
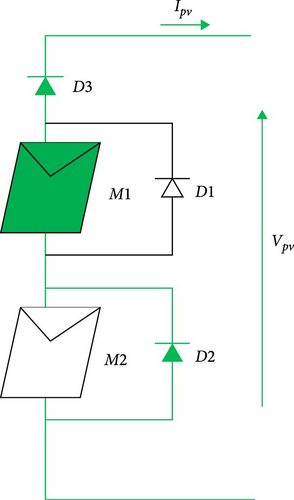
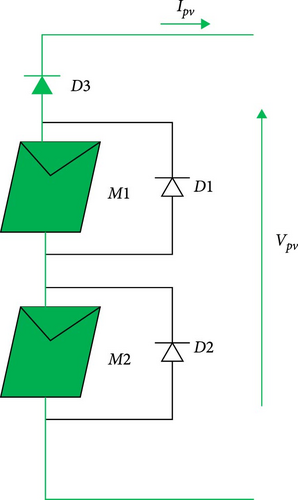
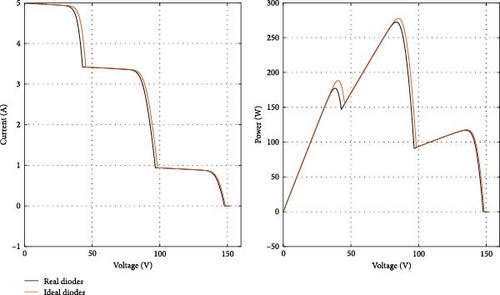
Figure 7 illustrates theP–V curve for two PV modules connected in series under uneven sunlight exposure, with bypass diodes, then with both bypass and blocking diodes. It is notable that without blocking diodes, the current can reverse and become negative (such as during nighttime or on overcast days, when the PV cell operates like a load). However, the presence of blocking diodes ensures that current flows only in one direction, thereby enhancing the safety and reliability of the PV system. In Zoom 1, The voltage difference between the two points is attributed to the conduction of bypass diode D2, resulting in the voltage Vby, and the conduction of blocking diode D3, leading to the voltage Vbl as shown in Figure 8a. In Zoom 2, the voltage difference is caused by the conduction of D3, while the two bypass diodes are not conducting (Figure 8b). Equation (13) provides a way to calculate the bypass diode voltage Vby and blocking diode voltage Vbl, with Vf representing the forward voltage and Ron representing the resistance value of the diode when it is conducting, ID is the current running through the diode.
3. The Proposed Modeling Algorithm
3.1. Partial Shading in a PV Module
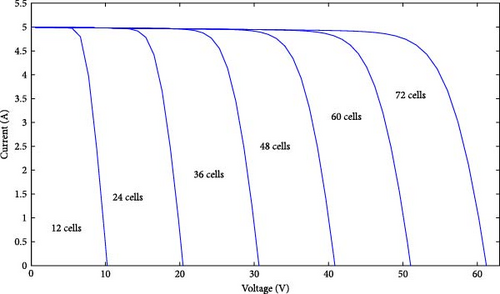
As stated earlier in Equations (1), (2), and (8), the current produced by the PV module is influenced by several factors, namely Irradiation, Temperature, and the number of series cells, and their effects are shown in Figures 3 and 9 where the temperature is considered constant (25°C). To obtain Equation (14), substitute Equation (9) in Equation (8) and then Equations (2), (8), and (11) in Equation (1):
- 1.
Construct the vector of different sunshine levels, “suns,” ordering them in descending order. Let’s assume that the size of the vector is denoted by “k.”
- 2.
To build the cells vector Ns, we set Ns (i) = ns−Nsh (i), where Nsh (i) represents the number of cells isolated at a level lower than suns (i). In this order, the elements of the vector “Ns” will be arranged in ascending order, where “i” denotes the index of the component within the vector, spanning from one to “k.”
- 3.
Construct the Ipc vector by calculating the photocurrent corresponding to each level using Equation (2).
- 4.
: calculate the voltage across an Ns (i) series of cells VNs (i) connected to the same parallel bypass diode using Kirchhoff’s law as depicted in Figure 5.
(17)
Vby is the voltage across a bypass diode can be calculated using expression (13), and V is the voltage of the whole module. For a grid of points of “V,” compute the module’s output PV current, denoted as Ipv,m, through the execution of this loop:
For i = 1 to k
If f(VNs(i), Suns(i), Ns(i)) is greater than Ipc(i + 1),
Ipv,m = f(VNs(i), Suns(i), Ns(i)),
else: f(VNs(i + 1), Suns(i + 1), Ns(i + 1).
For initialization, the initial value of I0pv, m is set equal to Ish, m (1), which presents the short circuit current of the module at the highest level of irradiation. This choice is based on the fact that the computational process begins with a voltage of zero, effectively treating the model as short-circuited at the initial step. For more clarifying the process, the following pseudocode is given:
START
1. Construct the vectors: Suns, Ns, Ipc
2. Set initial module voltage V = 0 and short-circuit current Ipv, m = Ipc (1).
3. Initialize i = 1
4. WHILE i < = length (suns)
a. Calculate VNs using Equation (17)
b. Calculate f (VNs (i), Suns (i), Ns (i)) using Equation (20)
c. IF f (VNs (i), Suns (i), Ns (i)) > Ipc (i + 1) THEN
- Set Ipv, m = f (VNs (i), Suns (i), Ns (i))
ELSE
- Set Ipv, m = f (VNs (i + 1), Suns (i + 1), Ns (i + 1)) % using Equation (20)
ENDIF
d. Increment i by 1
ENDWHILE
END
3.2. In a PV Array
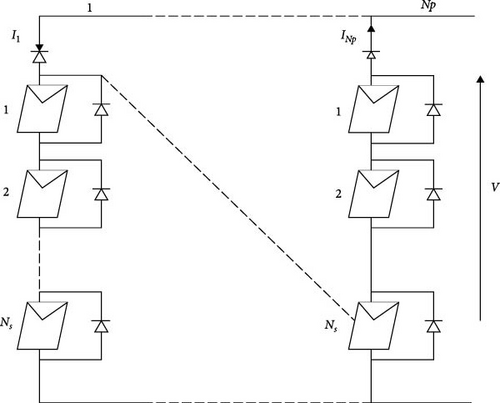
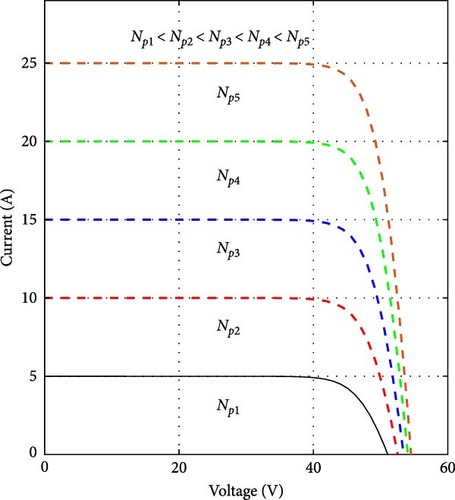
In PV systems, the SP configuration is commonly used. This arrangement divides the PV generator into parallel strings, with each string consisting of multiple modules connected in series. Each module is equipped with a bypass diode, and each string has a blocking diode, as shown in Figure 10. Figure 11 presents I–V curves for different connections: Series and Parallel computed using Equation (12). If we set a number of parallel modules Np = 1 in Equation (12), we obtain the string output current Ipv,s in Equation (21).

- 1.
Devise the array on parallel strings containing Nss series-connected modules.
- 2.
For each string, build the irradiance vector “Suns” (“l” is its length) and arrange it in decreasing order.
- 3.
For each sunlight level, calculate the photocurrent using Equation (2), then build the Ipc vector.
- 4.
Construct the modules vector “Ms,” put Ms (i) = Nss−Msh (i), with “Msh (i)” corresponding to the number of modules exposed to a solar irradiance level lower than Suns (i).
- 5.
Calculate the voltage across Ms (i) modules using Equation (23).
- 6.
For a grid of points of “V,” calculate the output PV current of the string using this algorithm:
For i = 1 to the length of Suns
If g(VMs(i), Suns(i), Ms(i)) is greater than Ipc(i + 1)
Do: Ipv,s = g(VMs(i), Suns(i), Ms(i)) else Ipv,s = g(VMs(i + 1), Suns(i + 1), Ms(i + 1)).
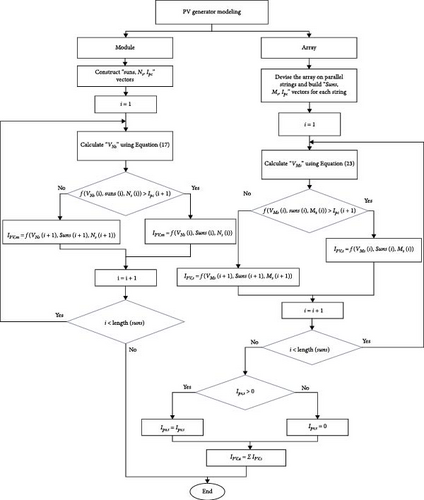
For initialization, the initial value of I0pv,a is set equal to Ish,a (1), which presents the short circuit current of the module at the highest level of irradiation. This choice is based on the fact that the computational process begins with a voltage of zero, effectively treating the model as short-circuited at the initial step.
The following pseudocode clarifies the process
START
1. Devise the array into parallel strings and build for each vector: Suns, Ms, Ipc
2. Set initial string voltage V = 0 and short-circuit current Ipv, s = Ipc (1).
2. Initialize i = 1
2. WHILE i < = length (Suns)
a. Calculate VMs using Equation (23)
b. Compute g (VMs (i), Suns (i), Ms (i)) using Equation (26)
c. IF g (VMs (i), Suns (i), Ms (i)) > Ipc (i + 1) THEN
- Set Ipv, s = g (VMs (i), Suns (i), Ms (i))
ELSE
- Set Ipv, s = g (VMs (i + 1), Suns (i + 1), Ms (i + 1)) % using Equation (26)
ENDIF
d. Increment i by 1
ENDWHILE
3. IF Ipv, s > 0 THEN
- Retain Ipv,s as is
ELSE
- Set Ipv,s = 0
ENDIF
END
The flowchart in Figure 12 summarizes the above algorithms:
3.3. Comparison Between the Proposed Approach and SimPowerSystem Tools-Based Approach
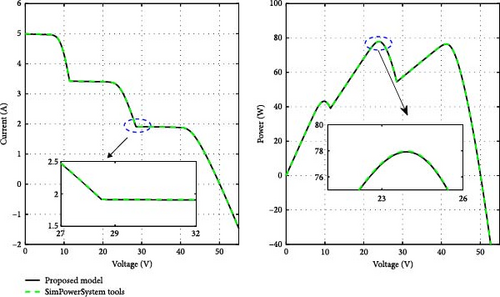
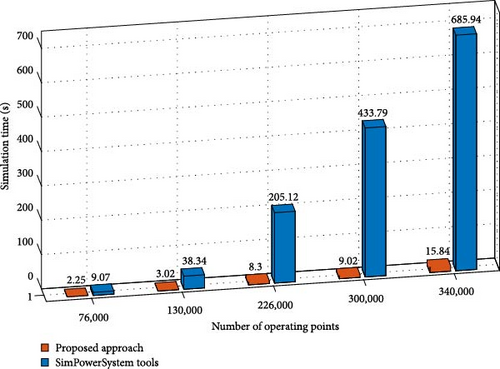
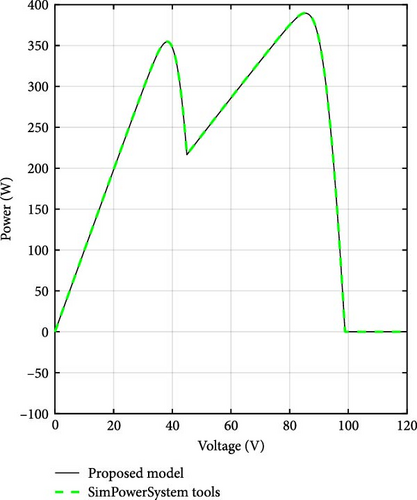
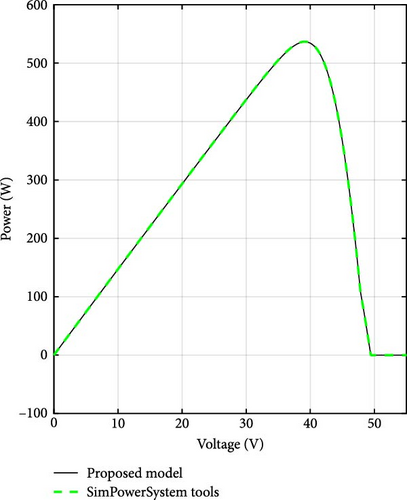
This section presents a comparison between the proposed approach and a method based on Simpowersystem tools. The simulations are conducted at various scales to test the effectiveness and versatility of the proposed approach. The performance of a single PV module consists of three groups of 20 series cells; each group bypassed by a diode is initially simulated, and the shading pattern is shown in Table 3. Figure 13 illustrates the I–V and P–V curves of the setup, underscoring the accuracy of the proposed approach. The behavior of series connections with 3, 5, 9, 11, and 13 modules under varying shading patterns (Table 4) is also analyzed; the corresponding P–V curves are illustrated in Figure 14. The matching absolute errors are depicted in Figure 15. Moreover, the execution times for these various series connections are assessed to compare the proposed approach with component-based methods (Figure 15). The simulations were conducted on a portable computer with an Intel (R) Core (TM) i5-8350U CPU @ 1.90 GHz and 8 GB of RAM. The results, displayed in Figure 16, indicate that the proposed model is sometimes up to 40 times faster than the component-based approach. To further demonstrate the flexibility of the proposed method, a configuration with four modules, first in an SP arrangement and then in parallel, the corresponding shading patterns are presented in Table 4 is simulated, as shown in Figure 17, the errors in these setups are presented in Figure 18b,c. This comparison aims to validate the versatility of the proposed approach across various system configurations. The absolute error plots in Figures 15 and 18 show that the error remains minimal, with small peaks occurring when there are changes in the number of modules and conducting diodes. These peaks are likely due to numerical approximations and assumptions made in the model, such as ideal diode behavior and the neglect of certain parasitic effects. Acknowledging these factors helps to better understand the model’s limitations and its impact on accuracy. In Figure 19, the impact of bypass and blocking diodes in partial shading scenarios are presented. In this analysis, both ideal and real diodes are used. Ideal diodes are modeled with a resistance of Ron = 0 and a forward voltage of Vf = 0, resulting in zero voltage drop when the diode is conducting. On the other hand, real diodes have a forward voltage drop, which can be calculated using Equation (13), with Ron = 0.001 Ω and Vf = 0.8 V.




| Parameters | Module’s position | Number of series-connected modules | ||||
|---|---|---|---|---|---|---|
| 3 | 5 | 9 | 11 | 13 | ||
| Irradiance level of every module | 1 | 1000 | 1000 | 1000 | 950 | 1050 |
| 2 | 700 | 800 | 900 | 900 | 970 | |
| 3 | 200 | 500 | 800 | 800 | 880 | |
| 4 | — | 300 | 650 | 750 | 780 | |
| 5 | — | 100 | 550 | 670 | 690 | |
| 6 | — | — | 450 | 600 | 580 | |
| 7 | — | — | 300 | 540 | 500 | |
| 8 | — | — | 200 | 490 | 430 | |
| 9 | — | — | 100 | 420 | 390 | |
| 10 | — | — | — | 310 | 300 | |
| 11 | — | — | — | 250 | 240 | |
| 12 | — | — | — | — | 160 | |
| 13 | — | — | — | — | 90 | |
Table 5 summarizes the main contributions of the proposed approach, highlighting its generality in handling various configurations (individual panel, S, SP, P), the consideration of both blocking and bypass diodes, and its high execution speed.
| Application scale | Results validation | Considerations | Execution time |
|---|---|---|---|
|
|
Bypass and blocking diodes considered |
|
3.4. The Proposed Model in an MPPT Application
This section presents a PV generator based on the proposed algorithm connected to a load through a buck converter; this part demonstrates the robustness of the proposed method in the most used application, which is the MPPT. The particle swarm optimization (PSO) is adopted to find the global MPP [43–45], which is a population-based optimization technique inspired by the social behavior of birds and fish. It iteratively adjusts particle positions in the solution space, balancing exploration and exploitation to ensure convergence to the GMPP, even in a nonconvex environment. PSO is favored for MPPT applications due to its simplicity, fast convergence, and adaptability to varying environmental conditions.
In MPPT, PSO initializes a population of duty cycle values, evaluates the corresponding power output, and updates particle positions based on velocity equations. The best-known positions guide the search process, enabling efficient real-time tracking of the optimal power point under dynamic shading conditions. The optimized duty cycle is then applied to the MOSFET switch of the buck converter, regulating the voltage and current supplied to the load [46].
The module/array output voltage is the same through the capacitor C1. Figure 20 shows the PV-Load system based on the MPP tracker.
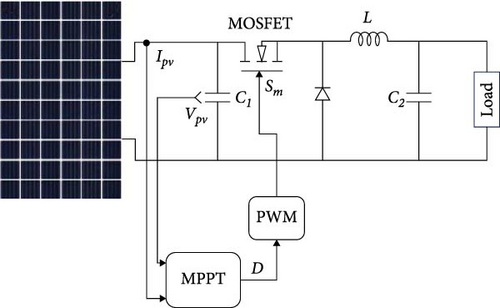
The simulation is conducted in a MATLAB-Simulink environment. The suggested model operates as a PV generator: It is connected to a buck converter via a controlled current source. The buck converter itself is built using the electrical components of Simulink.
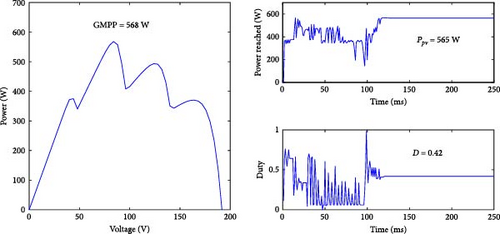
Figures 21 and 22 offer a detailed visualization of the power response under two distinct partial shading patterns. This includes a single PV module divided into three cell groups, each with a parallel bypass diode, as well as two paralleled strings, each consisting of four modules connected in series. These figures highlight the complex interplay between shading conditions and power output in a PV system while also offering insight into the corresponding duty cycle adjustments for each case.
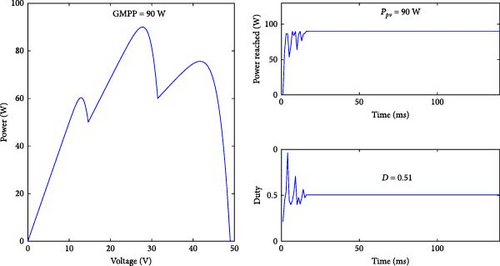
In the individual PV module scenario, reaching the GMPP is achieved with remarkable efficiency, as presented in Figure 21. The process culminates in a rapid time span of 18 ms, testifying to the responsiveness of the optimization procedure. As a result, the optimum duty cycle, which plays a crucial role in the operation of the down converter, converges to around 0.51.
Moving on to the broader context of two parallel strings under two different shading patterns, the application of the proposed modeling algorithm yields equally remarkable results, as depicted in Figure 22. Here, the maximum power output reaches 99.47% of the GMPP. This robust power output, achieved despite the challenges posed by partial shading, underlines the effectiveness of the proposed algorithm in exploiting the system’s potential under complex conditions. The response time for this configuration is 137 ms, reflecting the slightly longer time required to optimize power output when dealing with a more complex profile. In this case, the duty cycle converges around the value of 0.42, indicating the algorithm’s ability to consistently adjust the operation of the buck converter for optimal energy extraction in different scenarios.
In an analysis of the comparative table (Table 6), it is apparent that the PSO-based MPPT exhibits notable efficacy; while the proposed modeling algorithm demonstrates a high level of robustness, the inclusion of switching frequency serves as an indicator of power losses during switch commutations but also highlights the possibility for component defects. Additionally, the complexity is assessed through a tiered level system, with Level 2 denoting higher complexity compared to Level 1. This assessment is based on the algorithmic complexity of the methodologies, focusing on the mathematical operations involved. Collectively, these results provide a convincing demonstration of the practical effectiveness of the proposed modeling algorithm. By skillfully navigating the subtleties of PSCs and rapidly converging to GMPP, the algorithm demonstrates its potential for improving the real-world performance of PV systems. These proofs confirm the algorithm’s ability to maximize electricity production in difficult scenarios, thus advancing the field of PV optimization.
| Paper | Efficiency (%) | Speed of tracking (s) | Switching frequency (kHz) | Complexity | Adopted configuration |
|---|---|---|---|---|---|
| [47] | 99.85 | 0.27 | / | 2 | SP |
| 99.99 | 0.53 | ||||
| [48] | 99.81 | 0.02 | 25 | 1 | S and SP |
| 99.87 | 0.01 | ||||
| [49] | 99.98 | 0.24 | 50 | 2 | SP |
| 99.93 | 0.32 | ||||
| [42] | 99.99 | 1 | 50 | 2 | S |
| 99.99 | 0.9 | ||||
| [50] | 99.97 | 0.77 | 20 | 1 | S |
| 99.57 | 0.7 | ||||
| [51] | 99.93 | 0.2 | 30 | 2 | S |
| 99.49 | 0.2 | ||||
| Proposed approach | 99.99 | 0.02 | 8 | 1 | S and SP |
| 99.47 | 0.01 | ||||
4. Conclusion
An innovative analytical model for PV systems operating under PSCs is presented. The proposed model effectively addresses the challenges posed by PSCs, demonstrating its application in various configurations: individual PV modules, as well as PV arrays in series, parallel, and SP arrangements; it can be coded using any computational software. The outcomes underscore the model’s remarkable efficacy in capturing the intricate dynamics of PV systems under complex PSC scenarios including the bypass and blocking diodes influence. A key advantage of the proposed model is its significantly faster execution time, being up to 40 times quicker than the Simpowersystem approach. Additionally, the model consistently and rapidly converges to the GMPP, maximizing power extraction even under shading-induced challenges. This dynamic capability highlights the model’s effectiveness and reliability in optimizing PV system performance under PSCs.
Conflicts of Interest
The authors declare no conflicts of interest.
Funding
This research was not funded by any organization.
Open Research
Data Availability Statement
The data that support the findings of this study are available from the corresponding author upon reasonable request.


