Experimental Study of PEMFC Stack Performance Degradation Considering the Shutdown and Rest Processes
Abstract
The improvement of durability is one of the most critical factors for expanding the commercialization of proton exchange membrane fuel cells (PEMFCs). Many experimental studies of continuous operation cycles have been carried out to gain an understanding of fuel cell durability, ignoring the shutdown and rest process. This paper performed durability tests over 1000 h in total, including the shutdown and rest processes, to investigate the impact of voltage recovery on cell degradation in real applications. Each durability test was operated only 8–10 h per day, and then the stack entered a shutdown and rest process. The results show that the voltage recovery after the shutdown and rest processes makes the fuel cells maintain the performance in the long term. The performance can be higher than the previous stage, which differs from the constant performance degradation observed in continuous tests. This paper specifically investigates the influence of operating conditions on durability, the characteristics of voltage degradation, and the underlying reasons for those phenomena during dynamic cycles that include shutdown and rest processes. The decrease in voltage uniformity is analyzed. The results indicate that imprecise control of the operating conditions could lead to a reduction in the fuel cell durability. During the processes of voltage degradation and recovery, marked improvements in performance are observed. Following the initial rapid decline in performance, the fuel cell degradation exhibited a strong correlation with the variations in voltage uniformity. Notably, the excessive degradation observed in a certain cell was the primary factor contributing to the reduction in voltage uniformity rather than the overall cell’s nonuniform voltage. The shutdown and rest processes are crucial components of the dynamic cycles, and the mechanism of voltage recovery after the shutdown and rest processes should be focused on to improve the fuel cell life.
1. Introduction
Global warming is one of the inescapable problems in the world today, as the consumption of fossil energy has led to an obvious increase in greenhouse gas emissions [1, 2]. Proton exchange membrane fuel cells (PEMFCs) have become a source of power for an assortment of utilization as a result of their design, operation, and applications and a potential candidate for greenhouse emission reduction [3]. However, the durability issues still limit the commercialization of PEMFC [4–6]. The US Department of Energy (DOE) has set 25,000 h by 2030 as the latest lifetime goal for Class 8 long-haul tractor-trailers [7]. Besides, the European Commission has set 7000 and 28,000 h for light-duty and heavy-duty vehicles [8]. Except for high prices, limited life and fuel cell degradation are considered remarkable among all challenges for fuel cell utilization [9]. Consequently, extensive research carried out on the PEMFC seeks to study the lifetime under practical operating conditions [10, 11].
The durability test of PEMFC plays a very significant role in investigating performance degradation to improve the lifetime of PEMFC. In the durability test of PEMFC, the operation conditions can be divided into steady conditions and dynamic conditions. The steady-state durability test is beneficial for evaluating performance degradation mechanisms under specific current densities. Zhang et al. [12] carried out the durability test of a single cell under open-circuit voltage (OCV) conditions for more than 250 h, demonstrating that the membrane degradation and catalyst agglomeration resulted in unrecoverable degradation. Robin et al. [13] conducted the durability test on 30 cells stack for 2000 h at 0.4 A·cm−2, where the voltage drop behavior at the beginning of life was related to the decrease of electrochemical active surface area (ECSA). Zhao et al. [14] presented the effect of operation temperature and inlet gas humidity on performance degradation under OCV, indicating that the membrane degradation rate was proportionally related to the temperature increase in the range from 64 to 95°C but slowed down via increasing humidity.
However, the vehicular PEMFCs face complex operation conditions in practical applications, such as startup–shutdown, idling, dynamic load, rated load, overload, and freezing–thawing [15], which leads to an accelerated degradation as the frequent changes in load. Compared with the steady operation, the dynamic load cycle shows more true performance degradation in practical applications. Lin et al. [16] reported the performance degradation and microstructure change of a single cell under dynamic load for 370 h. Their experimental results showed that the detected membrane degradation, separation of membrane and electrode, crack in catalyst layer (CL), and decrease of the active surface area resulted from rapid voltage drop. Wang et al. [17] investigated the degradation behavior of a PEMFC stack under dynamic cycles between idling and rated conditions. The voltage degradation rate of rated current density is higher than the idling current density owing to the catalyst corrosion and the carbon oxidation, which could be a result of gas starvation and water flooding under a higher current. Wang et al. [18] further investigated the effect of load-cycling amplitude on the long-term durability of a single cell. They indicated that the high amplitude cycling operation led to faster dissolution and aggregation of the Pt catalyst and further declined durability performance. Moreover, the performance degradation at the constant and dynamic currents [19, 20], the influence of aging and operation level on dynamic behaviors [21], and the performance degradation mechanism under strengthened road vibration [22] were comprehensively studied.
PEMFC is a promising technology with a bright future in vehicular application [23, 24]. Numerous durability experiments have been devoted to studying fuel cell performance degradation. The fuel cell durability experiment is extremely time-consuming and costly [25]; for reasons of the time and cost, it is usually carried out continuously, which leads to neglecting the shutdown and rest process during the operation of the vehicle. The voltage degradation will partially recover after the shutdown and rest process, which affects the degradation trend of fuel cells throughout the entire experimental process. To sum up, the shutdown and rest process is an essential component of vehicular fuel cells during the operational period, exerting a considerable influence on the degradation behavior of the fuel cells. However, the majority of experimental durability studies have overlooked this aspect. Furthermore, most studies remain at the level of degradation results under continuous operation and have not yet investigated the degradation phenomena and mechanisms associated with voltage recovery, which presents certain limitations. Therefore, the durability degradation experiment of fuel cells considering the shutdown and rest process deserves further investigation and confirmation.
In this paper, the 1000-h durability experiment was conducted on a 12-cell stack under the dynamic cycle designed according to the running data of hydrogen fuel cell buses in urban areas. The fuel cell stack operated for only 8–10 h a day and then entered a shutdown and rest process until it was restarted the next day. The first 150-h experiment data was used to support our other work [26]. Firstly, the effects of variations in operating conditions on durability were investigated, which were often overlooked in previous research. Then, the dynamic behavior of voltage degradation and performance degradation considering shutdown and rest process was studied and compared with the continuous durability experiments. Finally, the effects and primary causes of voltage uniformity degradation were analyzed. The pronounced voltage recovery phenomena observed in this paper clearly prove the effect of the shutdown and rest process on fuel cell degradation. Durability experiments for vehicular fuel cells should fully consider this aspect.
2. Experimental
2.1. Experimental Setup
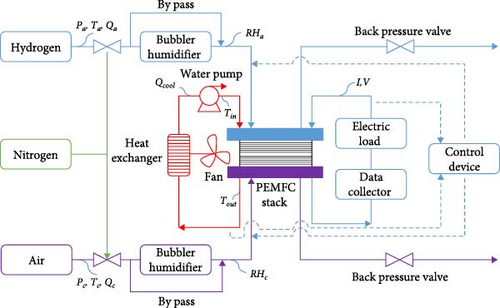
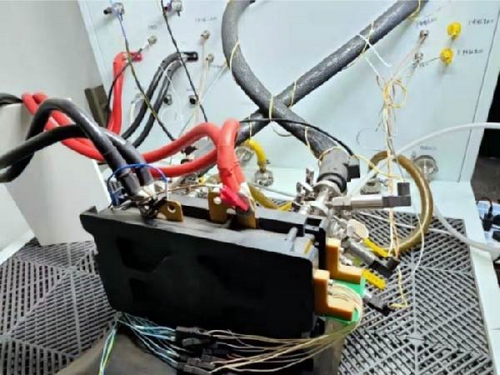
The structure of PEMFC test station NBT-FC5000 utilized in the durability test with a maximum power of 5 kW is shown in Figure 1, which includes the gas supply system, the cooling system, the monitoring system, and an electronic load. Figure 2 shows the tested stack. The graphite bipolar plate stack from the Shanghai SinoFuelCell Co., Ltd., is composed of 12 cells with an active electrode area of 290 cm2, and the rated power of the stack is 3 kW.
2.2. Test Conditions and Dynamic Current Cycles
During the test, the stack temperature was maintained at 70°C for a good operation condition. The stoichiometric ratio of hydrogen and air was separately set to 1.5 and 2 suggested by the stack manufacturer. The gas flow rates were not decreased when the current density was less than 0.3 A·cm−2. The back pressure of the cathode and anode side was set to 0 Pa. The relative humidity of the cathode and anode sides was set to 35%.
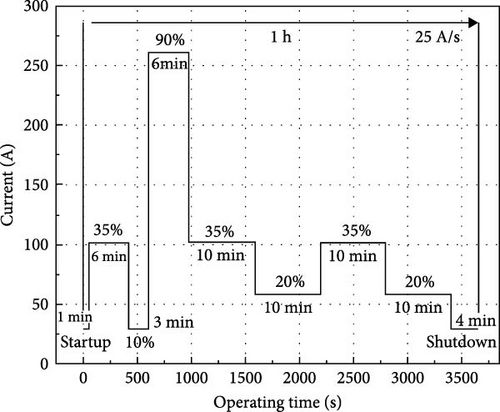
The dynamic cycle designed according to the running data of hydrogen fuel cell buses in urban areas is shown in Figure 3, which consists of idling conditions, low operating conditions, smooth operating conditions, and high-power operating conditions. The frequency and operating time at different operating conditions are shown in Table 1. The driving loads changed with a rate of 25 A·s−1. The fuel cell stack had been activated until the performance reached a stable state before the durability test.
| Operating condition | Frequency | Operating time (min) |
|---|---|---|
| Idling condition (0.1 A·cm−2) | 6 | 12 |
| Low operating condition (0.2 A·cm−2) | 4 | 16 |
| Smooth operating condition (0.35 A·cm−2) | 4 | 20 |
| High power operating condition (1 A·cm−2) | 3 | 12 |
2.3. Polarization Curves and the Testing Procedure
In order to investigate the performance degradation of the fuel cell stack, polarization curves were measured every 50 cycles. The test conditions for the polarization curves were consistent with the dynamic cycling condition, except the cathode back pressure set at 75 kPa and the anode back pressure set at 70 kPa. Eight to 10 dynamic cycles were run daily to simulate fuel cell buses’ actual operation.
3. Results and Discussion
3.1. The Actual Operating Conditions in the Durability Test
During the tests, it is hoped that the operating conditions of the stack are sustained at the predetermined parameters. However, these conditions are subject to change due to factors such as the control precision of the test bench and the changes in load, which may have a negative effect on durability. To investigate the variations in operating conditions, all data selected for analysis are derived from the same cycle.
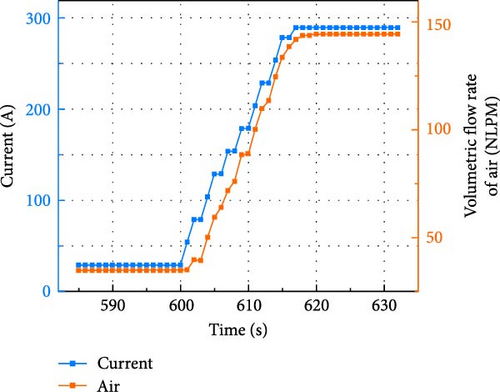
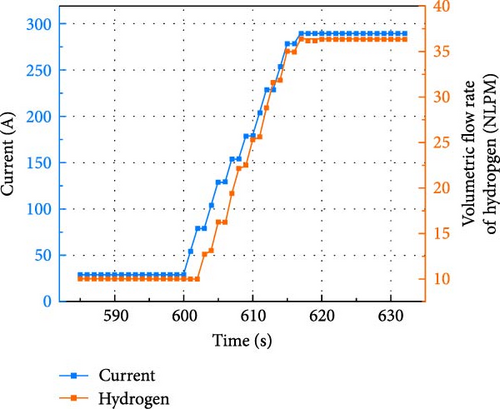
Figure 4a,b shows the air and hydrogen flow rates when the current is loaded from 29 to 261 A at 600 s, a range that demonstrates the largest and most representative magnitudes of load change to reflect the response of the gas supply. As shown in the figures, the gas supply experiences a delay of ~1 s for air throughout the entire load change stage and 2 s for hydrogen at the beginning. Due to hydrogen’s low viscosity and density, it can respond more promptly. It is important to note that the flow rates are measured from the inlet manifold; hence, the delay time for the gas supply to reach the reaction site will be longer. In the load-up process, the reactant supply lags behind the current increases [27], resulting in gas starvation.
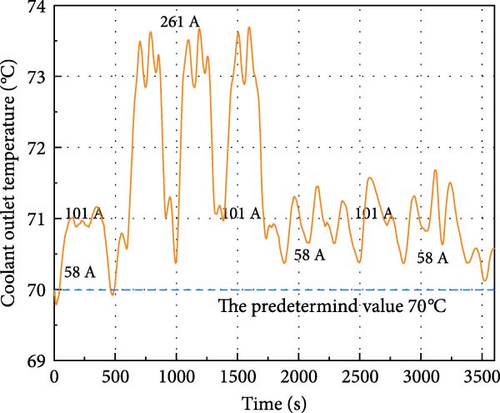
Owing to the intricate structure, the internal temperature of the fuel cell stack is challenging to monitor. Thus, the coolant outlet temperature of the stack is typically used to assess the stack operating temperature. As the load changes, the heat released from the fuel cell and the stack temperature also vary, causing fluctuations in the coolant outlet temperature, as displayed in Figure 5. The temperature control system cannot perfectly regulate the stack temperature. At relatively high loads, the coolant temperature cannot be maintained at 70°C. Consequently, high temperatures within the fuel cell are inevitable. Temperature is a critical factor affecting fuel cell performance, with high temperatures known to accelerate membrane chemical degradation. Under severe conditions, this can lead to irreversible membrane damage, such as perforation.
The relative humidity can be controlled by the dew point temperature and the gas temperature. However, maintaining a stable dew point temperature during durability tests is difficult, leading to variations in inlet gas relative humidity. Figure 6 shows the variations in air and hydrogen relative humidity at the inlet, with cyclic changes in hydrogen and air humidity increasing progressively over time. The inlet gas humidity was set to 35%, but the air humidity reached a maximum of 42.5%, and the hydrogen humidity reached a maximum of 48.1%. Humidity cycling also significantly influences membrane mechanical degradation [28]. At high power loads, high relative humidity of inlet gas was more likely to cause water flooding.

3.2. Dynamic Behavior of Voltage Degradation
Figure 7 illustrates the dynamic behavior of stack voltage degradation at 0.35 and 1 A·cm−2 within 1000 cycles. Voltages for each cycle are derived from the steady-state average value. In the first 200 cycles, voltages at 0.35 and 1 A·cm−2 decline rapidly, while the degradation rate gradually slows down between the 200th cycle and the 400th cycle. Sharma et al. [29] quantified the impact of different Pt catalyst degradation mechanisms on the loss of ECSA. The growth of Pt particles, which most significantly affects ECSA loss, initially occurs rapidly and then gradually decreases. This could be the rapid voltage degradation in the first 200 cycles. Cong et al. [30] studied the degradation of PEMFC under load cycling conditions. The experimental results also showed that the ECSA loss was rapid in the beginning and gradually slowed down. The loss of Pt surface area occurring in the voltage cycles results in unrecoverable performance degradation [17]. Therefore, the rapidly ECSA loss in the beginning could be the reason for voltage degradation in the first 200 cycles. However, the characterization of ECSA loss was not conducted due to the lack and limitation of the ex situ characterization approach in this paper.

Throughout the entire durability test, the voltage degradation trend exhibits strong volatility, where three sharp increases of voltage can be observed, occurring at the 35th, 437th, and 758th cycles, respectively. Although the reason for the sharp voltage increase is not fully understood, this phenomenon is of great significance to the durability improvement of long-term operated fuel cells. One possible reason for the sharp increase in voltage could be that favorable changes occur in the microstructure of the CL and diffusion layer, resulting in improved gas transport and the re-establishment of electron and proton transfer channels; even the detached catalyst from the active sites may be restored. More effective characterization methods are needed to support the reasons for the sharp increase in voltage. Due to the sharp increase in voltage, the stack performance at the 1000th cycle is even higher than the 437th cycle. Additionally, voltage recovery magnitude is more pronounced at 1 A·cm−2, likely due to difficulties in controlling operating conditions and the significant amount of water generated under high power loads.
Figure 8 demonstrates the stack voltage variation from the 528th to the 575th cycle, with eight cycles conducted each day during this period. Clearly, voltage recovery occurs when the fuel cell stack starts working at the beginning of each day, similar to the study by Han, Han, and Yu [31]. One possible reason for the voltage recovery is that the excessive accumulation of water leads to the blockage of the porous medium, which can be removed from the rest process. Thus, better water management is obtained, and the performance degradation due to the water flood can be recovered. As a result, it is anticipated that fuel cell stacks in vehicular applications will demonstrate a similar recoverable dynamic behavior in performance degradation.

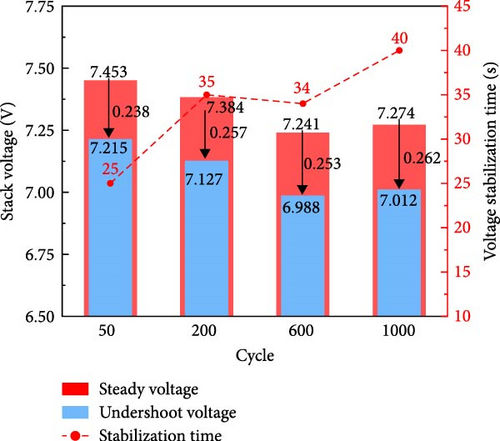
During the step-up of fuel cell current, a transient voltage drop occurs due to the delayed gas response, which is referred to as undershoot [21]. Apart from the gas response, changes in membrane water content are also a major factor contributing to the occurrence of undershoot [32]. The dynamic loading condition can cause the expansion or contraction of the membrane, resulting in mechanical membrane degradation. The undershoot phenomenon occurred when the current rose from 0.1 to 1 A·cm−2 is depicted in Figure 9. As the number of cycles increased, the magnitude of undershoot voltage also increased correspondingly. Additionally, Figure 9 also shows the so-called stabilization time, which is ~25 s at 50 cycles and 40 s at 1000 cycles. These phenomena indicate an increase in gas transport resistance or membrane resistance, which results from the degradation of the membrane electrode assembly (MEA).
3.3. The Degradation of the PEMFC Stack
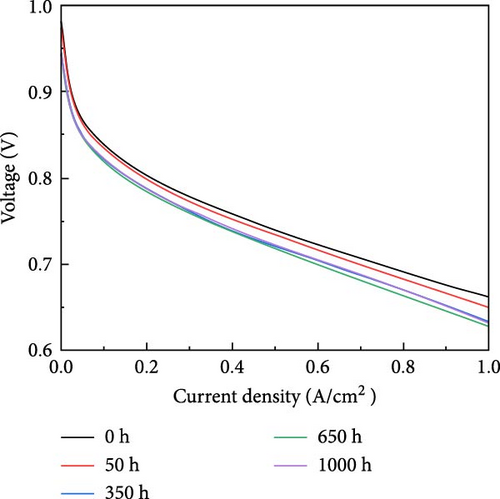
Polarization curves are measured to observe the performance degradation every 50 cycles; different degradation stages are distinguished and described separately in Figure 10. The stack voltage declines sharply from the beginning to the 100th cycle; however, in contrast to the continuous durability test, the degradation rate gradually slows, and the stack performance stabilizes for an extended period. The polarization curves for the 150th to the 300th cycle display slight degradation in the activation and ohmic polarization regions, while the stack performance remains unaltered within the concentration polarization area. Meanwhile, it should be noted that there is a significant sudden degradation in OCV from the 250th to the 300th cycle. After 300 cycles, the stack performance remained stable until the end of the test. This result fully demonstrated the fuel cells’ performance degradation characteristics considering the rest process and the difference with the continuous durability test. The voltage degradation behavior of the durability test considering the shutdown and rest process in this paper is different from the continuous durability tests [17, 33, 34].

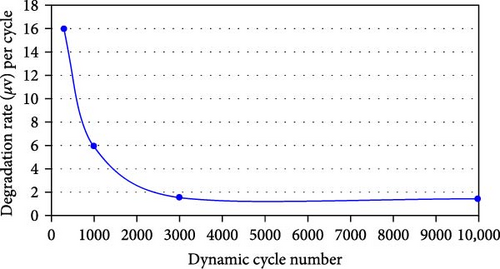
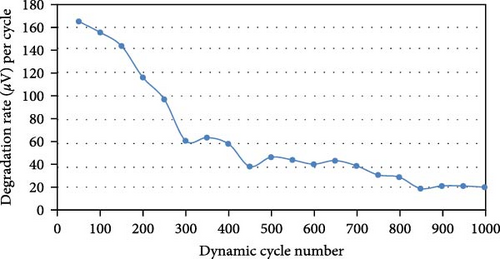
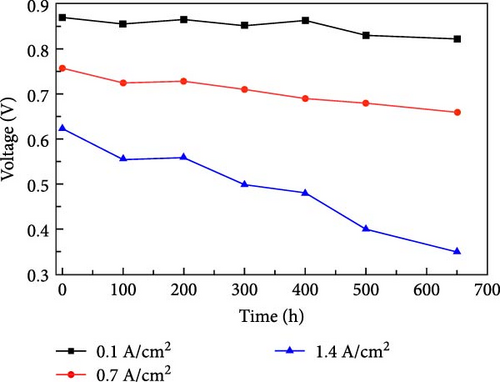
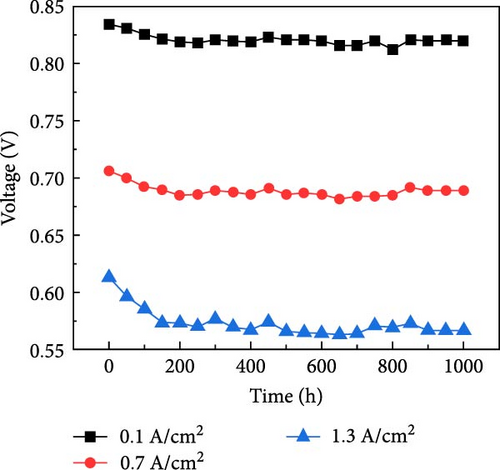
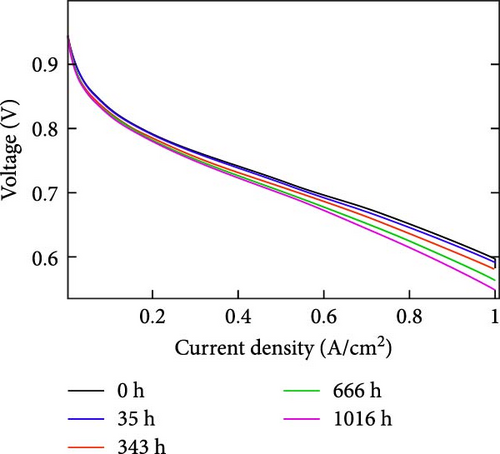
For a more clear illustration, Figure 11 shows the voltage degradation behavior under dynamic cycles, as reported by Wang et al. [17], He et al. [33], and Mao, Jackson, and Jackson [34], and provide comparative results in this paper. Compared with Figure 11a, Figure 11b shows a completely different trend of voltage degradation, a consistently declining trend of degradation rate as the number of cycles increases and a noticeable fluctuation phenomenon caused by voltage recovery after shutdown and rest processes. It should be noted that the units of voltage degradation rate in Figure 11a,b, the consistently declining voltage degradation rate, is due to the stabilization of the performance as the number of cycles increases. It is precisely because of this point, leading to that Figure 11d differs from Figure 11c and Figure 11f differs from Figure 11d. Compared with Figure 11e, the polarization curves of Figure 11f not only do not decrease continuously, but the performance of 1000 h even exceeds 650 h. The comparative experimental results demonstrated that the voltage recovery phenomenon after the shutdown and rest process can be helpful to stabilize the fuel cell performance, thus mitigating the sustained voltage degradation. Thus, the continuous degradation testing may result in incorrect evaluations of the vehicular fuel cell life.
To further clearly observe and analyze performance degradation at different polarization areas, voltage degradation rates at different current densities at the OCV, activation polarization area, ohmic polarization area, and concentration polarization area are shown in Figure 12a. The reduced OCV signifies increased hydrogen crossover. Compared to other current densities, OCV exhibits a more rapid degradation between the 150th and the 300th cycles. The formation of pinholes and cracks within the proton exchange membrane usually occurs in the early life of the PEMFC [35, 36]. The excessive hydrogen crossover caused by the above reasons may reasonably account for the rapid OCV decrease observed experimentally.
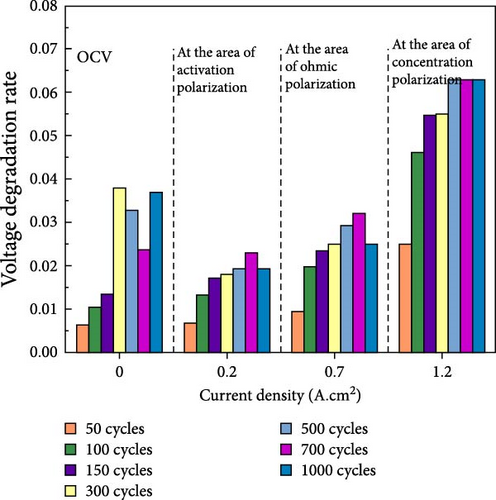
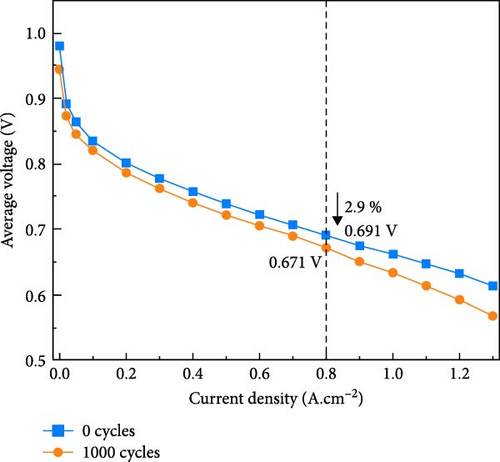
Figure 12b shows the polarization curve before and after the durability test. As evidenced by the nearly constant slope of polarization curves within the ohmic polarization area, the internal resistance, primarily originating from the membrane, only experiences a slight increase. Prior to the durability test, concentration polarization phenomena were absent in the curves. However, it becomes clearly discernible after 1000 cycles, indicating increased gas transport resistance caused by MEA degradation. The findings regarding degraded stack performance characterization corroborate one another with those presented in Section 3.1.
Based on the obtained experimental results and references, the irreversible degradation of the membrane and catalyst during the early stages may be the primary cause of the rapid stack performance degradation. As the unrecoverable voltage degradation weakens, the recoverable voltage degradation gradually becomes the primary performance degradation factor. Therefore, the subsequent fuel cell performance was maintained within a stable range under recoverable conditions. However, further studies are still needed to clarify the exact reason for the initial rapid voltage decline and quantify the role of recoverable voltage after the rest process for performance maintenance in fuel cells.
3.4. Individual Cell Voltage Uniformity
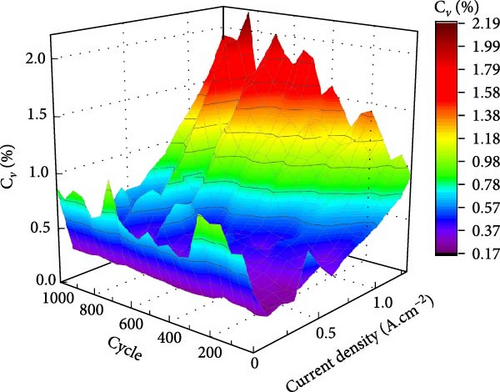
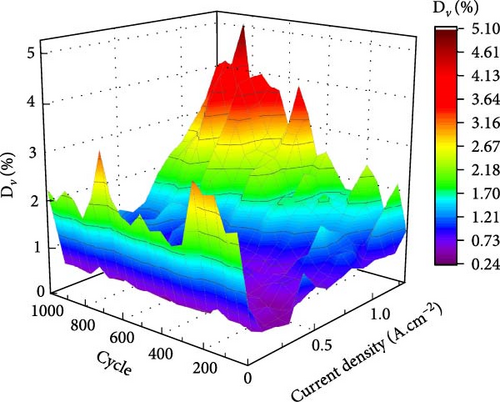
Figure 13a,b shows Cv and Dv at the different cycles and current densities. The value of Cv under an open circuit exceeds is significant, indicating that the hydrogen crossover degree of the proton exchange membrane in the 12 cells varies significantly due to the manufacturing defects. Apart from the open circuit, as the current density rises, both Cv and Dv of the stack increase, indicating worsening uniformity. One crucial observation is that the changing trends of Dv strongly align with those of Cv.
To further analyze the primary cause for the worsening voltage uniformity, Figure 14 presents the voltage degradation rate of cells 1 and 8 at different cycles under 0.8 A·cm−2, as well as the voltage standard deviation of individual cells. The performance degradation of cells 8 and 12 is the most severe, while the degradation trends of other cells do not differ significantly. Therefore, the most representative cells, No. 8 and No. 1, are selected to represent individual cells with serve degradation and the majority of cells with normal degradation, respectively. Before the 400th cycle, both cell 8 and cell 1 exhibited an increasing trend of degradation rates that correlated with the standard voltage deviation of the stack. However, between the 400th cycle and the 800th cycle, the degradation rate of cell 1 decreased continuously. In contrast, the standard deviation of the stack voltage does not decrease and continues to exhibit a trend that is synchronized with the voltage degradation rate of cell 8. In comparison, the voltage standard deviation consistently demonstrates a similar variation with the voltage degradation rate of cell 8. The results in Figures 13 and 14 imply that the degradation of stack voltage uniformity may result from the excessive degradation of certain individual cells rather than the overall cell’s nonuniform voltage. Excessive degradation of certain individual cells leads to a further deterioration in voltage uniformity.
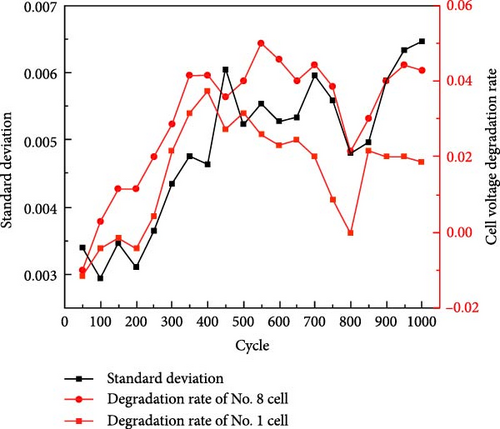
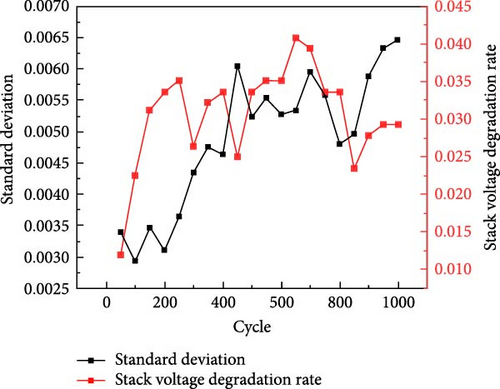
Figure 15 shows the stack voltage degradation rate and standard deviation at different cycles under 0.8 A·cm−2. There seems to be no correlation between voltage uniformity and voltage degradation rate before 500 cycles. However, the changing trends of stack voltage degradation rate strongly align with the cell voltage uniformity after 500 cycles. In the initial stages, the stack performance rapidly decreases, and the reasons may be the intricate unrecoverable voltage degradation phenomena occurring in the initial stages, such as Pt catalyst degradation, hydrogen crossover in the membrane, and other factors. When the stack performance comes to a stable stage, the effect of voltage uniformity becomes critical. Therefore, excessive degradation of individual cells should be minimized as much as possible, especially in stacks with a limited number of fuel cells. The voltage uniformity has an important impact on the durability of fuel cells.
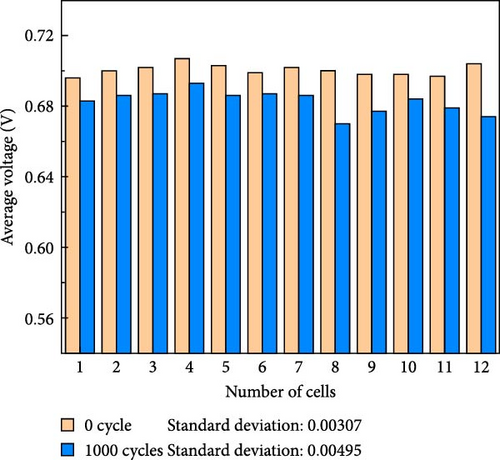
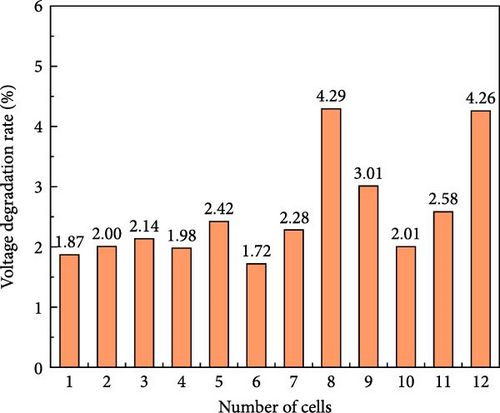
The voltages of individual fuel cells correspond to the 0.8 A·cm−2, and performance degradation is recorded. Before the durability test, the PEMFC stack voltage was homogeneous, as shown in Figure 16a; however, homogeneity significantly decreased after 1000 cycles. The voltage standard deviation increased from 0.00307 to 0.00495, which proved the different behaviors of fuel cell performance degradation. Figure 16b reveals that the voltage degradation rate for cells 11 and 12 is higher than that of most other cells. This can be attributed to the more severe performance degradation of fuel cells adjacent to the inlet/outlet due to the uniform gas and water distribution [37]. The performance degradation of cell 8 surpasses that of all other cells and directly impacts the stack voltage uniformity. The excessive degradation of cell 8 may be associated with the quality of the MEA or improper MEA manufacturing processes. The significant decrease in voltage uniformity should be regarded as one of the primary causes of stack performance degradation.
4. Conclusion
- 1.
The operation conditions of the durability test, such as gas supply and fuel cell temperature, should be maintained at the predetermined values. In the case of long-term operation, imprecise control of the operating conditions can lead to a reduction in the fuel cell durability. For example, the gas supply should be appropriately advanced during the load-up to avoid gas starvation. To avoid overheating of the stack at high power, the stack thermal management should be strengthened, such as more diversified forms of heat dissipation, more efficient heat exchangers, and so on. The inlet gas humidity should be kept at the predetermined value to avoid water flooding as much as possible.
- 2.
The fuel cells considering the shutdown and rest process are accompanied by voltage recovery phenomenon during the degradation process. In addition, there are sharp voltage increase phenomena that may result from the favorable changes in the microstructure of the CL and diffusion layer at some point. The voltage degradation behaviors are completely different between the constant durability experiment and the experiment considering the shutdown and rest process. Therefore, experimental studies that investigate the durability of vehicular fuel cells should consider the shutdown and rest process and the mechanism of voltage recovery after the shutdown and rest processes should be focused on improving the fuel cell life.
- 3.
In the experiment of this paper, the main performance degradation of fuel cells comes from the early stage rather than the later. The reasons for the initially rapid degradation may be the intricate unrecoverable voltage degradation, such as Pt catalyst degradation, hydrogen crossover in the membrane, and other factors. In terms of improving the durability of fuel cells, the stability of the early performance is a very important factor.
- 4.
The reduced stack voltage uniformity is more due to the excessive degradation of cell 8 rather than the overall cell’s nonuniform voltage. There is a strong correlation between the stack voltage degradation rate and the change in the stack voltage uniformity. Therefore, voltage uniformity is also an important factor for the improvement of fuel cell durability. Excessive degradation of individual cells should be avoided as much as possible through good operating strategies and manufacturing processes, especially in stacks with a limited number of fuel cells.
The durability test was costly in time and resources due to the consideration of shutdown and rest process. However, more experimental characterization approaches need to be developed to further analyze the experimental phenomena and verify the speculations. Further work will be devoted to the development of experimental characterization approaches and the quantification of the effect of recoverable voltage after shutdown and rest process on performance degradation.
Conflicts of Interest
The authors declare no conflicts of interest.
Funding
This research is supported by the Key Research and Development Program of Hubei province (Grant No. 2023BAB114) and the National Key Research and Development Program of China (Grant No. 2018YFB0105503).
Open Research
Data Availability Statement
The data that support the findings of this study are available from the corresponding author upon reasonable request.


