A Multiphase and Multicomponent Model Considering Molecular Diffusion for Simulating Shale Oil Reservoirs With Complex Fracture Networks
Abstract
Molecular diffusion is a critical mechanism of enhance oil recovery (EOR) in developing shale oil reservoir by huff “n” puff. The ultra-low permeability lead to the accumulation of injected gas within the complex fracture networks (CFNs), thereby, enhancing concentration gradient and mass transfer by molecular diffusion between the CFNs and matrix. A proper understanding of CFNs influence on molecular diffusive mass transfer becomes critical for predicting oil recovery and remaining oil distribution in shale oil reservoirs. Therefore, a multiphase and multicomponent mathematical model with molecular diffusion was developed for describing mass transfer of molecular diffusion. Molecular diffusion coefficients were predicted by the extend Sigmund method. The finite volume method (FVM) and two-point flux approximation (TPFA) were applied to discretize and approximate mass transfer equations. The embedded discrete fracture model (EDFM) was utilized to explicitly simulate CFNs and extended to couple mass transfer by molecular diffusion in the fracture to that in the matrix. Model validation clearly demonstrates that the proposed numerical model is capable of effectively and accurately simulating diffusion mass transfer in shale oil reservoirs with CFNs. By applying the proposed numerical compositional model, a series of synthetical models with molecular diffusion were developed by CO2 huff “n” puff. The simulation results indicated that molecular diffusion is crucial to EOR in developing shale oil reservoirs with CFNs by huff “n” puff, particularly in the injection and soaking stage. However, molecular diffusion contributes to an increased gas production during the production phase. In addition, larger fracture density benefits diffusive mass transfer to EOR by increasing contact areas. And higher diffusion coefficients improve diffusive mobility, which boosts diffusive mass transfer. Meanwhile, greater injection rate additionally makes concentration difference of injected component between fractures and matrix system to rise, resulting in more injected component transferring into matrix. This paper provides a better understanding of molecular diffusion mechanism for EOR in development shale oil reservoirs with CFNs by huff “n” puff.
1. Introduction
Shale reservoirs have attracted significant attention owing to the growing global demand for energy in the 21st century [1–3]. The shale formation is defined as a geological layer primarily composed of shale, a sedimentary rock type, typically exhibiting a high content of organic matter. The pore structure within shale formation encompasses pores spanning scales from the nanometer to the micrometer, consequently leads to exceptionally low permeability [4–6]. Furthermore, natural fractures are developed within shale reservoirs [7, 8].
The complex fracture networks (CFNs) is generated as a result of large-scale volumetric fracturing. Gas huff “n” puff injection is one of the effective methods to enhance oil recovery (EOR) in developing shale oil reservoirs [9–12]. Molecular diffusion mechanism plays an important role for EOR by gas huff “n” puff in developing shale oil reservoirs with CFNs [13–16]. Thus, it is critical to develop a numerical simulator that is able to precisely simulate molecular diffusion in shale oil reservoirs with CFNs for researching on the mechanism of gas huff “n” puff to EOR.
Diffusion coefficient is one of the most crucial variables for describing diffusive transfer. In order to accurately calculate it, numerous academics developed several methodologies, such as Wilke–Chang correlation [17], Sigmund method [18, 19], Hayduk–Minhas correlation [20], extended Sigmund method [21], Maxwell–Stefan (MS) equation with thermodynamics [22], MS equation considering thermodynamics and fluid viscosity [23]. Considerable effort has been devoted to determining the calculation methods of diffusion coefficient for various reservoirs [24–26]. However, research on such methods for shale oil reservoirs remains relatively limited. Du and Nojabaei [27] pointed out that extended Sigmund correlation is suitable to predict diffusion coefficients. Extend Sigmund correlation, consequently, is adopted to estimate diffusion coefficients in this paper.
Reservoir modeling constructs CFNs based on the mathematical models for characterizing these networks, which directly influence the accuracy of mass transfer simulations within them. For the purpose of simultaneously simulating convection and molecular diffusion in fractured shale oil and gas reservoirs, several scholars developed various numerical models. By integrating dual porosity approach with discrete methods, such as finite difference method, finite volume method (FVM), and numerous simulation models were constructed to simulate mass transfer by diffusion for fractured reservoirs with multiphase [28–30], and key fracture parameters were calibrated using history matching methods [31]. Some researchers developed a more comprehensive model, namely, dual-fracture triple-porosity model, in which there are two kinds of fractures and three types of porosity [32]. A multiple interacting continua method (MINC) was also utilized to simulate mass transfer of diffusion in fractured oil reservoir [15, 33]. They constructed the numerical model for simulating mass transport of diffusion with the assumption that the fractured media is continua. However, in practical unconventional reservoirs, the distribution of fractures is discrete, even in a highly fractured media.
For solving this issue, a single-porosity numerical model was also used to simulate mass transfer by diffusion without special equation for calculating diffusive mass transfer between matrix and fractures [34, 35]. They characterized fractures by designing sharply distinct grid size and assigning completely different geological parameters, which were completely different from matrix. Nevertheless, sharp distinction in properties between matrix and fracture cells in contact maybe lead to poor convergence and raise computing cost. In addition, there are additional grid orientation effects for characterizing fractures in this numerical model.
Therefore, a discrete fracture model was developed for describing mass transfer of diffusion. The mixed finite element and discontinuous methodology were combined to approximate mathematical formulas. The cross-flow equilibrium concept was introduced for avoiding the calculation of mass transfer by diffusion between matrix and fractures [13, 36]. They pointed out that the proposed discrete fracture model not only has the capacity to diminish the grid orientation effects and decrease the CPU time, but also accurately predict mass transfer by diffusion. The discrete model was also constructed for understanding mass transfer of diffusion by numerous researchers applying other discrete method, such as the methodology combining the FVM with two-point flux approximation (TPFA) [37] and control-volume finite-element method (CVFEM) [38].
In discrete fracture models, the fractures are typically surrounded by unstructured grids representing matrix, which will result in exceedingly complex grids and make it difficult to model reservoirs with a wide range of fracture length scales [39, 40]. Embedded discrete fracture model (EDFM) is widely utilized to simulate unconventional fractured reservoirs since it is flexibility and accuracy for describing CFNs [41–43]. Based on that, an EDFM considering molecular diffusion was built up for simulating mass transfer by diffusion in unconventional oil reservoirs with CFNs [44]. They used the proposed model to research the effects of CO2 diffusion on EOR in tight oil reservoirs with CFNs during CO2 huff “n” puff. Nevertheless, the diffusivity between two finite control volumes was not expressly stated, especially for that between matrix and fractures. For modifying above issues, MS diffusion model was added to EDFM for describing molecular diffusion by Olorode, Amer, and Rashid [45]. They derived the diffusivity formulation, but did not check against experimental data or other simulators. In summary, EDFM effectively simulates convective mass transfer in CFNs, but remains unvalidated for molecular diffusion-driven mass transfer and lacks comparisons with experimental data or commercial simulators to substantiate the accuracy of the proposed model.
This paper constructed a mathematic model for simulating mass transfer of convection and molecular diffusion simultaneously, which was discretized by FVM. And extend Sigmund method for predicting diffusion coefficient was adopted. Meanwhile, EDFM was derived to describe diffusive mass transport in CFNs, including diffusion between matrix and fractures and diffusion between intersecting fractures. The correctness of the numerical model proposed in this paper was verified by comparing with commercial simulator, Eclipse. Finally, a number of numerical models were developed to investigate the effect of molecular diffusion and key parameters, such as fracture density, diffusion coefficient, and injection rate, on EOR in shale oil reservoirs with CFNs.
2. Methodolgy
2.1. Model Setup
Within this part, the methodology was presented in detail to obtain the discretization of the mass-balance equation with molecular diffusion in shale oil reservoirs with CFNs. For the purpose of calculating phase equilibrium, Peng–Robinson (PR) equation of state and flash computation was employed. Adsorption was not considered in this study. Simultaneously, it is assumed that none of the components dissolve in the water.
2.2. Governing Equations of Diffusion Model
Based on quality conservation principle, a reservoir model with CFNs considering molecular diffusion of component i in phase l was proposed. There are two systems, namely, matrix system and fracture system. For the fracture system, EDFM was utilized to explicitly describe CFNs. In EDFM, the theory of nonneighboring connections (NNCs) was introduced to couple mass transfer in a fracture cell to that in the matrix cell it located.
2.3. Discretization of the Governing Equations
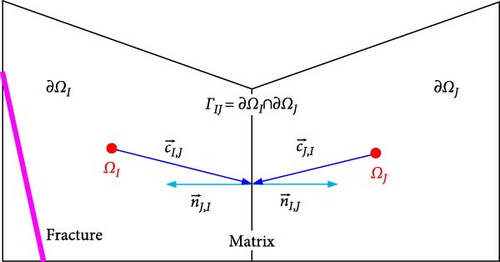
In this section, it is forced on how to employ FVM to discretize the governing equations for describing mass transfer of matrix and fracture system, which are presented in Equations (1)–(3). Using the oil and gas phases as examples, a detailed derivation of the discretization of the governing equations is provided. In FVM, the unknown parameters were described using average values calculated over a number of finite control volume [40]. Figure 1 shows any two neighboring finite control volume cells of matrix and fracture system in the discrete grid. There are two finite control volume cells: ΩI and ΩJ. ∂ΩI and ∂ΩJ are the boundaries of the two cells. ΓIJ is the face shared by the two cells. cI,J and cJ,I are vector from the centroid of the two finite control volume cells to that of the intersecting face ГIJ. nI,J is the unit normal of the contact surface ΓIJ of the cell ΩI, whose direction is to the outside of cell ΩI. For the unit normal of the cell ΩJ at the intersecting face ΓIJ; however, the direction of it is opposite to that of unit normal nI,J, that is, –nJ,I = nI,J.
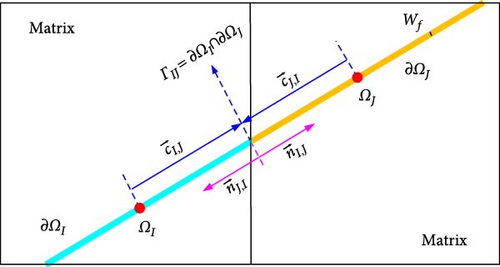
As shown in Equation 5, the mass transfer of diffusion includes that of molecular diffusion and dispersion. It is worth nothing that flow velocities in the matrix are low, especially for shale oil reservoirs. Therefore, the dispersion in the matrix was not taken into account. In the fracture networks system, fluids velocities are higher than that in the matrix. However, the diffusion does not have a pronounced effect because of slight concentration difference. As a result, the dispersion was also not considered.
2.4. Discretization of Diffusion in the EDFM
EDFM was first introduced by Lee, Lough, and Jensen [50] to model a few isolated and unconnected fractures. They found that the pressure gradient surrounding fractures is less than that around wells. Based on this finding, Li and Lee [51] made an assumption that the pressure gradient surrounding fractures is linear. And the equation of convective mass transfer between fracture networks and matrix was derived with this assumption.
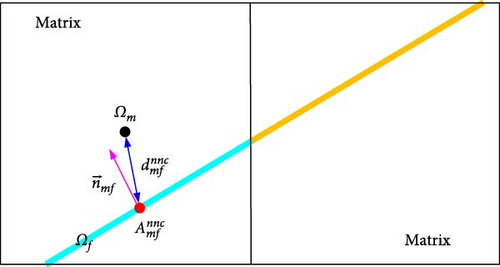
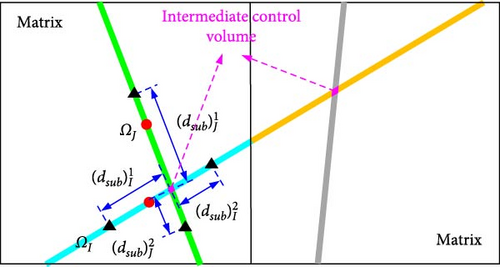
For fracture system, however, there is another type of NNC, that is, the NNC between two intersecting fractures as presented in Figure 2b. There is a common intersection area at the junction of two fracture cells named intermediate control volume. Its size is so small in comparison to the fracture cell that its contribution to the convective transmissibility is approximately negligible [53].
3. Model Validation
In order to validate the correctness of the new developed compositional numerical model for computing mass transfer of diffusion, the results calculated by commercial simulator, Eclipse, were taken as the trustworthy reference solution. Several synthetic cases were built based on the publicly available data.
It is assumed that the crude oil in the model consists of six pseudo-components, that is, N2/C1, CO2, C2–5, C6–13, C14–24, and C25–80. The molar fractions of each corresponding component are 0.4630, 0.0164, 0.2052, 0.1911, 0.0811, and 0.0432, respectively. The key fluid properties were estimated by applying the PR equation of state and flash calculation at the reservoir temperature of 387.45 K: bubble point pressure is 22.60 MPa, and minimum miscibility pressure (MMP) is 25.33 MPa, which are presented by Mallison et al. [55].
In the commercial simulator Eclipse 300, two diffusion models are available, driven by the gradient of concentration and chemical potential, respectively. In the diffusion model driven by the concentration gradient (CGDM), the method of calculating diffusion flow is consistent with that of this paper. Thus, the CGDM was selected to compute mass transfer of diffusion. However, the diffusion coefficient of each component in each phase can only be set to constant in the CGDM. Additionally, the dispersion is not taken into account in the CGDM. Therefore, the diffusion coefficient of each component in each phase is set as a constant. Meanwhile, the dispersion is neglected. Table 1 lists the diffusion coefficient of each component in each phase. In order to obviously present the comparison between with and without diffusion, the diffusion coefficients were set greater.
| Component | Diffusion coefficient | |
|---|---|---|
| Oil phase (m2/day) | Gas phase (m2/day) | |
| N2/CH4 | 0.06 | 0.60 |
| CO2 | 0.05 | 0.50 |
| C2–5 | 0.04 | 0.40 |
| C6–13 | 0.03 | 0.30 |
| C14–24 | 0.02 | 0.20 |
| C25–80 | 0.01 | 0.10 |
Figure 3 shows the reservoir model with intersecting fractures, in which the matrix–cell size is 10m × 10m × 10 m, a total of 41 × 25 × 1 cells. According to the geometric feature of shale oil reservoirs, the permeability, tortuosity, and porosity assigned to each matrix cell is 1 × 10⁻³ mD, 1.00, and 0.07, respectively. The initial pressure in the model is setup 18.00 MPa for modeling two phases flow. Table 2 lists all of the physical properties in the model.
| Parameters | Value | Parameters | Value |
|---|---|---|---|
| Matrix–cell size | 10m × 10m×10 m | Initial reservoir pressure | 18.00 MPa |
| Matrix–cell dimension | 41 × 25 × 1 | Initial reservoir temperature | 387.45 K |
| Matrix permeability | 1.00 × 10⁻³ mD | Horizontal well length | 280.00 m |
| Matrix porosity | 0.07 | Rock compressibility | 1.000 × 10⁻⁶ MPa−1 |
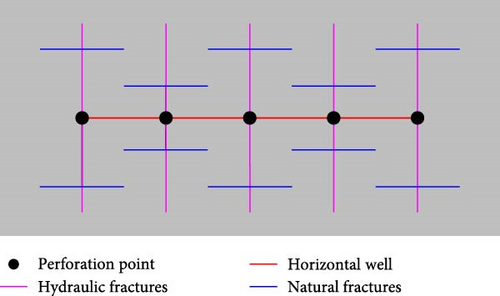
From Figure 3, there is a horizontal well with five perforations parallel to x direction in the middle of the reservoir model. Besides, five planner hydraulic fractures are perpendicular to the horizontal well-bore. The half-length of each hydraulic fracture is 75.00. The conductivity, tortuosity, and porosity assigned to each hydraulic fracture are assumed 100 mD·m, 1.0, and 0.002, respectively. The natural fractures differ from hydraulic fractures only in that the length of each natural fracture is 35 m. And other physical characteristics are the same as those of hydraulic fractures.
In the CGDM model, the local grid refinement (LGR) method was applied to describe the flow between matrix and fracture cells. In order to get the aperture of each natural fracture, the grid dimension of each cell where the natural fractures are placed is 1 × 3 × 1, and the grid size in the y direction is set to 4.975, 0.050, and 4.975 m. In the meantime, the grid size in the x and z directions are the same as that of other matrix cells.
The huff “n” puff development with two cycles was adopted. For the first 60 days, the well is allowed to flow naturally. At this stage, the constant flowing bottom hole pressure (BHP) of 8.0 MPa is set to the horizontal well. Then the well is converted to injection that injects CO2 for 30 days. The fixed injected rate is 200.0 SCm2/day. Subsequently, the well is shut down for 30 days, that is, the well enters the soaking period. Finally, the well is put back into production for 120 days with a continuous BHP of 8.0 MPa. In next cycle, the well schedule will repeat.
Figure 4 displays the oil and gas production rate computed by EDFM and CGDM with and without molecular diffusion.
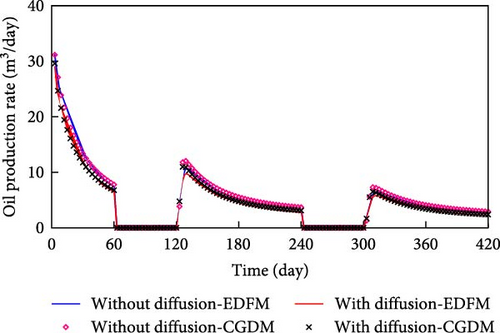

From Figure 4, the oil production rate of the model that takes molecular diffusion into account is lower than that of the model does not, while the gas production rate is opposite (based on the same line type comparison). According to the comparison of the oil and gas production rate calculated by EDFM and CGDM, there is a good match between EDFM and CGDM in general (based on a comparison of lines and symbols).
Figure 5 compares the average reservoir pressure and BHP for the reservoir model with intersecting fractures simulated by EDFM and CGDM with and without molecular diffusion.

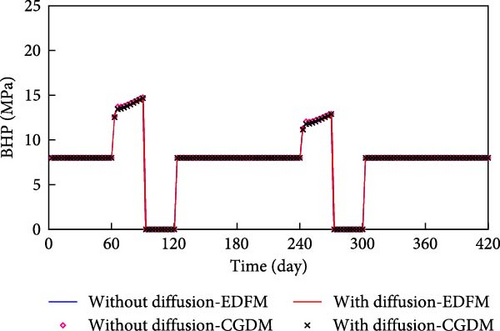
From Figure 5, the average reservoir pressure computed by EDFM fits generally with that calculated by CGDM for the reservoir model with molecular diffusion (based on a comparison of lines and symbols). For the BHP, molecular diffusion has a slightly influence on it. A perfect match between EDFM and CGDM is also obtained according to the comparisons about the BHP for the molecular diffusion-added model (based on a comparison of lines and symbols).
The components C2–5, C6–13, C14–24, and C25–80 are present at higher concentrations in the oil phase. Consequently, these components are employed for comparison to assess the accuracy of the model proposed in this study. Figure 6 compares the molar production rate of each component in oil phase predicted by EDFM and CGDM for the model with intersecting fractures.
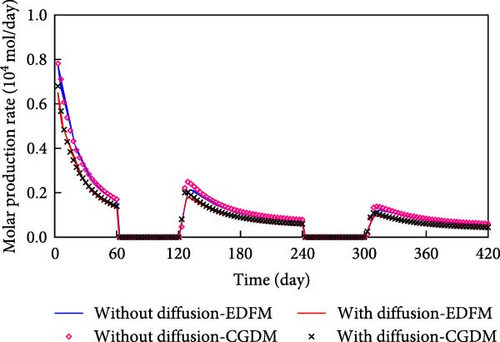
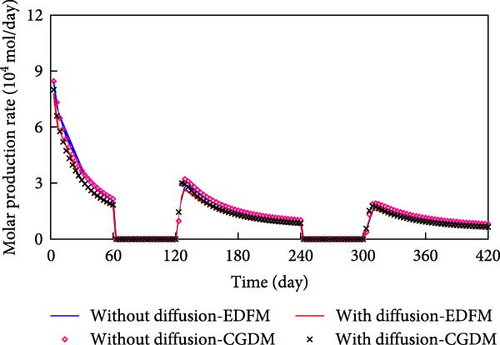
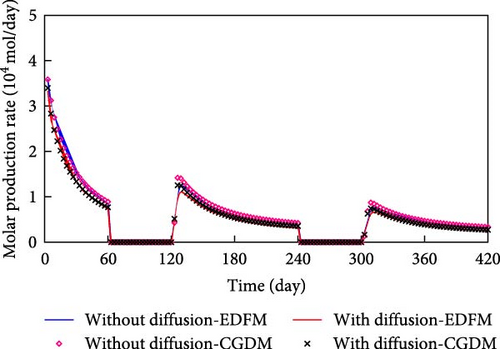
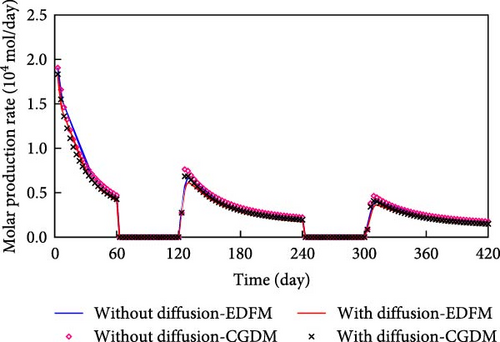
From Figure 6, the molar production rates of the main pseudo-components in oil phase are significantly impacted by molecular diffusion except for C25–80 which is marginally influenced (based on the same line type comparison). More importantly, the results simulated by EDFM are generally close to that predicted by CGDM for the molecular diffusion-added model (based on a comparison of lines and symbols).
The components N2/CH4, CO2, C2–5, and C6–13 are present at higher concentrations in the gas phase. Consequently, these components are utilized for comparison to evaluate the accuracy of the model proposed in this study. Figure 7 compares the molar production rate of the main pseudo-components in the gas phase predicted by EDFM and CGDM.
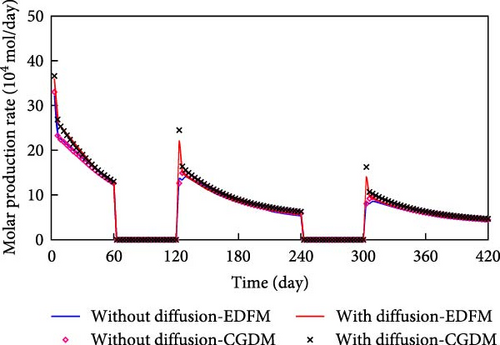
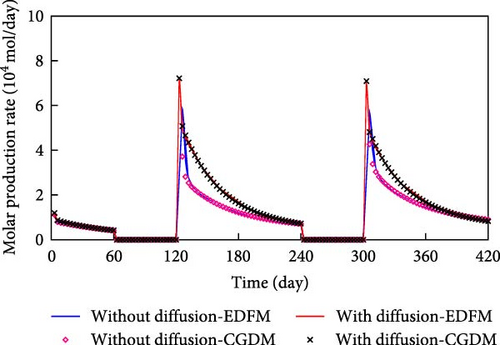
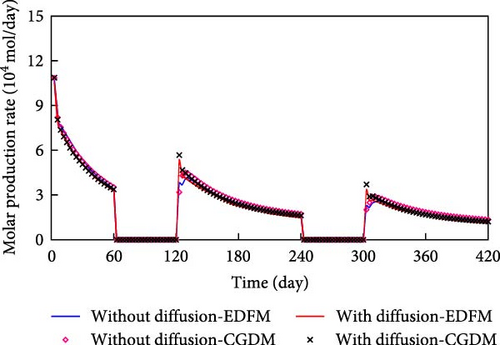
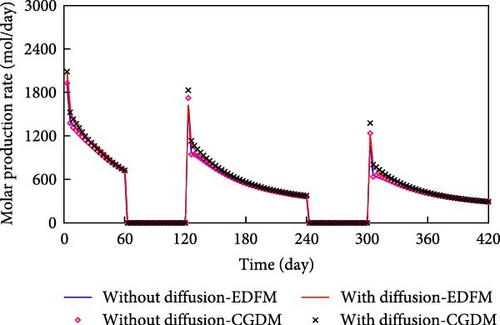
From Figure 7, molecular diffusion has an effect on the molar production of the main components in the gas phase, particularly injected CO2. And molecular diffusion makes the molar production rate of the main components in the gas phase increase (based on the same line type comparison). Furthermore, the molar production rate of the main pseudo-components in the gas phase simulated by EDFM lines up well with that calculated by CGDM (based on a comparison of lines and symbols). Subtle differences are observed in the fitting during the early production stage, which can be attributed to the differing mass transfer calculation methods between the fractures and the matrix in the two models.
To further validate the accuracy of the model proposed in this study, the distribution of reservoir pressure and oil saturation for both models were compared. The distribution at the end of the first huff “n” puff cycle (240 days) were selected. This time point provides a clearer comparison, emphasizing the accuracy of the proposed model. Figures 8 and 9 present comparisons of the reservoir pressure and oil saturation distribution between EDFM and CGDM with molecular diffusion at 240 days.
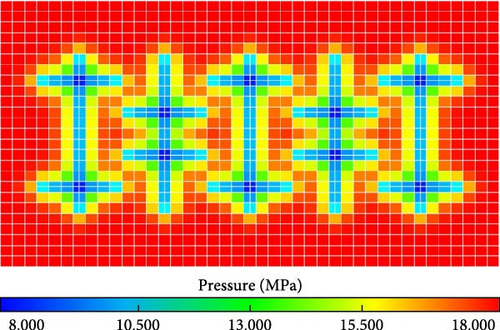
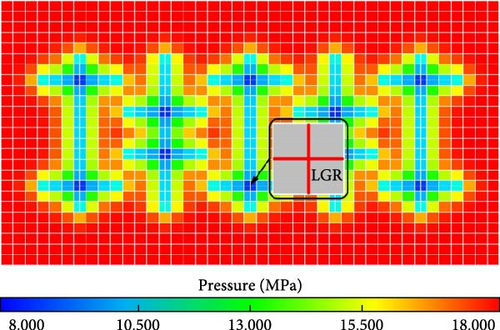
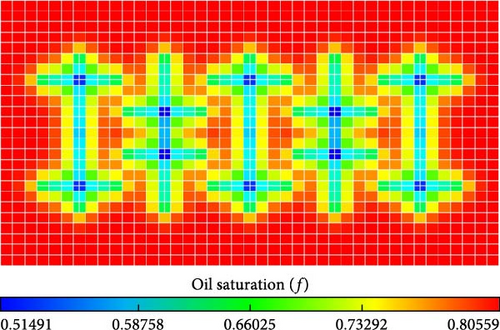
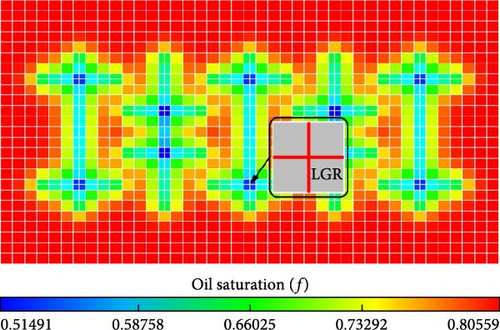
From Figures 8 and 9, both the reservoir pressure and oil saturation distribution predicted by EDFM match up perfectly with those simulated by CGDM for molecular diffusion-added model with intersecting fractures. Therefore, in light of the aforementioned comparisons, it is evident that the numerical model proposed in this paper accurately simulates diffusive transfer.
The above analysis illustrates that all kinds of diffusion transfer are precisely simulated by EDFM proposed in this paper, including diffusion between matrix cells, diffusion between matrix cells and fractures, diffusion between fracture segments inside an individual fracture, and diffusion between intersecting fracture segments. Therefore, it can be included that the novel compositional EDFM proposed in this paper is capable of effectively and accurately dealing with the situation of the mass transfer by diffusion in shale oil reservoirs with CFNs.
4. Results and Discussion
Model validation demonstrates the reliability of the novel compositional EDFM with diffusion proposed in this paper. In this section, in order to proper understand the effects of three key parameters on EOR, numerous cases were conducted by using compositional numerical model proposed in this paper.
Figure 10 show the schematic of the multistage fractured horizontal well in shale oil reservoir model with different fracture densities.
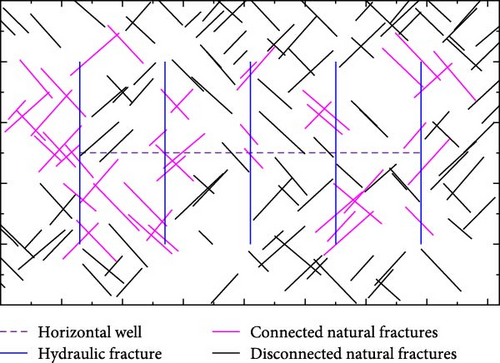
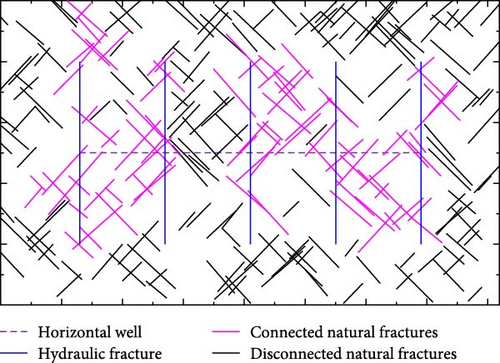
From Figure 10, there are five hydraulic fractures and perpendicular to the horizontal wellbore in both models. Meanwhile, it is assumed that there are 150 and 250 natural fractures, respectively, in each model and that they are randomly distributed. The length of natural fractures is also random, ranging from 4.92 to 54.52 m and 2.54–54.98 m, respectively. There are two kinds of natural fractures. One is the natural fractures directly connected with hydraulic fractures or indirectly connected with hydraulic fractures through natural fractures, namely, connected natural fractures. Other natural fractures are named disconnected natural fractures. Table 3 lists the detailed physical properties of X shale reservoir of Daqing in China.
| Parameters | Value | Parameters | Value |
|---|---|---|---|
| Matrix–cell size | 10 m × 10m × 1 m | Initial reservoir pressure | 17.600 MPa |
| Matrix–cell dimension | 41 × 25 × 1 | Initial reservoir temperature | 387.450 K |
| Matrix permeability | 5.000 × 10⁻⁴ mD | Initial water saturation | 0.050 |
| Matrix porosity | 0.065 | Rock compressibility | 1.000 × 10⁻⁶ MPa−1 |
| Hydraulic fracture permeability | 2.000 × 10³ mD | Natural fracture permeability | 5.000 × 10² mD |
| Hydraulic fracture porosity | 0.500 | Natural fracture porosity | 0.300 |
| Hydraulic fracture aperture | 0.050 m | Natural fracture aperture | 0.030 m |
Tables 4 and 5 list the fluid data, which is from X shale reservoir of Daqing in China. The injection of CO2 not only contributes to EOR but also plays a significant role in carbon storage [56–58]. In this section, CO2 huff “n” puff with four cycles is simulated. At the beginning, the shale oil reservoir is produced via a horizontal well with a constant flowing BHP of 8.5 MPa for 60 days. Then the well injects CO2 for 30 days at a fixed rate of 1000 SCm3/day. Subsequently, the well is shut down for 60 days, that is, the well enters soaking period. Finally, the well is returned to production at a constant BHP (8.5 MPa) for 120 days. In next cycle, the well schedule will repeat. In the following sections, the well works with this schedule.
| Parameter | CO2 | N2 | C1 | C2–4 | C5–10 | C11–21 | C22–34 |
|---|---|---|---|---|---|---|---|
| Injected mole fractions | 1.000 | 0.000 | 0.000 | 0.000 | 0.000 | 0.000 | 0.000 |
| Initial mole fractions | 0.012 | 0.024 | 0.124 | 0.287 | 0.216 | 0.259 | 0.079 |
| Tc (K) | 304.200 | 126.200 | 190.600 | 361.857 | 535.013 | 640.410 | 963.472 |
| Pc (atm) | 72.800 | 33.500 | 45.400 | 42.602 | 29.679 | 8.141 | 9.018 |
| Mole weight (Kg/mole) | 44.010 | 28.013 | 16.043 | 42.694 | 100.941 | 211.301 | 356.856 |
| w | 0.225 | 0.040 | 0.008 | 0.140 | 0.330 | 0.655 | 1.006 |
| Vc (×10−3 m3/mol) | 0.094 | 0.090 | 0.099 | 0.196 | 0.399 | 0.792 | 1.282 |
| T (K) | 393.140 | ||||||
| Parameter | CO2 | N2 | C1 | C2–4 | C5–10 | C11–21 | C22–34 |
|---|---|---|---|---|---|---|---|
| CO2 | — | — | — | — | — | — | — |
| N2 | 0.02 | — | — | — | — | — | — |
| C1 | 0.103 | 0.031 | — | — | — | — | — |
| C2–4 | 0.131768 | 0.073805 | — | — | — | — | — |
| C5–10 | 0.143919 | 0.113919 | — | — | — | — | — |
| C11–21 | 0.15 | 0.12 | — | — | — | — | — |
| C22–34 | 0.15 | 0.12 | — | — | — | — | — |
4.1. Effects of Contact Area
In practice, the quantity and distribution of hydraulic and natural fractures are uncertain, which are difficult to characterize accurately. As a result, two models are constructed, as shown in Figure 10. There are five hydraulic fractures with a half-length of 75 m and perpendicular to the horizontal wellbore in both models. Meanwhile, it is assumed that the natural fractures, respectively, in each model are randomly distributed.
From Figure 10, more natural fractures are connected to hydraulic fractures in the model with 250 natural fractures comparing with the model with 150 natural fractures. The area of contact area between matrix and held connected natural fractures is calculated as 1.4867 × 10⁴ and 3.2636 × 10⁴ m2. In particular, between hydraulic fractures, there are more connected natural fractures in the model with larger contact areas.
Figure 11 presents the effects of contact area and molecular diffusion on oil production rate and cumulative oil production for the model with and without molecular diffusion, respectively.
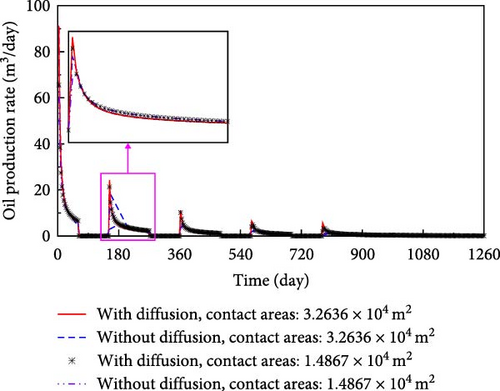
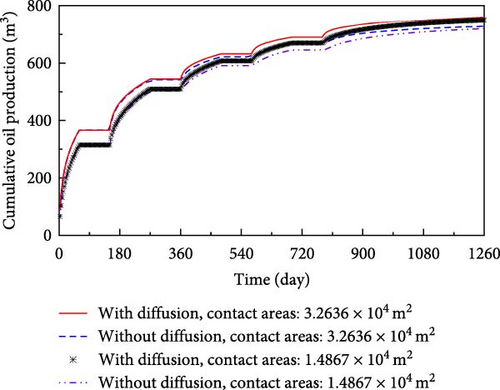
From Figure 11, significant differences are observed between the model with contact area of 1.4867 × 10⁴ and 3.2636 × 10⁴ m2, respectively, regardless of whether molecular diffusion is taken into account. When molecular diffusion is considered, the model with larger contact area (3.2636 × 10⁴ m2) has a higher oil production comparing with smaller contact area (1.4867 × 10⁴ m2). Similarly, the model with larger contact area also produces more oil than that with the smaller contact area for ignoring molecular diffusion. Meanwhile, there is a considerable difference in oil production between the model with and without molecular diffusion, in which the contact area is same. The oil production of the model considering molecular diffusion is greater than that of the model without molecular diffusion.
The global CO2 molar fraction is defined as the ratio of the CO2 mole quantity to the total mole quantity of all components. Figure 12 compares the distribution of global CO2 molar fraction in the matrix between the models with different contact areas. Meanwhile, as shown in Figure 12, the effect of molecular diffusion on the global CO2 molar fraction distribution in the matrix is also displayed.
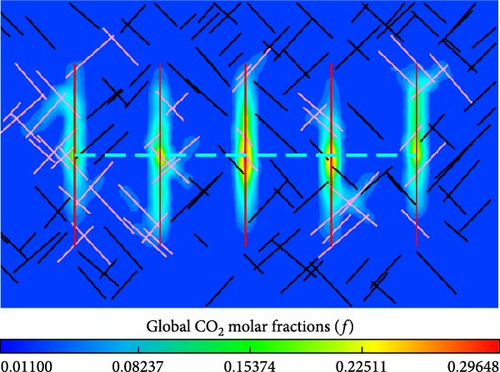
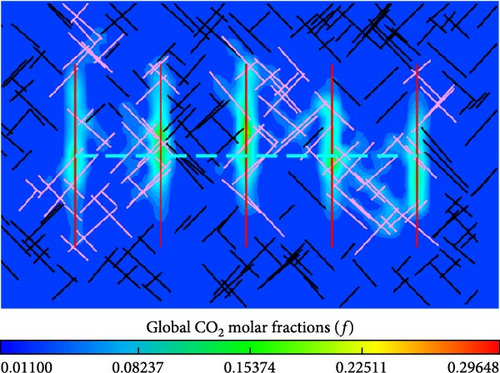
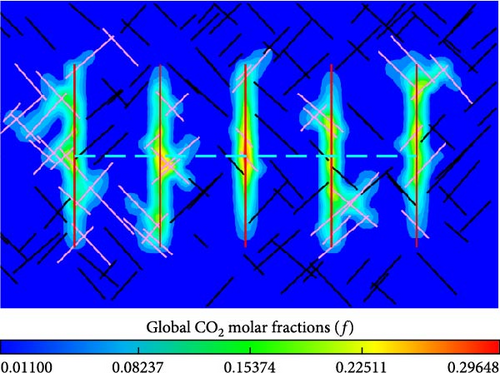
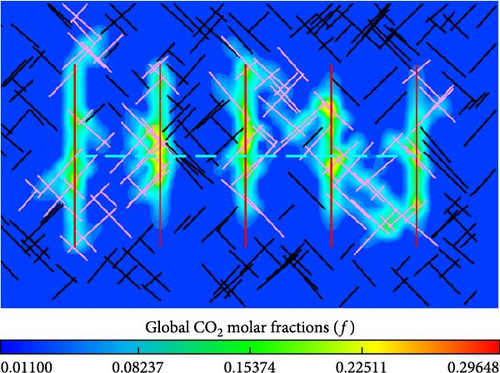
From Figure 12a,b, more CO2 is transferred into matrix for the model with a larger contact area. Due to more connected natural fractures in the model with larger contact areas, in particular, mass transfer of CO2 is more pronounced between hydraulic fractures. From Figure 12c,d, similarly, larger contact area benefits CO2 mass transfer in the models with considering molecular diffusion. Especially between hydraulic fractures, CO2 transferred into matrix increases because of more connected natural fractures for the model with 250 natural fractures in comparison to that with 150 natural fractures.
From Figure 12a,c, the global CO2 molar fraction and the injected CO2 spread range is greater in the matrix near the hydraulic fractures and connected natural fractures. The reason is that molecular diffusion benefits mass transfer of injected CO2 from fractures into matrix. From Figure 12b,d, similarly, there is a corresponding distinction in the global CO2 molar fraction and the injected CO2 spread range surrounding the hydraulic fractures and connected natural fractures.
The results illustrate that CFNs with high permeability are created because of connected natural fractures in addition to extend the contact area in shale oil reservoirs. In the injection and soaking stage, the connected natural fractures extend contact area of the injected fluid flowing into matrix. Based on that, the convection mass transfer is enhanced, which means that more fluid is injected into shale matrix. In addition, diffusive mass transfer is also enhanced because of connected natural fractures, that is, more injected fluid diffuse into shale matrix through the extended contact area. The sweeping volume of the injected fluid is expanded due to improvements in convective and diffusive mass transfer. The connected natural fractures also increase the controlled reserves of horizontal well, which are benefit to EOR in the production stage.
4.2. Effects of Diffusion Coefficients
In order to better understand the effects of diffusion coefficients on the oil production, the diffusion coefficient in oil phase of injected component, CO2, is set 0.01, and 0.001 cm2/s for the model with 250 natural fractures, as shown in Figure 10b. Meanwhile, a model without considering molecular diffusion is also constructed as a basic case.
Figure 13 shows the effects of CO2 diffusion coefficient on oil production, while keeping other input data same.
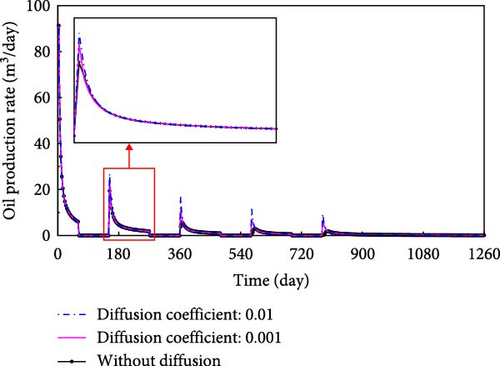
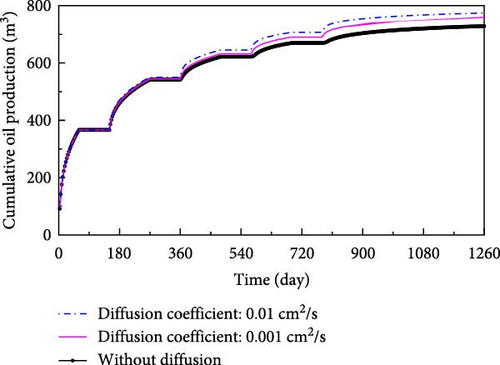
From Figure 13, oil production for the reservoir model with greater diffusion coefficient is higher than that without molecular diffusion in each cycle. And the difference between them grows more pronounced with the increase of CO2 diffusion coefficient. The cumulative oil production is increased by 30.62 and 45.81 m3 in diffusion coefficient of 0.001 and 0.01 cm2/s when compared to the model without diffusion, respectively.
Figure 14 compares the global CO2 mole fraction distribution in the matrix between the reservoir model with and without molecular diffusion.
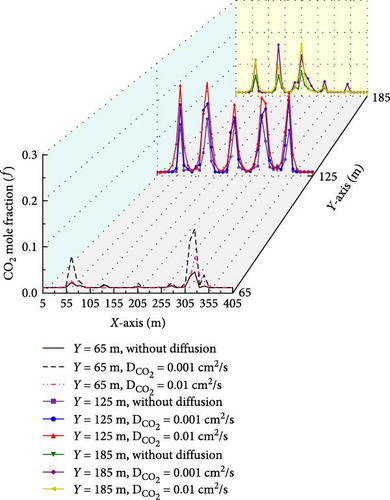
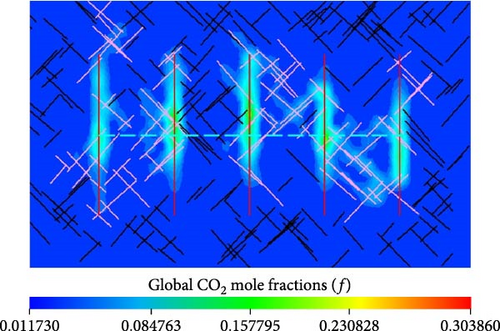
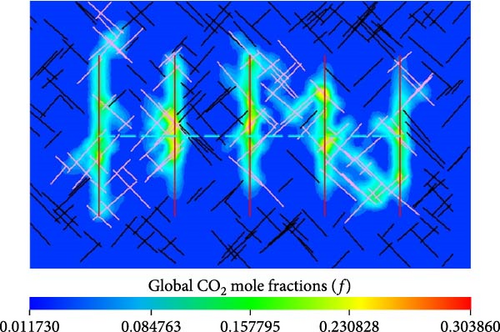
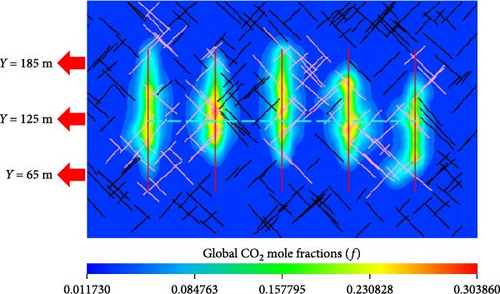
From Figure 14b–d, the mole fraction and swept volume of injected CO2 in the matrix with molecular diffusion are significantly higher than that without molecular diffusion. Moreover, the greater the CO2 diffusion coefficient is, the more CO2 are injected into matrix. From Figure 14a, the CO2 mole fraction is larger when molecular diffusion is taken into account than that without molecular diffusion in the same matrix cell. Moreover, the mole fractions of CO2 in the matrix cells, where the hydraulic fractures near the perforations are located, increase with the rise of CO2 diffusion coefficient. For the matrix cells holding the hydraulic fracture away from the perforations; however, the CO2 mole fraction decreases with increasing CO2 diffusion coefficient. The reason is that more CO2 transfer into the matrix cells near the perforations because of higher CO2 diffusion coefficient.
The results in this section demonstrate that molecular diffusion plays an important role in modeling gas injection for EOR in shale oil reservoirs. The injected gas is primarily concentrated around hydraulic fractures and connected natural fractures because of the lower permeability of shale matrix without molecular diffusion. However, molecular diffusion makes more injected gas diffuse into shale matrix, which results in a higher oil recovery. Therefore, in order to more precisely simulate gas injection for EOR, molecular diffusion should be taken into account in the numerical simulation model.
4.3. Effects of Injection Rate
For researching the effects of injection rate on the oil production, three models, in which the well injection rate is 1000, 1500, and 2000 m3/day, respectively, are designed. Figure 15 presents the effects of injection rate and molecular diffusion on oil production, while keeping the other input data same.
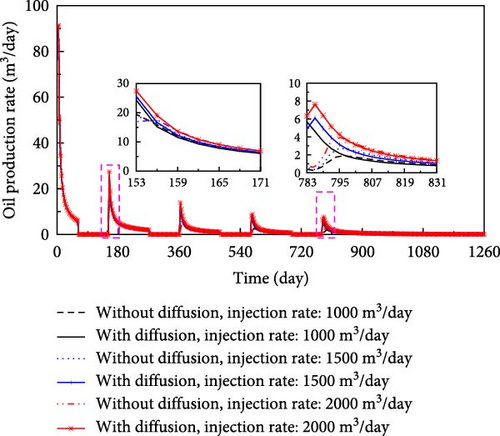
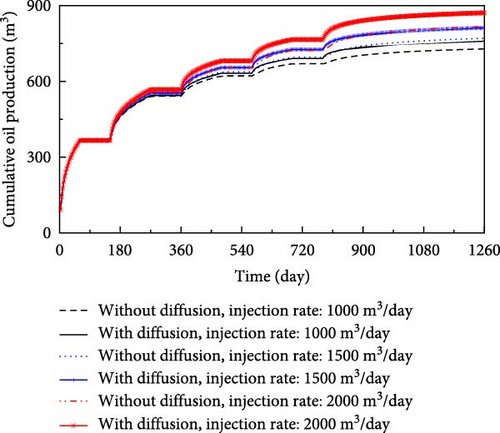
From Figure 15, oil production increases with an increase in the injection rate in both models with and without molecular diffusion. In addition, the incremental oil production caused by molecular diffusion rises with an increase in the injection rate and the number of cycle.
Figure 16 shows the distribution of global CO2 molar fraction in the matrix between the models with various injection rates. Meanwhile, as shown in Figure 16, the effects of molecular diffusion on the global CO2 molar fraction distribution in the matrix is also presented.
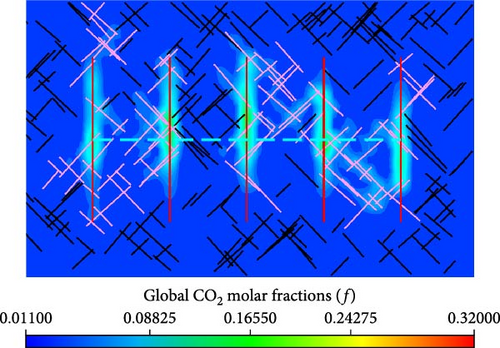
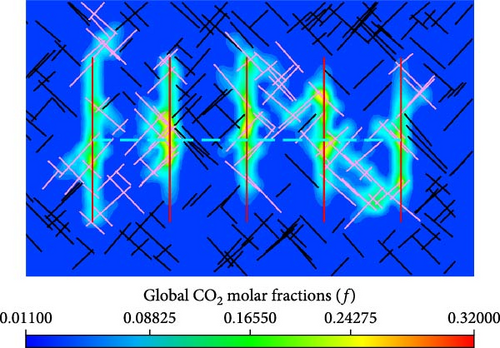
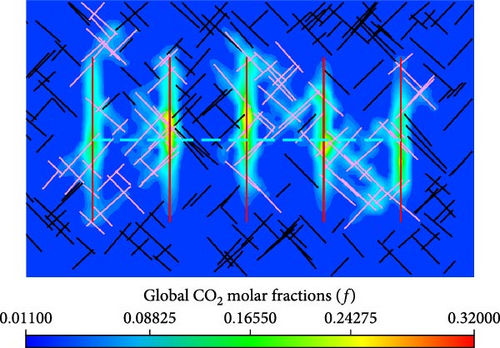
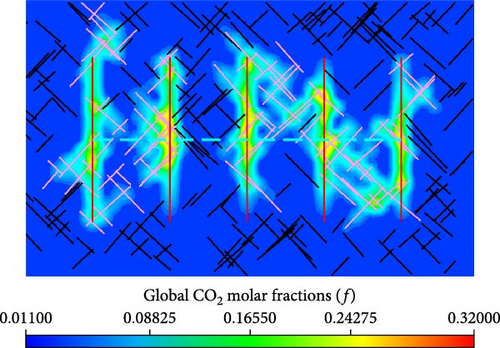
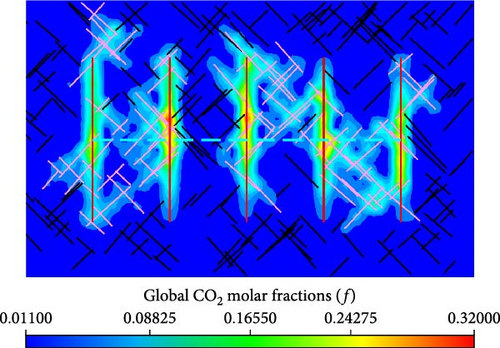
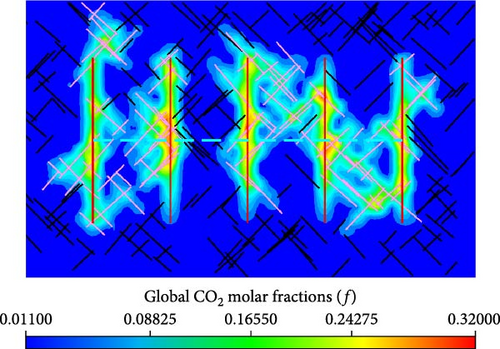
From Figure 16a,c,e, the global CO2 molar fraction in the matrix cells, which are near the hydraulic fractures and connected natural fractures, are greater for the well performance with higher injection rate. Meanwhile, there is a wider spread range of the injected CO2 for the model working with a higher injection rate. From Figure 16b,d,f, more injected CO2 is driven by pressure and concentration difference into matrix near hydraulic fractures and connected natural fractures.
The effects of molecular diffusion on the global CO2 molar fraction distribution in the matrix are also presented in Figure 16. When the injection rate is the same, the molar fraction and spread range of injected CO2 are higher in the model with molecular diffusion than that without molecular diffusion. Therefore, molecular diffusion benefits injected CO2 flowing from hydraulic fractures and connected natural fractures into matrix.
The results in this section illustrates that higher injection rate is conducive to the injected CO2 flowing into shale matrix. The higher injection rate makes a greater level of injection pressure difference, which results in more CO2 being driven from hydraulic fractures and connected natural fractures into matrix. Meanwhile, the high injection rate makes the CO2 concentration in the hydraulic fractures and connected natural fractures increase rapidly, while the CO2 concentration in shale matrix does not vary significantly because of low permeability. As a result, there are higher CO2 concentration differences between hydraulic fractures, connected natural fractures and matrix in the injection and soaking stage. Driven by the higher difference in CO2 concentration, more CO2 diffuses from hydraulic fractures and connected natural fractures into shale matrix. In other words, higher injection rate makes molecular diffusion more pronounced.
It is concluded that the convective and diffusive mass transfer are increased because of higher injection rate, resulting in sweeping volume of the injected fluid to be expanded.
5. Conclusions
- 1.
Based on EDFM, the numerical simulation method proposed in this paper has been demonstrated to accurately simulate molecular diffusion mechanism. And the method is able to describe diffusive mass transfer in shale oil reservoirs with CFNs.
- 2.
Molecular diffusion plays a significant role in development shale oil reservoirs with CFNs by huff “n” puff, especially in the injection and soaking stage. Consequently, future research on predicting oil recovery should integrate the effects of molecular diffusion.
- 3.
CFNs with high permeability in the shale oil reservoirs increases the diffusive contact area, resulting in diffusive mass transfer to be raised. Consequently, CFNs make molecular diffusion more pronounced.
- 4.
Diffusive mass transfer is enhanced by higher injected fluid concentration difference, which is caused by higher injection rate. Thus, it can be concluded that higher injection rate benefits injected components transferring into matrix from hydraulic fractures and connected natural fractures because of molecular diffusion.
- 5.
During field implementation, a moderate increase in the injection rate and an extended soaking stage are benefit to EOR in shale oil reservoirs.
Nomenclature
-
- A:
-
- area of intersecting face between two finite control volume cells, (m2)
-
- Annc:
-
- area of the NNC, (m2)
-
- c:
-
- vector from the centroid of the two finite control volume cells to that of the intersecting face
-
- C:
-
- total molar concentration, (mol/m3)
-
- dnnc:
-
- distance of the NNC
-
- dfnnc:
-
- average of normal distances from the center of the fracture sub-segments to the intersection line, (m)
-
- dsub:
-
- normal distances from the center of the fracture sub-segments to the intersection line, (m)
-
- Dli:
-
- dispersivity coefficient, (cm2/s)
-
- Dli:
-
- diffusion coefficient, (cm2/s)
-
- J:
-
- diffusion flux, (kg/(m2·s))
-
- krl:
-
- relative permeability of phase l
-
- K:
-
- formation permeability tensor, (mD)
-
- Knnc:
-
- permeability of the NNC, (mD)
-
- Lf:
-
- length of the intersection line bounded in a matrix cell, (m)
-
- M:
-
- molecular weight, (kg/mol)
-
- n:
-
- Unit normal of the contact surface
-
- Nc:
-
- total number of components
-
- Ncells:
-
- number of cells that connect with one of the finite control volume cell
-
- Nnnc:
-
- total number of NNCs
-
- Np:
-
- total number of phases
-
- q:
-
- source-sink term per unite volume and time, (kg/(m3·s))
-
- qnnc:
-
- mass transfer exchanged via NNC per unite volume and time, (kg/(m3·s))
-
- Qnnc:
-
- mass transfer exchanged via NNC per time, (kg/s)
-
- R:
-
- residual
-
- S:
-
- saturation
-
- t:
-
- prior time steps, (s)
-
- △t:
-
- time step, (s)
-
- TIJConvn:
-
- face convective transmissibility, (m3)
-
- TIJM-Diff:
-
- face diffusible transmissibility, (m)
-
- TI,JConvn, TJ,IConvn:
-
- half face convective transmissibility, (m3)
-
- TI,JM-Diff, TJ,IM-Diff:
-
- half face diffusible transmissibility, (m)
-
- TfConvn:
-
- half face convective transmissibility, (m3)
-
- TffConvn:
-
- face convective transmissibility, (m3)
-
- v:
-
- Darcy’s flow velocity, (m3/s)
-
- w:
-
- mass fraction
-
- Wf:
-
- width of each fracture, (m)
-
- X:
-
- mole fraction
-
- Φ:
-
- porosity
-
- μ:
-
- viscosity, (cp)
-
- ρ:
-
- density, (kg/m3)
-
- τ:
-
- tortuosity
-
- ΩI, ΩJ:
-
- finite control volume cell
-
- Γ:
-
- face shared by the two cells
-
- λConvn:
-
- convective mobility, (kg/(m3·cp))
-
- λM-Diff:
-
- molecular diffusible mobility, (kg/(m·s))
Subscripts and Superscripts
-
- f:
-
- fracture system
-
- i, j:
-
- component
-
- I, J:
-
- discrete cell
-
- l:
-
- phase, including oil and gas
-
- m:
-
- matrix system
-
- mf:
-
- parameter between matrix and fracture system
-
- w:
-
- well
-
- aqu:
-
- water phase.
Conflicts of Interest
The authors declare no conflicts of interest.
Funding
The authors would like to acknowledge the financial support of the National Natural Science Foundation of China (Grant U22B2075) and the Core Technology Project of China National Petroleum Corporation (CNPC) (Grant 2023ZG18).
Open Research
Data Availability Statement
The data that support the findings of this study are available from the corresponding author upon reasonable request.


