Effects of Dust Accumulation on the Performance of the Photovoltaic Panels on Buildings: A Case Study
Abstract
This study examines the effects of dust accumulation on the performance of photovoltaic (PV) panels in an urban environment through 1 month of field experiments. Three PV panels—clean (P1), lightly soiled (P2), and heavily soiled (P3)—were installed on a rooftop test bed in two configurations: horizontal and latitude-tilted (45° North), using black tar paper and brown cellulose fiberboard as roofing materials. On the reference day, the panels showed minimal performance differences, with discrepancies of 0.37% in maximum power (Pmax) and 0.43% in short-circuit current (Isc). However, dust accumulation led to significant power losses in P3, averaging 23.4% in the horizontal position and 15% when tilted. P2 showed minor losses (1%–3%) throughout. Thermal monitoring revealed that dust raised the front surface temperatures of the soiled panels, while the clean panel exhibited the highest back surface temperatures. The greatest temperature differences occurred in the tilted configuration, with a maximum of 6.03 K on the front surface. Roofing material also influenced thermal behavior, with the black tar paper absorbing more heat than the cellulose fiberboard. The results highlight the importance of regular panel cleaning and optimal tilt angles to minimize dust-related performance losses, providing insights for improving the efficiency of PV systems in built environments.
1. Introduction
Today’s communities endeavor to become economically resilient and environmentally aware, raising a slogan of sustainability, which led the countries to agree upon the United Nations 17 Sustainability Development Goals (SDGs), urging the global adoption of special measures in all sectors [1, 2]. The macro internal migration, as estimated by Selod and Shilpi [3], is around 1 billion people, including the rural–urban migration, while Yildiz et al. [4] presented in their work some figures indicating that around 5 million people migrate monthly from rural to urban areas in the developing world. This high demographic dynamism exceeds urban planning, but supports prepared suburbanization and the transition towards a more sustainable futuristic built environment with a low carbon footprint, ensuring resilience against climate change consequences that would otherwise be catastrophic to humankind and Mother Earth.
The built environment refers to the human-made surroundings necessary for daily activities, incorporating houses, suburbs, cities, and their accompanying infrastructure of water, energy, transport networks, and others [5]. These civilized population centers continuously exhaust natural resources, consuming 75% of worldwide primary energy and producing greenhouse gases (GHGs) that account for 50%–60% of global emissions [6]. Within the limits of the earlier statistics, the building functions consume 30% of the global final energy [7] and 40% of the global overall energy [8]. In Europe, for instance, the built sector consumes around 40% of the energy production [9], while the sectoral global energy use increased by 1% in 2022 [7].
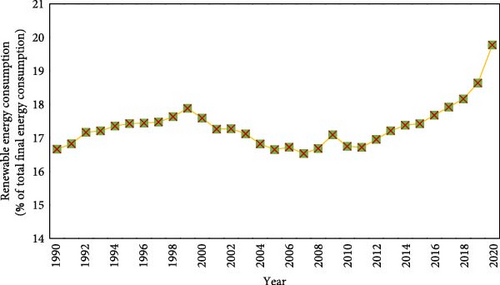
The international building investments are expected to grow in the next 40 years, adding 230 billion square meters of new construction [10], as this industry is vital for economic development, weighing 10% of the European gross domestic product (GDP) [11]. Energy-wise, building operations are responsible for 26% of global energy-related GHG emissions [7], but at the same time, account only for 7% of the total metropolitan emissions, not forgetting to mention that the growth in GHG emissions from electricity and heat generation sector is declining because of the more substantial progress in renewables as an alternative to coal [12]. It has been axiomatic by now to say that renewable energies are pivotal for emissions reduction because they have the potential to actualize zero-energy buildings [13], and their consumption is consistently developing, as illustrated by the chart in Figure 1, generated from the data provided by the World Bank [14]. In 2022, the worldwide renewables installed capacity was 3372 GW, as reported by the International Renewable Energy Agency (IRENA) [15].
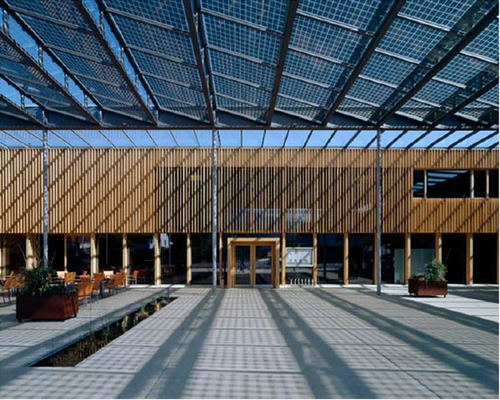
Among the trendy green power sources, solar energy is highly dependable in supporting sustainability [16]. A pillar of solar power utilization is the photovoltaic (PV) technology, in which the single unit, that is, the cell, directly converts sunlight into electricity, employing some well-developed semiconductor materials dominated by silicon-based ones [17, 18]. Nowadays, electricity generation by PV systems has become cost-competitive in many countries [19]. In 2019, the worldwide installed PV capacity reached 625 GW, accounting for 2.8% of the total electricity generation [20]. According to the International Energy Agency (IEA), solar PV will surpass coal by 2027, becoming the largest power capacity in the world [15] and the only renewable energy technology on track to net zero emissions (NZEs) by 2050 [21]. Buildings customization with PV panels has the formations of building-integrated PV (BIPV), in which the PV system is inherent in the architectural blueprints of the construction, as shown in Figure 2 [22], and building-applied PV (BAPV), in which the PV system is an auxiliary structure retrofitted to the building, as illustrated in the same figure [23]. BIPV and BAPV have many pros, including optimal use of rooftops and facades in urban environments, proximity of generation to the end user, and the ease of connecting to and supporting the utility grid [22, 23]. However, shading caused by nearby buildings, snow, and dust is the challenge these arrangements constantly confront [24].

By diverting the attention to dust as an effective PV power degrader, this powder can be sourced from different natural and artificial materials such as ash, cement, microfibers, pollens, soil, and soot, increasing the probability of being found in modern daily life, in particular on surfaces of BIPV and BAPV, transported by human activities, wind, vehicle movement, and many other ways [25, 26]. Across the United States, around 43 million tons of dust are annually suspended in the air [26], while Algarni and Nutter [27] estimated the dust deposition amounts to be between 1.3 and 73.8 g/m2/month for different hot-dry major cities in North Africa and the Middle East. Doronzo et al. [28] simulated dust storm scenarios on a suburban building assumed to be located in the Arab peninsula region using computational fluid dynamics (CFD) modeling to conclude that significant amounts of dust will accumulate in that construction, and the storm will pass through the suburbs, reaching the downtown for big cities like Dubai or Riyadh. Considering dust properties, Farkas and Török [29] relied on physiochemical characterization to reveal the characteristics of dust collected from Budapest’s city center facades. The researchers used optical microscopy, laser diffraction, and X-ray diffraction (XRD) methods to find that the dust composition was overpopulated by quartz, dolomite, and calcite. Also, there were traces of fly ash and soot in the collected samples. About the particle size, they found that particles larger than 200 µm follow a bimodal distribution [29].
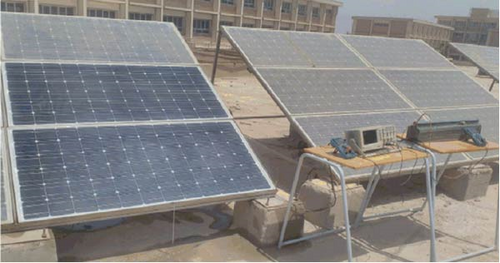
Many studies used experimental and numerical approaches to investigate the effect of dust on the PV systems mounted in buildings. Elnozahy, Abd-Elbary, and Abo-Elyousr [30] experimentally examined the impact of natural dust accumulation on PV panels installed on a flat roof in Egypt, as shown in Figure 3, to assess manual cleaning and self-cleaning coating effectiveness in restoring PV performance. The researchers reported a 35% reduction in the single panel power production over 5 months, having only 6% efficiency left, which increased to 9% and 11% for the manually cleaned and coated panels, respectively [30]. Akter et al. [31] studied the dust deposition effect on PV modules fixed on the rooftop of a seven-story building in Bangladesh. The investigations were conducted for 4 months during the dry season and concluded that the monthly reduction in short-circuit current (Isc) peaked at 22.31%, but improved to 5.52%, with a maximum daily loss in the harvested energy equaling 35% [31]. Jaszczur et al. [32] investigated the performance of 15° and 35° tilted PV panels mounted on the roof of a building in Kraków, Poland. The researchers noticed that any tilt moving toward the horizontal plane contributes to a more significant accumulation of PM2.5 and PM10 in the absence of wind and precipitation. At the same time, light showers only accelerate the cementation of the dust cover [32]. Xie et al. [33] conducted an experimental study based on a PV system with different inclinations and seasons installed in an urban area of Shenyang City, China, to evaluate the effect of ash accumulation. The team found that PV module power decreases as the ash density increases, different optimal tilt angles per season reduce the dust accumulation: 15° in summer and 60° in winter, and an 18.8% power loss due to dust presence at a 0° and 1.26% at 60°, resulting from 2 weeks of no cleaning winter conditions [33]. Sanz-Saiz et al. [34] tested the PV power reduction in Madrid based on 15 months of dust accumulation permeated by rainfall events. The promising use of BIPV and BAPV in Spain motivated these experimentations. Accordingly, a rooftop test bench with adjustable platforms was utilized to facilitate the inspection of glass coupons used as deposition surfaces at two different inclinations (i.e., 8° and 35°). The obtained transmittance losses (Tloss) indicated overall low soiling losses, proven by an annual average of Tloss equaled 1.49% at 8° and 1.04% at 35°, while peaking at 5.13% and 3.89%, respectively, in dry summer. Interestingly, the researchers showed that the optical losses from local dust soiling were more significant in the short wavelengths, stimulating the sensitivity of wide-bandgap PV technologies (e.g., amorphous silicon) towards the regional dusting process [34].
On the numerical investigation side, Lu, Lu, and Wang [35] utilized the SST k-ω turbulence and discrete particle (DPM) models and user-defined function (UDF) inlet profiles to simulate the wind flow fields and the dust deposition behavior on a PV system placed on the roof of an isolated building while facing the wind direction. The researchers’ most significant results were maximum and minimum deposition rates of 0.28% and 0.13% for 10 and 50 µm particle sizes. Chahardoli et al. [36] conducted numerical research on a virtual low-height building to assess the effect of different roof designs on the deposition amounts of 1–40 µm dust particles. The team found that the shed roof with a porch is the layout that collects the least dust, adapted from the simulation geometry. Lu and Zhang [37] relied on numerical analysis and CFD modeling to quantify the effect of dry dust deposition on roof-mounted PV panels, considering the wind flow, the neighboring buildings, and the roof inclination. The researchers found that the deposition density is proportional to the roof pitch, and for dust particle size of 1–50 µm, the associated panel efficiency reduction ranged from 0.27% to 5.06% for slope angles of 16.7°–56.3°. Chiteka et al. [38] employed the SST k-ω turbulence and the DPM models to investigate the dust–soiling behavior on five rows of PV arrays fixed on the rooftop of a multistory building. The research team obtained an average soiling rate of 15.77%, while the rates in the front rows are greater than the rear ones. Alternatively, Zhang et al. [39] investigated numerically, employing CFD modeling and the discrete element method (DEM), the effects of dust accumulation in a hypothetical PV system that powers the railways crossing the northwest desert of China, a public service area considered one of the pillars of the built environment. The research team found by simulation that clay particles of 10 µm had a deposition rate of 4.6%, while sand particles of 100 µm had 32% on a solar panel.
The compelling scientific findings presented above highlight the urgent need for further studies on dust deposition in built environments to mitigate its long-term detrimental effects on PV systems. This paper reports field experiments conducted on small-scale PV modules mounted on the roof of Colina Campus at Transilvania University of Brasov. The study aimed to investigate the electrical and thermal responses of panels positioned at horizontal and latitude-plane angles, simulating a typical BAPV system in Brasov. Two roof materials and colors were selected to closely resemble urban PV setups.
The primary objective is to provide experimental insights into the impact of dust deposition on BAPV systems in urban environments. By examining the electrical and thermal performance of PV panels under real-world conditions, this research highlights how panel orientation and roof materials influence system efficiency. The field experiments provide practical data relevant for urban applications and can inform effective dust management strategies. This work contributes to sustainability efforts by offering benchmark data that can enhance green building and energy-efficiency standards.
The novelty of this study lies in its real-world experimentation, focusing on conditions commonly encountered in urban settings. Moreover, while most existing case studies focus on hot climates, few have been conducted in this region. As such, the findings could play a crucial role in decision-making processes related to the adoption of solar energy as a renewable source for specific applications in the region.
Therefore, the rest of this article is organized as follows: Section 2 presents the experimental method, Section 3 delivers the test results and discusses them, and Section 4 concludes.
2. Experimental Method
2.1. Dust Sample
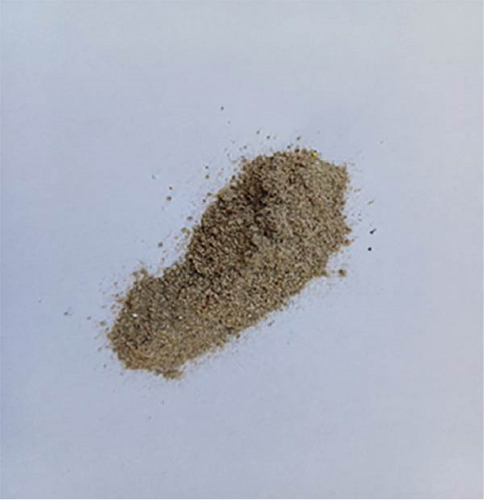
Natural dust, collected from the surroundings in Brasov, Romania, was manually applied with a sieve to the solar panels to assess the impact of dust deposition on their performance while deployed in a built environment. The dust was manually applied by scattering specific amounts over the surfaces of the examined panels. This process of artificial dust accumulation was maintained throughout the testing period. Figure 4 displays a sample of this dust [40]. The accumulation of dust on the PV surface can occur uniformly or nonuniformly under outdoor conditions, influenced by site characteristics, dust properties, wind speed, ambient temperature and humidity, tilt angle, and dimensions and material properties of the surface [41]. However, there is no scientific consensus supporting the uniformity or homogeneity of dispersion, as it occurs randomly in the natural world.
2.2. System Description
The field experiments took place on the rooftop of a building in the Colina campus of Transilvania University of Brasov, Romania. Readings were taken on selected days of clear sky conditions spanning an entire month between late September and late October 2023. The annual sum of global irradiation incidents on an optimally inclined surface in Brasov equals 1400 kWh/m2 [42, 43].
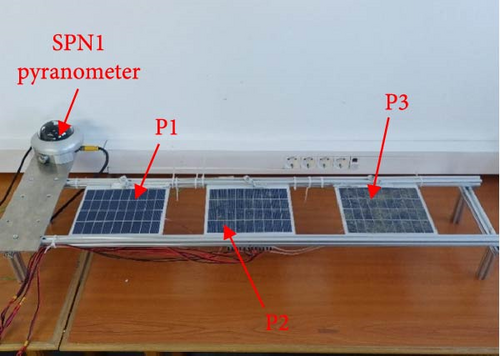
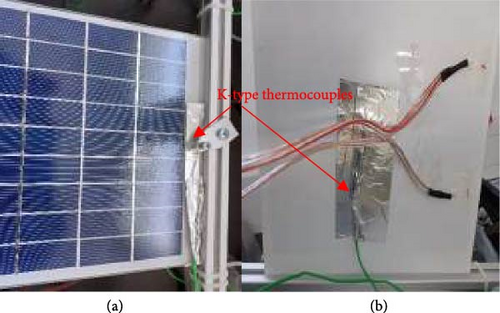
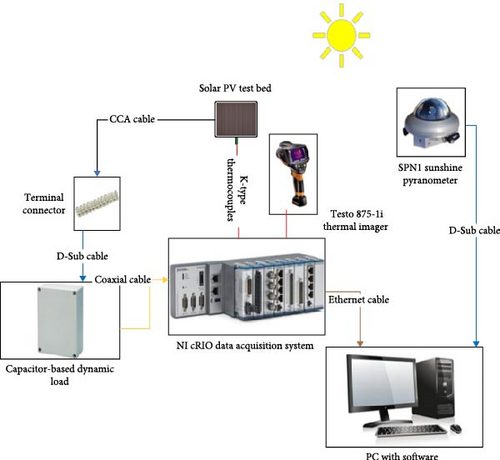
In this study, three 18-cell symmetric commercial polycrystalline PV modules with dimensions of 20 cm × 20 cm were mounted on a custom-made test bed. The test bed was equipped with a DELTA-T SPN1 Sunshine pyranometer with an accuracy of ±5% (or ±10 W/m2) [44], used to measure sunlight intensity. Additionally, K-type thermocouples and necessary wiring connected the panels to the data acquisition system, as demonstrated in Figure 5. Six thermocouples, with an accuracy of ±1.5°C [45], were attached to the back and front surfaces of the three panels, as illustrated in Figure 6.
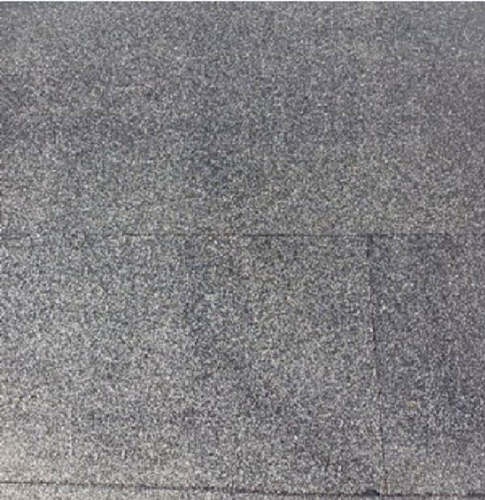
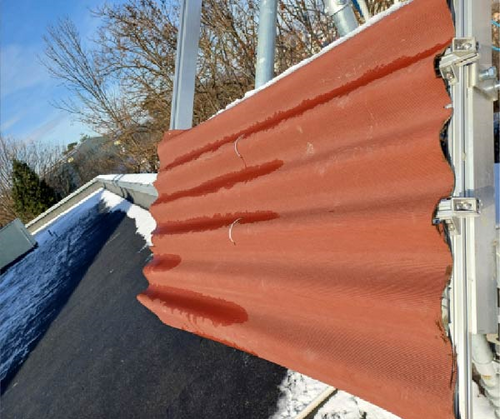
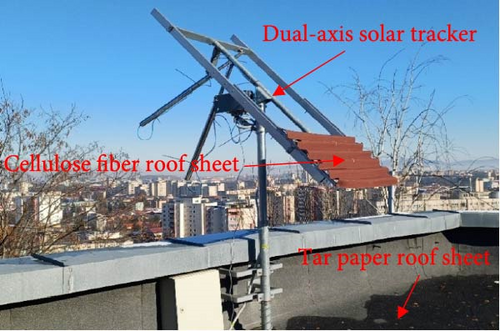
The complete test bed was positioned in two ways: horizontal, with a black tar paper sheet as the roof material beneath it, and latitude-tilt inclined, with cellulose fiberboard serving as the roof simulator. Figure 7 displays the two roof materials under study, while Figure 8 pictures the inclined arrangement of the dual-axis sun tracker upon which the PV test bed was fixed.
These two experimental settings represented commonly available PV systems installed in the vicinity, either inclined or horizontal, making them suitable to be considered as representatives of BAVP systems in the built environment. This facilitated the analysis of the effect of dust in such conditions.
On the data collection side, an acquisition and control system based on the National Instruments (NIs) cRIO 9074 8-slot embedded controller [46] and an electronic circuit based on capacitor technique were employed to record the I–V characteristics, as well as the back and front surface temperatures. Each set of readings took approximately 3.2 min, consisting of eight data points with a 24-s interval. Table 1 provides a list of the NI modules fixed in the controller chassis. For a comprehensive analysis of the modules’ accuracies, readers interested in further details can refer to [47].
| Module | Description |
|---|---|
| NI-cRIO-9074 | Embedded controller |
| NI-9227 | Current input module |
| NI-9215 | Voltage input module |
| NI-9211 | Temperature input modules |
| NI-9213 | |
| NI-9401 | Digital input/output (DIO) module |
Additionally, a capacitor-based dynamic load was connected to the controller to assist in obtaining the I–V data. The current and voltage sensors measured the parameters during the charging process of the capacitor directly connected to the PV modules [48]. Finally, a Testo 875-1i manual focus portable thermal imager with 19,200 temperature measuring points, thermal sensitivity of less than 50 mK, a measuring range from −30 to +350°C, and an accuracy of ±2°C [49] was used to measure the front surface temperature. Figure 9 illustrates an image diagram of the full experimental setup [40].
3. Results and Discussion
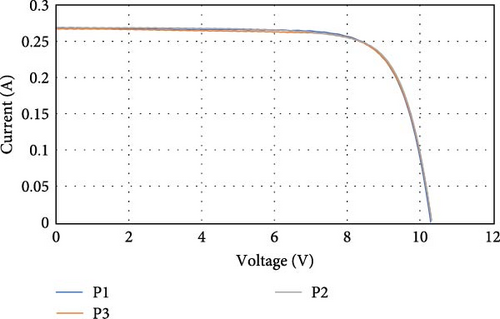
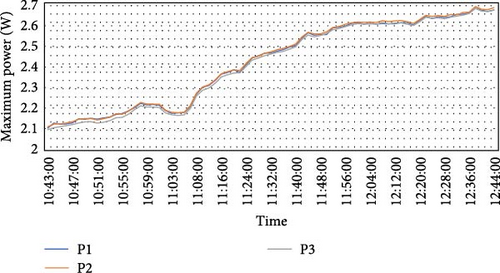
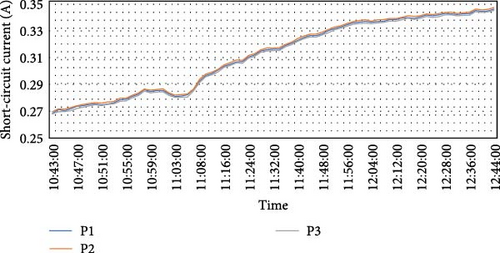
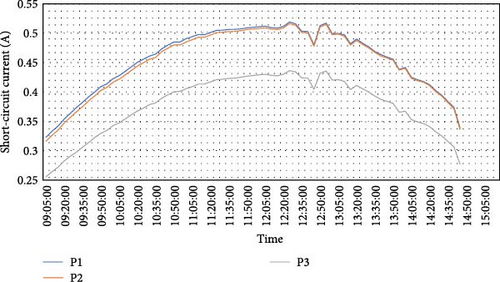
The experiments spanned 1 month, using September 26, 2023 as the reference day when all three solar panels were clean, and the test bed was in the horizontal position. The panels are named as follows: P1 is the clean panel, P2 is the less soiled panel, and P3 is the more soiled panel, as shown in Figure 5. This naming convention reflects the amount of dust deposited on each panel’s surface. Notably, P1 was periodically cleaned to maintain its initial state, while dust accumulation remained relatively constant on P3. However, it increased with each test on P2 before starting to decrease again as the experiments progressed and the latitude-tilted position experiments began. All the dust deposition mechanisms mentioned earlier were artificial, while natural dust deposition occurred daily, but in negligible amounts. Hypothetically, the electrical performance and thermal responses of the three PV modules on this day should be identical, as all the panels were in a clean state. This hypothesis was confirmed by the test results, which showed nearly identical I–V curves in Figure 10. Additionally, the time series curves for maximum power (Pmax) in Figure 11 exhibit high similarity, with an average interchangeable discrepancy of 0.37% in Pmax values between the panels. The global maximum and minimum values were 2.69 and 2.1 W, respectively. For the short-circuit current (Isc), Figure 12 presents three similar time series charts, indicating the cleanliness of the solar panels, as Isc is the I–V characteristic primarily associated with the dust–soiling effect [50]. In this case, an average interchangeable discrepancy of 0.43% was observed between the PV panels with global maximum and minimum values of 0.35 and 0.27 A, respectively.
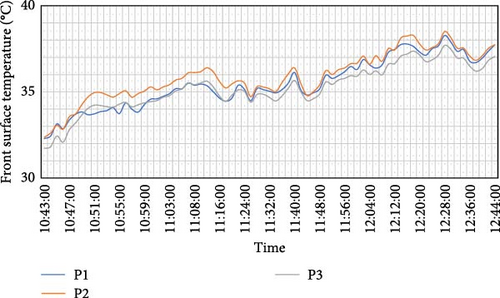
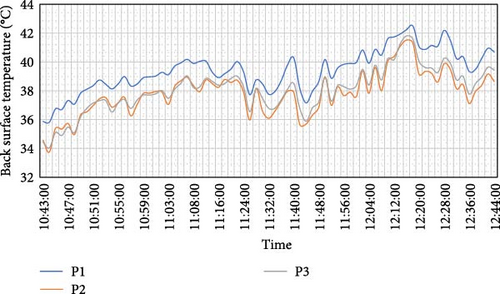
Concerning the thermal response in these initial conditions of the experimental work, Figure 13 illustrates the rate of change of the front surface temperature of the three panels through time series curves, while Figure 14 depicts the same rate and curves for the back surface temperature. In this context, the average interchangeable discrepancies were 1.35% and 2.76% between the panels for the front and back surface temperatures, respectively, with global maximum and minimum temperatures recorded at 42.5 and 31.7°C.
It can be quickly concluded from the observations based on the reference day data that the three commercial PV panels have similar electrical and thermal characteristics. Consequently, the subsequent experimental results representing the horizontal and latitude-tilted configurations are reasonably valid for comparing dust and no dust cases, quantifying the relevant effects, and drawing conclusions and recommendations.
3.1. Electrical Performance
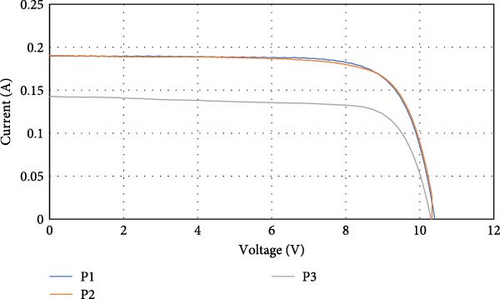
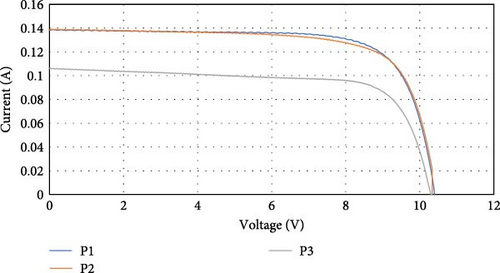
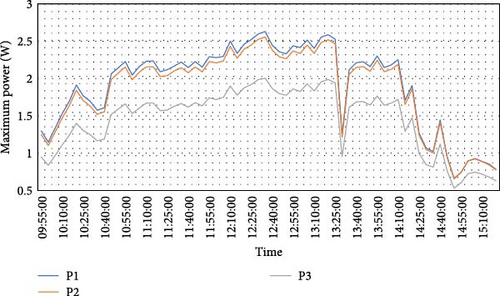
The I–V curves and characteristics of each panel resulting from the experiments are detailed in this subsection to elucidate the dust deposition effect on the three PV panels in the built environment. In Figures 15–17, which illustrate the I–V curves and the rate of change of Pmax and Isc for the horizontally positioned solar panel test bed with tar paper sheet as the rooftop flooring, respectively, observers can discern the impact of dust on the curves and characteristics. Minor effects are observable on P2, while significant effects are noted on P3. Throughout the testing progression, the dust amounts slightly increased on each experimental day, particularly in P2, establishing an intermediate situation between the clean and well-dusted conditions represented by P1 and P3, respectively. Accordingly, Figure 18 illustrates the I–V curves on a later day than the ones in the above figures, while Figures 19 and 20 depict the Pmax and Isc time series charts for another different day, respectively.
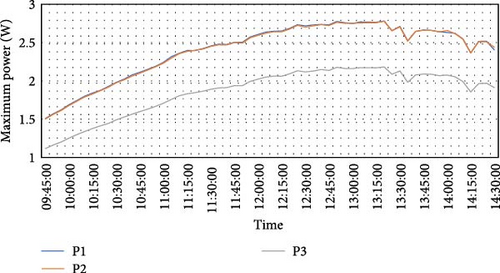
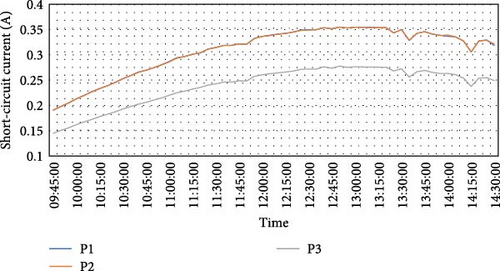
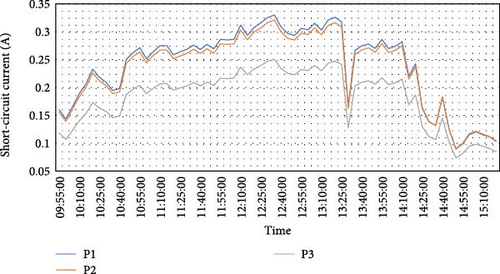
In the second round of outdoor testing, the PV test bed was fixed on a dual-axis solar tracker, as pictured in Figure 8, with a tilt angle equal to the city’s latitude (45° North). A wavy cellulose fiber sheet exactly represented the standard brownish roofing commonly found and used in houses in this Romanian city. In Figures 21 and 22, the impact of dust on Pmax and Isc during the day is evident, especially in P3. Furthermore, in the subsequent day’s test, the time series curves in Figures 23 and 24 reflected similar performances in the presence of dust.
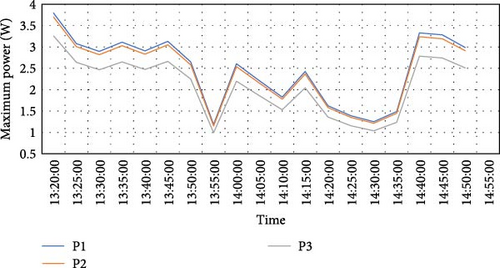
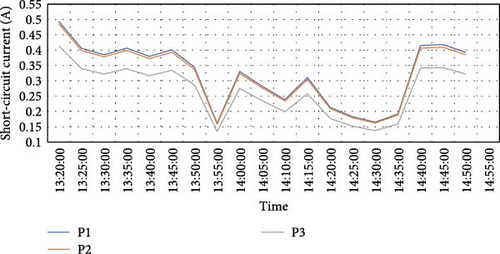
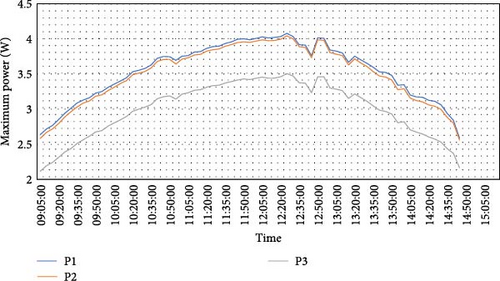
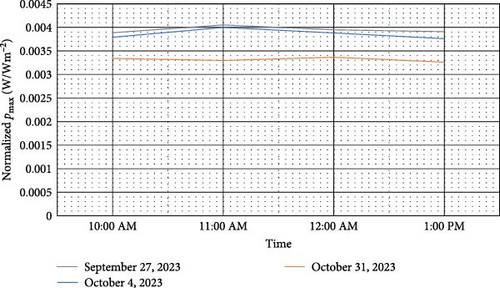
Summarizing the data from different days across the experimentation period, considering the two inclinations of the PV test bed and the two rooftop flooring materials associated with each tilt angle, Table 2 details the generated power by each panel on each experimental day and the dust-related percentage losses on the energy produced by the dust-soiled panels (P2 and P3) compared with the clean case (P1). In this table, as dust amounts were nearly fixed in P3, the well-dusted panel power losses for all studied inclinations remained almost constant, quantified at 23.4% on average in the horizontal position and 15% in the latitude-tilted position. Simultaneously, when observing the second panel, P2, and its performance compared with the clean situation, minor losses fluctuating between 1% and 2% are present due to small amounts of artificially deposited dust. At the same time, the gradual accumulation of dust on panel P2, as previously mentioned, is captured in Figure 25. The figure shows the normalized maximum power values in relation to solar irradiance at specific daytime hours over several experimental days. These values help illustrate the impact of dust on the panel’s performance. As the dust builds up incrementally each day, the resulting power losses, though small, are detectable and reflected in the curves. As a reminder, it must be noted that this comparison is made between the clean panel P1 and the soiled panels P2 and P3, with P1 serving as the reference. The performance is compared on a daily basis, not across different days, as the exposure time is not the same for the selected days.
| PV panel | P1 | P2 | P3 | P1 and P2 | P1 and P3 | ||
|---|---|---|---|---|---|---|---|
| Day | Plane | Exposure time (h) | Generated power (Wh) | Percentage loss (%) | |||
| September 27, 2023 | Horizontal | 4.83 | 674.65 | 672.91 | 521.87 | 0 | 23 |
| October 3, 2023 | 6.25 | 973.13 | 967.59 | 756.43 | 1 | 22 | |
| October 4, 2023 | 5.58 | 748.59 | 734.63 | 568.17 | 2 | 24 | |
| October 6, 2023 | 5.50 | 663.12 | 648.05 | 505.23 | 2 | 24 | |
| October 9, 2023 | 5.50 | 694.66 | 674.62 | 527.14 | 3 | 24 | |
| October 30, 2023 | Latitude tilt | 3.33 | 165.71 | 162.34 | 140.74 | 2 | 15 |
| October 31, 2023 | 6.25 | 1545.09 | 1535.40 | 1317.82 | 1 | 15 | |
To quantify the impact of the built environment (i.e., orientation, inclination, roof material, and color) on the power production of dust-polluted PV panels, the data from the respective table for October 3 and October 31 is analyzed, both having the same exposure time of 6.25 h. These cases reveal similar power losses when comparing P2 with P1, but a notable decrease in losses when comparing P3 with P1, especially when the test bed transitioned from the horizontal to the tilted position. Additionally, it was observed that all modules produce more power in the inclined position than the horizontal one, aligning with the fact that solar panels deliver optimal performance when tilted at an angle equal to the local latitude [51]. It is worth noting that other built environment factors require attention here, including elevation. The test bed was elevated from the ground in the tilted position, suggesting that gravitational forces might have contributed to reducing losses. Additionally, the floor sheet color might have played a role, where lighter colors can indicate more reflected light and less radiated heat and vice versa.
3.2. Thermal Performance
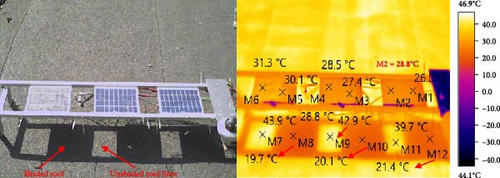
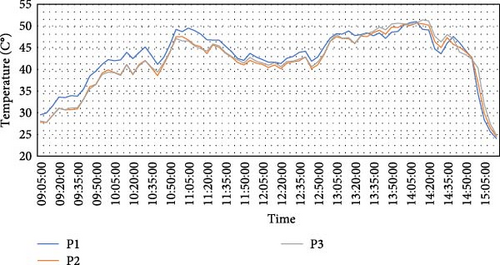
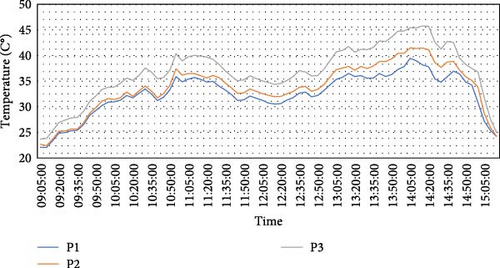
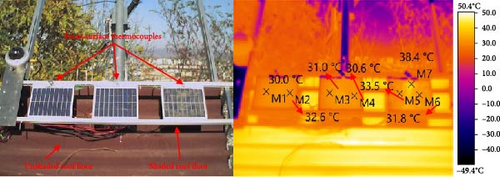
The thermal responses of the PV panels mounted in the test bed were monitored by sensing the front and back surface temperatures using K-type thermocouples, while thermal imaging was employed to consolidate the obtained temperature readings. As is customary in this research, the recorded values are presented as time series charts for different experimental days. The effect of dust on the PV panels in the horizontal position is evident in both back and front surface temperatures. In Figures 26 and 27, illustrating the back surface temperature change over time for two different days, the clean panel, P1, consistently had the highest temperature. This is expected, as the transmitted heat to the back surface of this panel is greater than the others with dust layers on their top, which absorb a portion of that heat energy. Conversely, the front surface temperatures, as shown in Figures 28 and 29, are higher for the contaminated modules than the clean ones, with P3 consistently having the highest temperature, followed by P2. Once again, it is reasonable, as the absorbed heat by the dust layer remains, heating the surroundings that embrace the front surfaces of the PV panels. This is confirmed by the thermal image presented in Figure 30, where each solar panel has two points (the “M” symbol refers to the point where the temperature was measured) representing its surface temperature.
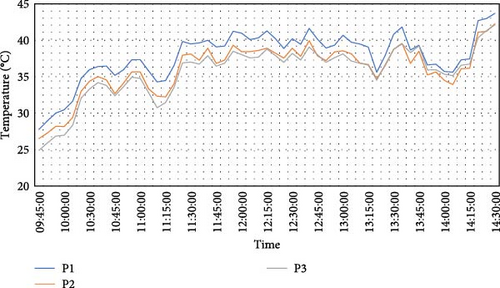
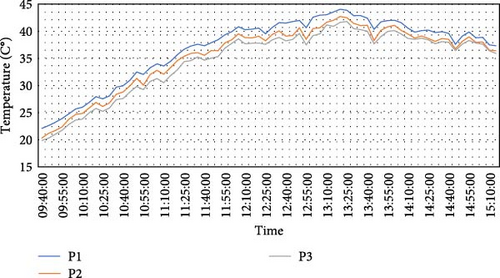
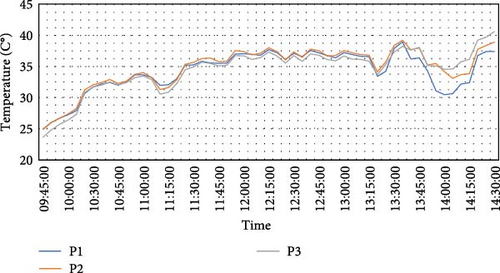
It can be observed from the provided figures that the back surface temperatures are higher than the front surface temperatures, considering the experimental configurations applied here. This observation could be directly related to the flooring color, which is black, indicating more heat to be radiated towards the back surface of the panels. Earlier, the tar paper sheet, the roofing material, absorbed this heat.
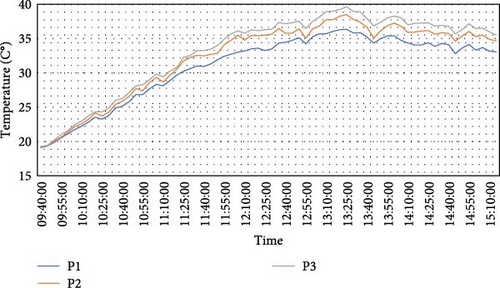
In the inclined configuration, where the test bed was mounted on a dual-axis solar tracker with a tilt angle equal to the local latitude, and the roofing material was brownish cellulose fiberboard, mimicking the roof tiles found in houses in Brasov city, the same previous observations still hold true. As demonstrated by the time series curves in Figures 31 and 32, the back surface temperature is highest for the clean module, P1. The same pattern is observed for the rate of change of front surface temperature, as illustrated in Figures 33 and 34, where the most dust–soiled panel, P3, exhibits the highest temperatures. Again, the thermal image provided in Figure 35 aligns with the observations and reinforces the rational results obtained so far.
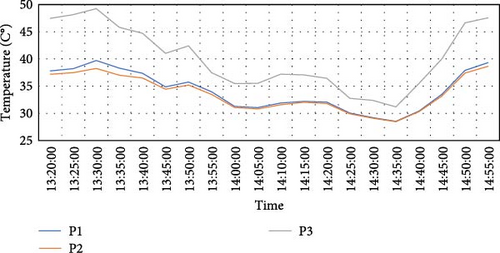
However, the back surface temperatures are higher than the front surface temperatures only in the case of a few dust deposits, specifically P2. For the case of a thicker dust cover (P3), the front surface temperatures are higher than the back surface temperatures, indicating a neutral effect of the floor color.
Additionally, temperatures of both the back and front surfaces of the PV panels are higher in the latitude-tilted position than in the horizontal one. This aligns with the previously explained concept that the optimal tilt angle for solar panels in a fixed position is equal to the local latitude. To summarize all the data and observations presented in the figures, Table 3 provides numerical values for the daily averaged temperature differences between the dust-polluted modules (P2 and P3) and the clean one (P1).
| Day | Plane | Flooring color | Surface | Daily average temperature difference (K) | |
|---|---|---|---|---|---|
| P1 and P2 | P1 and P3 | ||||
| September 27, 2023 | Horizontal | Black | Back | 1.77 | 2.20 |
| October 3, 2023 | 1.47 | 2.36 | |||
| September 27, 2023 | Front | 0.64 | 1.00 | ||
| October 3, 2023 | 1.31 | 2.17 | |||
| October 30, 2023 | Latitude tilt | Brown | Back | 1.76 | 5.12 |
| October 31, 2023 | 1.68 | 1.79 | |||
| October 30, 2023 | Front | 0.48 | 6.03 | ||
| October 31, 2023 | 1.32 | 4.30 | |||
In the horizontal position, the highest temperature difference is observed for the back surfaces of P1 and P3, equaling 2.36 K, while the lowest difference is noted for the front surfaces of P1 and P2, equaling 0.64 K for two different days. The global highest and lowest temperature differences are found in the inclined position, both occurring on the same day and involving the front surface. The highest difference is 6.03 K and the lowest is 0.48 K. Generally, temperature difference values at the tilted position are higher than those at the horizontal position, reinforcing the earlier observation of optimal performance in the latitude-inclined orientation when the tilt angle is fixed.
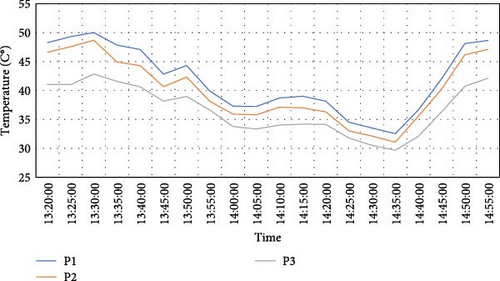
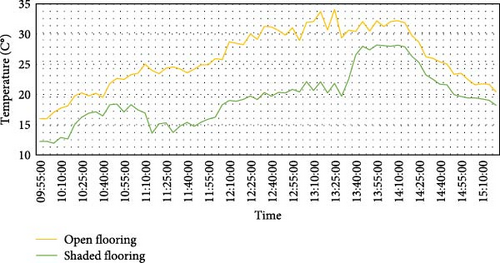
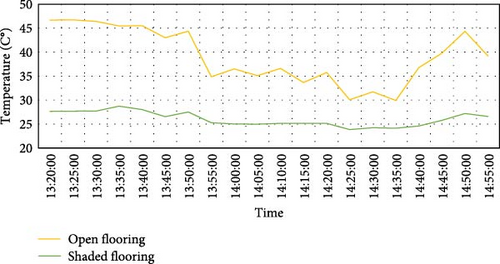
It is evident from the thermal image in Figure 30 and the data presented in the following figures that there are expected temperature differences between the shaded and unshaded roof flooring, whether the floor is horizontal or inclined, and whether it is brown or black. Figure 36 shows smaller temperature differences between the shaded and unshaded tar paper sheet flooring over time, while Figure 37 illustrates larger temperature differences during the day between the covered and uncovered fiberboard. This observation suggests a potential color effect on the flooring temperature, as reflected in the daily average floor temperature difference numbers listed in Table 4. The horizontal tar paper roof sheet exhibits smaller temperature differences, indicating less reflected light and more absorbed heat. The differences for the brown inclined fiberboard were slightly more significant, suggesting more reflected light and less absorbed heat than in the previous setting.
| Day | Plane | Roof floor type | Daily average temperature difference (K) |
|---|---|---|---|
| September 29, 2023 | Horizontal | Black tar paper sheet | 6.32 |
| October 3, 2023 | 9.63 | ||
| October 4, 2023 | 7.72 | ||
| October 6, 2023 | 7.2 | ||
| October 9, 2023 | 6.48 | ||
| October 12, 2023 | Latitude tilt | Brown cellulose fiber sheet | 7.25 |
| October 30, 2023 | 13.08 | ||
| October 31, 2023 | 11.53 | ||
4. Conclusion
- 1.
Electric performances and thermal responses of the panels on the reference day were similar.
- 2.
Time series curves for Pmax exhibited high similarity, with an average interchangeable discrepancy of 0.37% in values between panels (global max/min values: 2.69 and 2.1 W).
- 3.
Time series charts for Isc indicated cleanliness, with an average interchangeable discrepancy of 0.43% between panels (global max/min values: 0.35 and 0.27 A).
- 4.
Thermal response in initial conditions showed average interchangeable discrepancies of 1.35% and 2.76% for front and back surface temperatures, respectively (global max/min temperatures: 42.5 and 31.7°C).
- 5.
Constant well-dusted panel power losses for P3, quantified at 23.4% on average in the horizontal position and 15% in the latitude-tilted position.
- 6.
Minor losses fluctuating between 1% and 2% for P2 due to small amounts of artificially deposited dust.
- 7.
Analysis of data for specific days reveals similar power losses comparing P2 with P1, but a notable decrease in losses comparing P3 with P1, especially when transitioning from horizontal to tilted position.
- 8.
In the horizontal position, the highest temperature difference was observed on the back surfaces of P1 and P3 (2.36 K), and the lowest on the front surfaces of P1 and P2 (0.64 K on two different days).
- 9.
In the inclined position, the highest and lowest temperature differences occurred on the same day for the front surface (6.03 and 0.48 K, respectively).
- 10.
Generally, temperature difference values in the tilted position were higher than in the horizontal position, supporting the earlier observation of optimal performance in the latitude-inclined orientation.
- 11.
Observation suggests potential color effect on flooring temperature, reflected in daily average floor temperature difference numbers in Table 4.
This work presents an insightful case study rather than a comprehensive research study, with several limitations. The experiments were conducted over just 1 month, which might not fully capture the impact of seasonal variations on dust accumulation and panel efficiency. Additionally, the study was restricted to a specific location in Brasov, Romania, and involved only a small number of PV panels. As a result, the findings may not be applicable to different geographic or climatic conditions. The dust application was also not perfectly uniform, and the roofing materials used—black tar paper and brown cellulose fiberboard—were specific to the experimental setup. Moreover, only two panel orientations were tested, and although the measurement equipment was accurate, it may have influenced the results.
To address these limitations, future research should extend the duration of studies to include seasonal variations, explore diverse locations, and assess a broader range of PV technologies. Advancing monitoring technologies, such as Internet of Things (IoTs) sensors and artificial intelligence (AI), could enhance real-time monitoring and predictive maintenance of PV systems. Additionally, investigating the economic implications of dust-related power losses and the broader environmental benefits of improved PV performance would be valuable.
These research directions aim to provide a deeper understanding of PV system performance under various conditions, ultimately leading to more effective dust management strategies and better utilization of solar energy.
Nomenclature
-
- I:
-
- Current
-
- V:
-
- Voltage
-
- I–V:
-
- Current–voltage
-
- Isc:
-
- Short-circuit current
-
- Pmax :
-
- Maximum power
Abbreviations
-
- BAPV:
-
- Building-applied PV
-
- BE:
-
- Built environment
-
- PV:
-
- Photovoltaic
Units
-
- A:
-
- Current
-
- V:
-
- Voltage
-
- W:
-
- Power
-
- °C:
-
- Temperature
-
- K:
-
- Temperature difference.
Ethics Statement
The authors declare that no human participants, their data, or biological material are included in this study. Furthermore, there are no ethical issues related to the research conducted in this work.
Consent
The authors declare that no volunteers, participants, or individuals were involved in this research study, and therefore, no consent was obtained.
Disclosure
The authors grant permission for the publication of the manuscript in the International Journal of Energy Research, published by John Wiley & Sons.
Conflicts of Interest
The authors declare no conflicts of interest.
Author Contributions
All authors contributed to the study conception and design. Material preparation, data collection, and analysis were performed by Abubaker Younis, Daniel Tudor Cotfas, and Petru Adrian Cotfas. The first draft of the manuscript was written by Abubaker Younis and all authors commented on previous versions of the manuscript. All authors have read and approved the final manuscript.
Funding
The authors declare that no funds, grants, or other support were received during the preparation of this manuscript.
Open Research
Data Availability Statement
The data that support the findings of this study are available on request from the corresponding author.


