Transforming Crete’s Sustainable Energy Landscape: A Modular Energy Island Approach
Abstract
The present paper investigates the conceptual design of a floating offshore renewable energy system—an energy island—developed to provide a sustainable long-term solution to support and expedite the transition toward renewable energy sources (RESs) as a case study in Crete Island, Greece. The optimal site selection in Crete’s coastal waters was detected by carefully evaluating the potential for wind, solar, and wave energy alongside environmental and social considerations. Later, the current electricity demand was analyzed, leading to the identification of suitable technologies for renewable energy harvesting and the conceptualization of a floating structure. The findings of this research emphasize the viability of integrating diverse energy sources as a pivotal step for Crete Island to advance toward energy independence and environmental sustainability. Crete’s abundant wind and solar resources underscore its capacity to host innovative projects, warranting further exploration into energy surplus storage and export.
1. Introduction
Natural islands often experience high energy prices due to their dependence on imported gas and oil from the mainland [1–3]. As a result, the concept of self-sufficient energy production on natural islands has been investigated for over two decades, largely because of the abundant resources available on many islands [3–5]. In recent years, several strategies have been proposed to boost the energy transition of island communities [6–11]. However, the use of integrated ocean resources is yet to be explored in detail.
More recently, the notion of an energy island has gained popularity in industry, politics, and academia. This concept encompasses a range of definitions, including existing natural islands, engineered islands to serve as hubs for offshore projects, interconnected services to enhance efficiency and production, or combinations thereof. A comprehensive analysis of the various meanings of the energy island concept can be found in Retting et al. [12].
To advance toward a more sustainable energy future and prepare more professionals in the field, during the first Training School for the Cost Action MODENERLANDS, the participants received several lectures on the scope of the action, with a particular focus on assessing offshore sustainable energy resources the island of Crete, in Greece’s Mediterranean waters. Multidisciplinary groups were formed and provided the same input data to develop an offshore energy island installation capable of supplying Crete’s energy demand using only renewable sources. The findings reported in this research build upon the work conducted by one of these multidisciplinary groups, as described in Karipoğlu et al. [13].
This paper presents an offshore floating energy island as a sustainable approach to meet Crete’s energy demand through renewable sources, especially considering the great renewable energy potential the island and its surrounding waters offer. This study serves as a model for local authorities, policymakers, and energy stakeholders to promote the adoption of energy islands to supply clean energy to isolated communities through innovative strategies. Additionally, it highlights the remarkable energy efficiency and resource optimization achievable by integrating multiple renewable energy sources (RESs).
Following the overview of what the authors consider to be milestones in developing the energy islands approach in Section 2, Section 3 details the current energy landscape of Crete that framed this study. Section 4 outlines the strategy and critical assumptions made by the authors as well as the conceptual design of the floating island, encompassing its location, energy demand analysis, chosen technologies, infrastructure considerations, anticipated power output, and other pertinent energy-related considerations. This section also discusses other essential aspects, such as the integration of these hybrid systems into the grid and the importance of storage solutions for reliability and social acceptance factors. Finally, Section 5 summarizes the primary conclusions drawn from this investigation.
2. State-of-the-Art in the Development of the Energy Island Approach
In 1997, the Danish natural island of Samsø became a global model for sustainability by turning its electricity production to 100% renewable sources, mainly wind power and biomass [14]. The island depended entirely on oil and gas imported from the mainland until 11 onshore and 10 offshore wind turbines were erected, and vehicles began to be powered with local biofuel. It has been broadly recognized that a substantial part of the project’s success is due to the active participation of the locals, who even funded the construction of the offshore wind farm [15–17].
In 2007, Chen et al. [18] introduced a program called RenewIslands (Renewable Energy Solutions for Islands), which developed various solutions to integrate intermittent RESs, such as wind and solar, with fuel cell and hydrogen storage infrastructure to decentralize power systems. The program used as a case study the Canary Islands (Spain), Ærø Island (Denmark), a sample of Greek Islands, Madeira, and Azores (Portugal), and the Cape Verde Islands. The study concluded that natural islands offer significant opportunities to test new sustainable solutions. Additionally, a methodology based on work packages was proposed for the sustainable development of natural islands.
Nevertheless, developing autonomous energy systems on natural islands can encounter challenges related to national energy policies and local obstacles. Sanseverino et al. [19] studied the feasibility of turning Pantelleria Island, Italy, into a near-zero energy system. Even though the technical aspects could be relatively easy to overcome, national energy policies and specific local circumstances were identified as the most significant challenges due to the solid private monopole with no interest in developing autonomous systems. Likewise, local administrators lack the cultural and economic tools to achieve the project’s goals. In response, Novo et al. [20] introduced an innovative local energy planning approach using Pantelleria as a case study that encouraged policymakers and investors to prioritize renewable energy developments. Finally, over recent years, the island developed the “Pantelleria Clean Energy Transition Agenda” [21] through an inclusive, participatory process, emphasizing energy supply and consumption’s environmental and social impacts. This comprehensive agenda, crafted in collaboration with various local stakeholders, outlines a strategic path toward achieving energy self-sufficiency by 2050. The joint efforts in Pantelleria granted the island a spot in the “Clean Energy for EU Islands” program in 2023 [22].
As previously mentioned, another definition of energy islands encompasses engineered projects, such as artificial islands constructed using state-of-the-art techniques or floating platforms similar to those used in the oil and gas sector. These engineered islands are designed to host combined energy production or as hubs for other renewable offshore projects. In 2012, the Swedish energy company Hexicon proposed to install a floating energy platform in Maltese waters. The aim was to provide Malta with an offshore wind farm incorporating solar and wave generation to decrease the country’s dependency on fossil fuels. The estimated potential was 54 MW; a preliminary concept can be seen in Figure 1a. Nevertheless, no news about the project has been found in recent years, and it seems that the initiative was put aside from the company’s plans [23, 27–29].

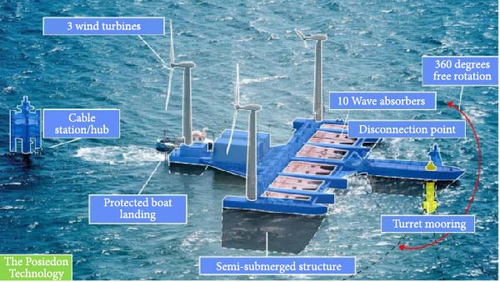
With a similar approach and managing to go further into testing and development, Yde et al. [24] analyzed the Poseidon 2 platform for wave energy systems and floating wind turbines. In their study, a scaled prototype called P37 was constructed and operated offshore for 2 years for experimental purposes (Figure 1b). P37 was extensively instrumented, and the data obtained were used to evaluate the design and validate the numerical models. This concept has been commercially developed as the Floating Power Plant [30].
Floating platforms acting as energy islands are also appealing in the scope of existing offshore wind farms. Since large-scale wind turbines require a significant distance from each other to operate safely, the energy density of such projects is somehow low. Hence, using smaller and alternative generation methods between the existing towers can bring the energy density to a higher level. A proposal for such a concept was developed recently in [31] by adding platforms with vertical axis wind turbines, wave energy converters, and airborne wind energy converters to the existing offshore London Array wind farm.
Recently, Denmark started developing two energy islands that will serve as transmission hubs, or green power plants, to gather the energy produced by the offshore wind farms and distribute it to the electric grid. With such islands working as midpoints, locating offshore wind projects even further into the ocean would be possible. This goal means that the islands must have the capability not only of distributing energy but also to store it in the cases in which the wind turbines’ production exceeds the demand. Another possibility is to export it to neighboring countries [32].
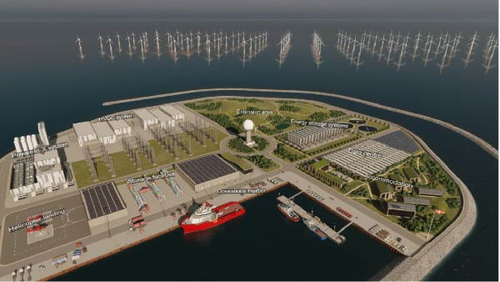
One of the islands in mention is planned for the North Sea and will have a capacity of 3 GW in the short term to 10 GW in the longer term; this first island was conceived as an engineered island, and a private proposal has been made presenting flexible modular platforms built onshore and transported by sea for the connection to a central island, Figure 1c shows a proposal for this new island that will potentially have the name of Vindø. The second one will take advantage of the natural Danish Island of Bornholm, in the Baltic Sea, and is expected to provide a capacity of at least 3 GW. Preliminary studies have started, and the goal is to establish them by 2030. The project plan was recently published, and an offshore tender is currently under development [33]. Secondary projects have also been mentioned to increase the feasibility of the islands, such as data centers, ports or lodgings, and recreational areas for the island’s inhabitants [34].
Moreover, Princess Elisabeth Island is currently under development in Belgian waters and is claimed to be the world’s first engineered energy island. It is designed as an electricity hub that integrates cables from nearby offshore wind farms. Located 45 km off the coast and spanning 6.0 hectares, Princess Elisabeth Island is being built on concrete caissons filled with sand and will primarily house transmission infrastructure, along with a small harbor and helideck for maintenance. This pioneering island will uniquely combine high-voltage direct current (HVDC) and high-voltage alternating current (HVAC) systems, promoting biodiversity with its nature-inclusive design [35].
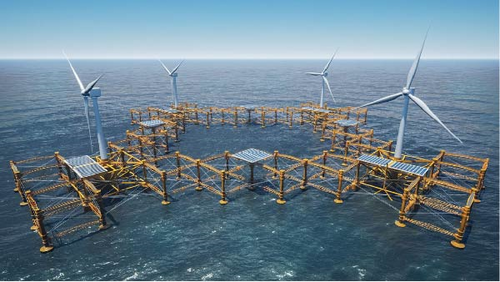
Norwegian company Rosenberg-Worley presented a floating offshore platform that hosts different types of energy production called Flex2power (Figure 1d). The platform shares a large flexible foundation supporting different structures to produce wind, solar, and wave potential electricity. This platform had been designed for a total installed capacity of 65 MW, with 32 MW produced by wind, 32 MW by waves, and 1 MW powered by the sun. A pilot plant is under construction using a 5 MW wind turbine, wave energy generators with an installed capacity of 6 MW, and a photovoltaic (PV) system with a capacity of 0.2 MW, for a total of 11.2 MW [26].
A recent study by Kurniawati et al. [36] outlined a conceptual design for a renewable energy island to meet Crete’s energy demand. The authors proposed a self-sufficient island based on projected energy demand in this effort toward Crete’s energy independence. However, Crete’s specific energy needs were not explored in detail, which is crucial in accurately determining the energy requirements of combined energy systems. Kurniawati et al. [36] integrated offshore wind, wave, and solar energy systems into the floating energy island. While offshore wind technology is mature, other technologies, such as wave energy converters, face challenges due to high costs and low efficiencies [37]. Adding a third source of renewable energy, specifically wave energy, may compromise the selection criteria and disadvantage locations with greater wind and solar potential. Furthermore, Crete has been the case study for several other pilot projects to develop large-scale integration of RESs [3, 5, 38–45].
3. Crete’s Energy Landscape
This section sets the basis for the conceptual design by assessing Crete’s current conditions and energy demand. With a population of ~634,930, Crete is Greece’s largest island and the fifth largest in the Mediterranean Sea. The island extends 260 km in length, with a width ranging from 12 to 60 km, and features a coastline of about 1000 km, covering a total area of 8336 km2. Crete’s economy is primarily driven by tourism, followed by commerce and agriculture. Although Greece’s economic crisis impacted the local economy, it has gradually recovered since 2017, primarily due to tourism [3, 5, 44, 45].
The island exhibits significant fluctuations in energy consumption throughout the year, mainly due to the rise in touristic activity during summer, which abruptly increases the population of the island from April to October. A detailed study on Crete’s hotels’ energy demand during summer revealed that most electricity in such facilities is consumed in water heating and air cooling [46]. Crete’s electricity production is mainly based on thermal power plants and a few wind parks and PV stations; it is the largest autonomous power system in Greece, representing about 5% of the total energy demand [3, 41]. As of December 2021, the significant rise in global fossil fuel prices likely drove the specific cost of electricity generation in Crete to exceed 0.30 EUR/kWh. A comprehensive characterization of Crete and its energy consumption per sector can be found in Katsaprakakis et al. [5, 41].
The Region of Crete recently joined the “Clean Energy for EU Islands” initiative to help natural islands produce sustainable, low-cost energy. The project intends to help islands reduce energy costs and increase production using renewable sources, construct storage facilities, lower greenhouse gas emissions, and create new jobs and opportunities for the local communities, amongst other objectives [22]. In this framework, Crete has started working on an Energy Transition Agenda (ETA) to describe the island’s current status and energy systems [5]. The summarized results of the first report are shown in Table 1. It is noted that around 300 MW of renewable sources are already being produced, which contributes to 22%–25% of the monthly power generation.
| Unit | Installed power (MW) |
|---|---|
| Steam turbines | 204.3 |
| Diesel generators | 185.9 |
| Gas turbines | 320.8 |
| Combined cycle | 132.3 |
| Hydropower plant | 0.6 |
| Photovoltaics | 107.4 |
| Wind parks | 200.3 |
| Subtotal from RES | 308.3 (26.7%) |
| Total | 1151.6 |
- Note: Renewable energy sources are shown in italics.
The ETA also identified 60 new projects that have received the Production License from the Greek Regulatory Energy Authority that would add 370 MW to the system; some of these projects include storage technologies such as pump storage and batteries. The study also acknowledges three new developments regarding the island’s electrical connection that will slowly contribute to the gradual shutdown of thermal power plants based on fossil fuels. In total, the three connection projects include the installation of four submarine cables, one of which was completed and electrified in June of 2021, Crete-Peloponnese [47]. More details about Crete’s connection to the continental grid are given in Section 4.3.2.
3.1. Crete’s Energy Consumption and Forecast for 2030
Detailed energy demand data for Crete in 2019 were compiled from recent sources [5, 42, 48, 49] and is shown in Figure 2. Figure 2 explores the annual fluctuations in energy demand in Crete for 2019, which vary seasonally mainly due to tourism and regional needs. It is important to note that 2019 is the latest year for which public records of Crete’s energy consumption are available. Furthermore, since 2019 predates the disruptions caused by the COVID-19 pandemic [50, 51] and the Russia-Ukraine war [52, 53], the authors consider it the most representative year for typical energy consumption patterns.
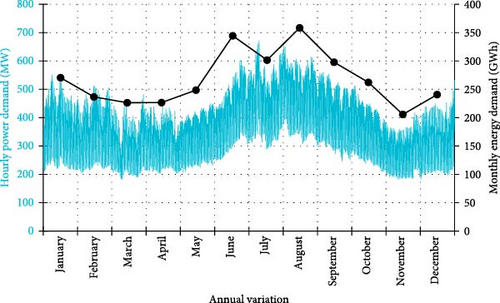
As expected, the hourly and monthly variations in 2019, as shown in Figure 2, demonstrate that Crete experiences peak energy consumption during the highly touristic and hot summer months [5]. In 2019, a peak power demand of 623 MW occurred during an hour in the middle of July, while the minimum power demand (160 MW) happened during March [5]. The total energy consumed in Crete during 2019 accumulated to 3220 GWh.
Due to the lack of available data for recent years, Crete’s energy consumption up to 2030 was forecasted based on recorded data and official national projections for the entire country. As an initial step, Crete’s 2019 energy consumption was compared to Greece’s overall consumption in Figure 3, using the data from the Independent Power Transmission Operator (IPTO) [54]. This comparison reveals that the island’s consumption trend mirrors the country’s, evidently on a smaller scale.

Figure 3 also highlights that summer is the most energy-intensive season, with a sharp rise in consumption observed at both the national and local levels from June to September. However, two differences emerge between the two trends. First, Greece’s energy consumption in January 2019 was unusually high, surpassing the peak levels typically associated with August’s tourist-heavy and hot summer. This pattern is absent in Crete, likely due to its milder Mediterranean climate, which mitigates winter energy demands. The second difference is observed in July, where Crete’s energy consumption unexpectedly decreased, deviating from the otherwise consistent seasonal trend.
Figure 4 focuses exclusively on Greece’s energy consumption from 2012 to 2023. Despite yearly fluctuations in overall demand, Figure 4 reveals a consistent monthly consumption pattern over time, reinforcing the conclusions drawn from Figures 2 and 3. This stability suggests that 2019 (in continuous dark blue lines) can be regarded as a representative year for energy consumption trends at the national level.
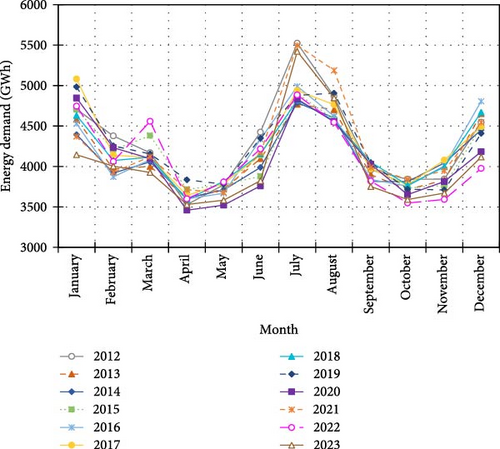
The annual energy consumption for Greece in GWh for the same period (2012–2023) is presented in Table 2. Based on the information in Table 2, the total energy consumption in Crete for 2019 represents ~6.3% of the energy demand of Greece, aligning with previous studies [3, 41].
| Year | Energy consumed (GWh) | Year | Energy consumed (GWh) |
|---|---|---|---|
| 2012 | 51,559 | 2018 | 50,253 |
| 2013 | 49,547 | 2019 | 51,027 |
| 2014 | 49,192 | 2020 | 48,979 |
| 2015 | 50,129 | 2021 | 50,985 |
| 2016 | 50,112 | 2022 | 49,358 |
| 2017 | 50,921 | 2023 | 48,412 |
As shown in both Figure 4 and Table 2, Greece has effectively managed the growth of its energy consumption in recent years, even achieving nationwide energy savings in some years. Several factors contribute to this success. First, Greece’s energy and climate policies focus on achieving zero emissions by 2050 while maintaining energy security [55]. These goals were outlined in the National Energy and Climate Plan (NECP) of 2019 [56], with particular emphasis on reducing the country’s reliance on lignite for electricity generation. Moreover, the project Exoikonomo (Saving at home) promotes the renovation of residential buildings to increase energy efficiency by subsidizing energy savings and renewable energy investments. The program is said to be responsible for a reduction in gas consumption of 16% between August 2022 and January 2024 [46, 57, 58]. The energy efficiency of final consumers in Greece from 2000 to 2021 has also been well documented by the Energy Efficiency Index of Industry (ODEX), which improved by 34% in this period [58].
It is also important to note that Greece underwent a severe economic recession between 2008 and 2013, which has been linked to a reduction in electricity demand. The lingering effects of this recession are still evident today in the irregular fluctuations observed over the years [5, 55].
The well-documented impact of the COVID-19 pandemic on energy consumption trends requires a detailed analysis of energy usage in Greece from 2019 to 2023, as shown in Figure 5. This analysis highlights the effects of public health measures, such as lockdowns and border closures, on travel, tourism, and, consequently, national energy demand. In Figure 5, dashed columns illustrate the decline in energy consumption due to pandemic-related restrictions. The sharp decrease began in April 2020 and persisted until February 2021. With the gradual relaxation of public health measures, energy consumption started to recover in March 2021, peaking during the summer months of July and August 2021. The effect of lifting all restrictions in May 2021 is evident, with a notable increase in energy consumption extending up to May 2022 [5, 55, 59]. Figure 5 highlights this postpandemic rise in light green and orange bars.
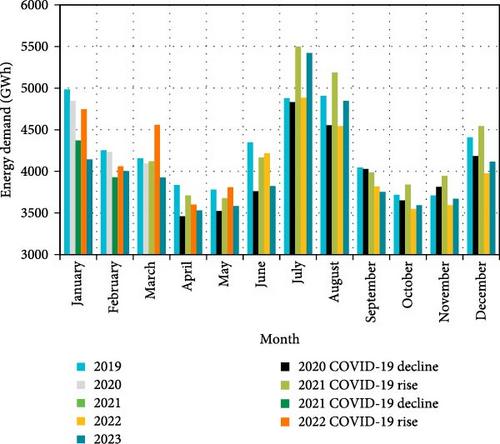
Using the monthly energy consumption data from Figure 4 but excluding the periods impacted by the COVID-19 pandemic, as indicated in Figure 5, the average monthly variation in Greece’s energy consumption from 2012 to 2023 was calculated. The Greek NECP and projections from other scholars forecast a yearly growth rate of 3.0% in energy demand through 2030 [44, 56]. Adjustments were made based on historical trends to align with this official national forecast and account for a conservative scenario. Hence, months that experienced a decline in energy consumption were penalized by a factor of 1/4, reflecting a reduced likelihood of sustained energy savings. Conversely, months traditionally showing a rise in energy consumption were amplified by a factor of 4, considering the potential impacts of increasing global temperatures and intensified postpandemic travel patterns [59–61]. The adjusted percentages of monthly variation, derived from national data and adjusted as explained, were then applied to Crete’s 2019 energy consumption data. The summarized results are presented in Table 3.
| Month | Variation | Energy consumption forecast (GWh) | ||||
|---|---|---|---|---|---|---|
| 2022 | 2024 | 2026 | 2028 | 2030 | ||
| January | 1.7% | 285 | 295 | 305 | 316 | 327 |
| February | −0.3% | 234 | 233 | 231 | 230 | 229 |
| March | −0.1% | 226 | 225 | 224 | 224 | 223 |
| April | 2.6% | 245 | 258 | 272 | 287 | 302 |
| May | −0.2% | 247 | 247 | 246 | 245 | 244 |
| June | 5.5% | 404 | 450 | 501 | 557 | 620 |
| July | 11.3% | 416 | 516 | 639 | 792 | 981 |
| August | 8.1% | 452 | 528 | 617 | 720 | 841 |
| September | 3.2% | 328 | 349 | 372 | 397 | 423 |
| October | −0.1% | 261 | 260 | 260 | 259 | 258 |
| November | −0.1% | 205 | 205 | 204 | 204 | 204 |
| December | −0.4% | 238 | 236 | 234 | 232 | 230 |
| Annual | 3.0% | 3,542 | 3802 | 4106 | 4463 | 4882 |
The monthly variation in energy consumption from 2019 to 2030 is illustrated in Figure 6. Figure 6 shows that the traditionally less energy-intensive months (February, March, May, October, November, and December), which have historically experienced reductions in energy usage, continue to show savings through 2030, albeit at a slower pace. In contrast, the more energy-intensive months (January, April, June, July, August, and September) exhibit an accelerated increase in energy consumption over the same period.
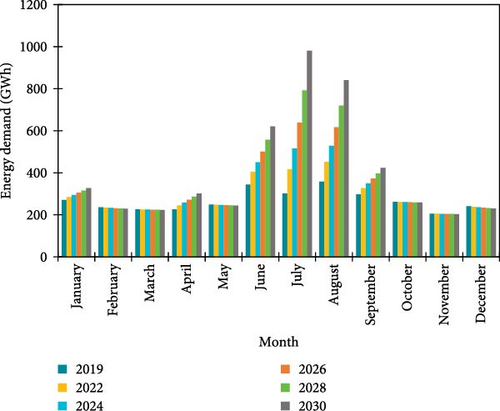
Figure 7 presents the total annual energy consumption in GWh for Greece from 2012 to 2030 and Crete from 2019 to 2030, derived from the cumulative monthly consumption discussed above. For Greece, the annual energy consumption will reach the projected 62 TWh by 2030, aligning with the 3.0% yearly growth rate outlined in the NECP; the estimated energy consumption for 2030 is 4882 GWh. A summary of these results is provided in Table 4.
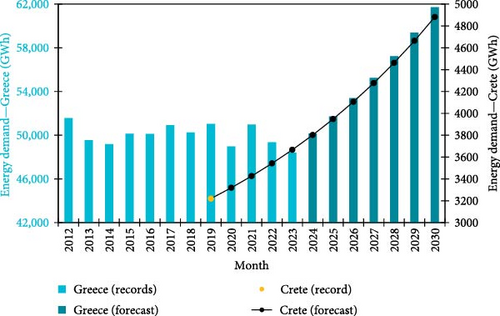
| Year | Energy consumed for Crete (GWh) | Year | Energy consumed for Crete (GWh) |
|---|---|---|---|
| 2019 | 3220 ∗ | 2025 | 3948 |
| 2020 | 3319 | 2026 | 4106 |
| 2021 | 3426 | 2027 | 4277 |
| 2022 | 3542 | 2028 | 4463 |
| 2023 | 3667 | 2029 | 4664 |
| 2024 | 3802 | 2030 | 4882 |
- ∗Recorded value [54].
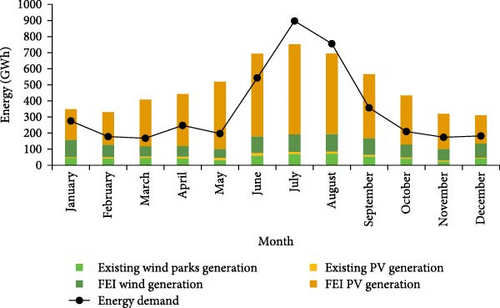
The expected energy consumption for 2030 and the current wind and solar energy generation are compiled in Table 5 to obtain the net energy demand and proceed with the following design stages. As observed from the table and aligned with the previous discussion, the summer is the most energy-intensive period on the island. At the same time, spring and autumn display the lowest energy demands. To visualize the contribution of the RESs to the total energy demand, Figure 8 depicts the net monthly energy demand as well as the existing wind parks and PV energy generation.
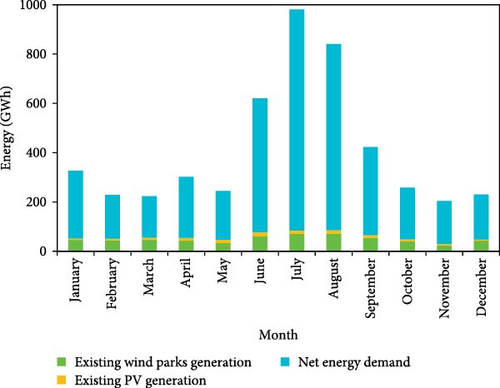
| Month | Energy consumption 2030 (GWh) | Existing wind parks generation (GWh) | Existing PV generation (GWh) | Net energy demand (GWh) |
|---|---|---|---|---|
| January | 327 | 46 | 6 | 275 |
| February | 229 | 44 | 7 | 178 |
| March | 223 | 46 | 10 | 168 |
| April | 302 | 43 | 12 | 248 |
| May | 244 | 33 | 14 | 197 |
| June | 620 | 60 | 17 | 543 |
| July | 981 | 71 | 13 | 897 |
| August | 841 | 71 | 14 | 756 |
| September | 423 | 55 | 11 | 357 |
| October | 258 | 40 | 9 | 210 |
| November | 204 | 24 | 6 | 174 |
| December | 230 | 42 | 5 | 182 |
| Annual (GWh) | 4882 | 575 | 123 | 4184 |
4. Conceptual Design of a Floating Energy Island: Crete’s Case
- i.
The ideal location of the offshore installation is based on the following criteria and as per the recommendations of [2, 42, 62]:
- a.
Available wind, solar, and wave potential.
- b.
Minimum and maximum water depth.
- c.
Environmental considerations, including marine natural reserves or conservation areas.
- d.
Socioeconomic factors, such as aquaculture and fishery.
- e.
Utilization of existing infrastructure, like ports and electrical substations.
- f.
Other limiting conditions, such as military-restricted areas.
- a.
- ii.
Current electricity demand: determining the demand for electrical energy and the required production capacity considering only RESs.
- iii.
Conceptual design: preparing a proposal for a floating structure that could host different technologies for harvesting the available renewable energy potential.
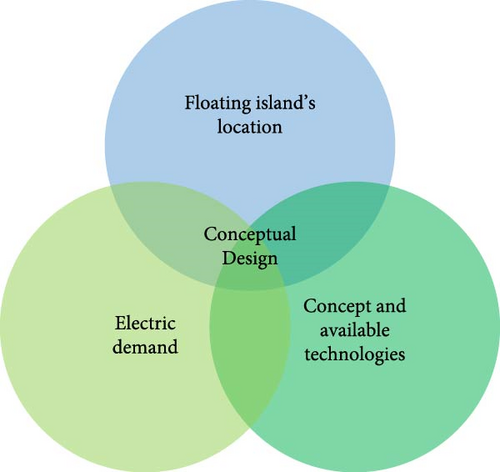
It is essential to highlight that to achieve the ideal design, the objectives must be developed synergistically, as illustrated in Figure 9. For instance, prioritizing location criteria and electric demand over available technologies may yield results that are not realistically achievable or could overlook future opportunities for increasing energy production. Therefore, the design process was iterative, balancing these objectives and involving multiple modifications to the shape and technologies of the proposal until the energy demand was satisfactorily met.
- •
Small existing bioenergy projects will be excluded from Crete’s energy generation calculations.
- •
Energy consumption for fueling vehicles is not included in Crete’s annual energy consumption, and the potential increase in demand from charging hybrid or electric vehicles is also excluded at this stage.
- •
The energy storage projects proposed in [5] will be completed before the construction of the energy island, providing a total storage capacity of 26,327 MWh.
- •
The three projects connecting Crete with the national Greek grid will be completed before the construction of the proposed offshore installation, enabling the export of surplus energy [2].
With these assumptions in place, the following sections present the most suitable location, calculated energy demand, and the conceptual design.
4.1. Selecting a Suitable Location: Resource Assessment
In the scope of the study, Crete’s meteorological datasets, which include temperature ratio, rainfall, and cloudy days, have been investigated and discussed. Based on the meteorological data, the average temperature throughout the year varies between 10 and 14°C. Although the summer seasons have huge solar irradiations, winter days are cloudy and windy. Determining the location of the floating energy island is a critical step in the process and must balance technical and environmental conditions [62]. As previously discussed, it entails careful consideration of numerous essential criteria, and after several iterations, the optimal location is selected. The following paragraphs provide a detailed explanation of each criterion and conclude by presenting the final location chosen.
4.1.1. Geographical Information System (GIS)–Multi-Criteria Decision-Making (MCDM) Methodology
Suitable site selection is crucial for erecting the optimal energy power plants [62]. Integrating GISs and MCDM is intensively preferred for detecting and analyzing the datasets. The present study reflects an example of integration to determine the optimal site selection for energy islands. Wind speed, solar horizontal irradiance, and bathymetry were investigated in technical constraints when marine protected areas and electrical grid availability were restricted in environmental and accessible constraints. The optimal location was selected and presented according to the constraints detected in the study region of Crete, Greece.
The first criterion was the wind energy potential, best represented by the mean wind velocity. The mean wind velocity map at 100 m of elevation for the offshore area around Crete Island was obtained using the Global Wind Atlas (GWA) [63]. Afterward, GIS was used to prepare a map with the wind speed distribution, as shown in Figure 10. According to the GWA, regions with mean wind speeds under 7.0 m/s (labeled white on the map) are not recommended for wind energy production [63]. Due to this, most offshore regions near Crete’s coast are deemed nonsuitable for wind turbine installations. Nevertheless, the darkest areas, especially those with a mean wind speed of more than 10.0 m/s, have a reasonable wind potential and can provide strong winds. Hence, dark green areas in Figure 10 at the south and east of the island show the highest wind potential for harvesting wind energy.

Following the wind potential, solar insolation was explored. Figure 11 presents the insolation for every point in Crete’s territorial area. Since no offshore surface insolation open-access database is currently available, it was assumed that the closest onshore point can approximate the offshore isolation. It is important to note that, according to Global Solar Atlas (GSA), a location is suitable for installing solar panels if the Global Horizontal Irradiance (GHI) is greater than 1700 kWh/m2 [64], making, in general, the south of the island more suitable for accommodating solar energy production. According to recent studies, the Mediterranean basin is recognized for generating solar electricity due to high solar irradiance [44, 65]. The advantages of PV systems in Crete and other Mediterranean islands have also been recently studied [66–68].
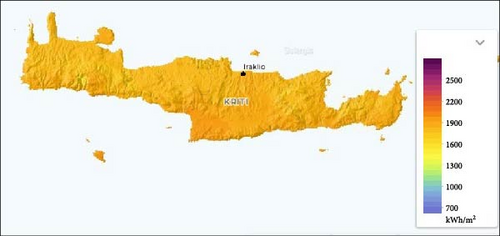
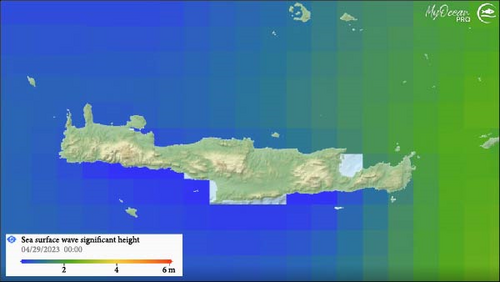
Figure 12 presents the wave energy potential evaluated using the Global Ocean Waves Reanalysis Map [69]. Regrettably, compared to other locations in which wave energy is currently taking the scene, such as the Atlantic and Pacific oceans [70], it can be seen from Figure 12 that the Mediterranean Sea does not have a significant wave energy potential. Still, the potential around Crete is slightly higher on the island’s southern side than on the northern side.
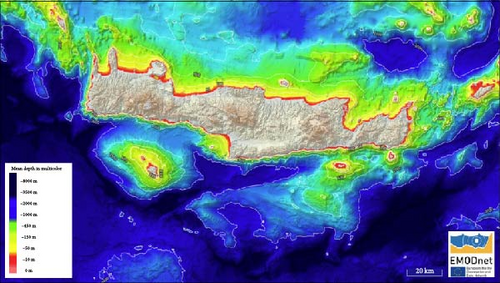
According to [71], floating offshore platforms are adequate for sea depths greater than 60 m. Hence, the bathymetry of Crete’s water was also evaluated. The water depth map was obtained from the European Marine Observation Data Network (EMODNET) and is shown in Figure 13 [72]. Considering the previous statement, it is possible to say that green, blue, and black areas are deeper than 60 m.
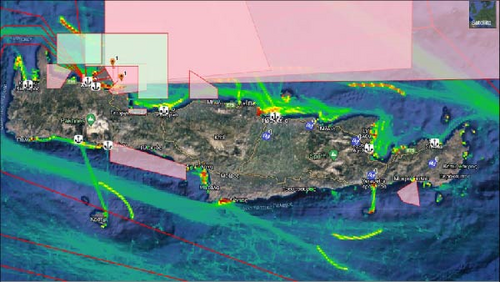
As previously mentioned, social acceptance and the impact on existing human activities in the area must be considered when selecting a location for an offshore installation. Thus, the island structure should be placed outside existing shipping routes, military regions, and aquaculture zones and as far away as possible from the coast to avoid disturbing the landscape. In contrast, the energy island should be as close as possible to any sufficiently equipped ports to enable quick and easy access to the island for maintenance and other purposes.
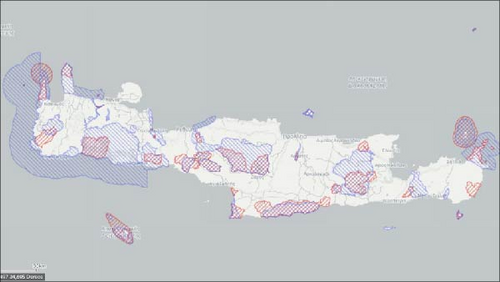
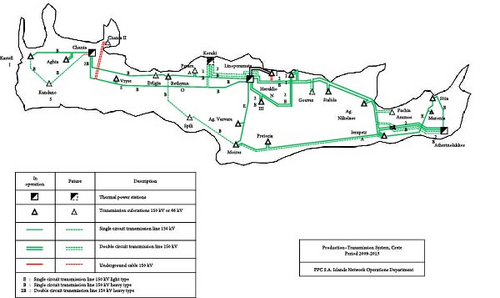
The human activity map from EMODNET is presented in Figure 14 and compiles all aforementioned significant areas and facilities. Likewise, nature-protected regions are also not suitable for placing such structures. These areas are highlighted in Figure 15 and excluded from consideration [73]. Another vital factor is assessing Crete’s current electrical grid network, schematically shown in Figure 16 from Katsigiannis et al. [3]. An electric grid network is available in most parts of the landmass but is highly concentrated and developed on the eastern part of the island.
Considering the analyzed criteria, it was decided that the most suitable location arises on the island’s eastern region, around 25 km from the nearest coast, as shown in Figure 17. The location proposed covers about 25 km2 with the center in coordinates Lat 35.0907 Lng 26.5663 and has an average water depth of 950 m, adequate to accommodate a floating structure. The mean wind velocity in this area is 11.9 m/s, and the insolation potential is also high enough to produce electricity from PV systems. Moreover, the selected location does not disturb ship routes, nature-protected areas, or other significant marine activities. The distance to the shore and the main lines of the electrical grid network is short but large enough to avoid significantly distressing the landscape for observers on the coastline. The main drawback of this location is that wave energy potential is not sufficiently high, having an average significant wave height of only 1.90 m. Hence, wave energy was discarded from the conceptual design after this first evaluation to avoid compromising the rest of the aspects and to follow the design philosophy in Figure 9. Nevertheless, as technology advances and more efficient wave energy converters appear in the market, this decision can be revisited to include this third energy source into the floating energy island.
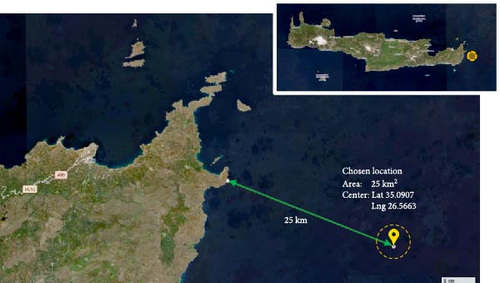
Despite both studies considering similar criteria for assessing energy potential and environmental impact, the identified suitable locations differ from those reported by Kurniawati et al. [36]. This discrepancy arises primarily due to the integration of wave energy and the imposition of water depth restrictions. Consequently, the selected locations vary between the studies.
In a previous study by Loukogeorgaki et al. [75], a location proximate to the proposed site for the energy island in this study was identified using similar criteria (Figure 18). However, the previous study focused solely on developing conventional offshore wind farms. The research encompassed a larger area, including most of the Aegean Sea, and identified 13 potential eligible marine areas (EMAs) for offshore wind developments. Notably, the sites identified as EMA12 and EMA13 are reasonably close to the selected location in this research, as shown in Figure 18. The study concluded that these two sites were the most socially accepted among the population of Greece. Additionally, nearly half of the wind farms on the island are situated in the Sitia region at its eastern end, highlighting the area’s significant wind energy potential [3].

4.2. Meeting the Energy Demand With RESs
After selecting the best location according to the parameters explained before and calculating the island’s energy demand, different technologies and infrastructure arrangements were considered to supply this demand, as shown in the following subsections.
4.2.1. Conceptual Design: Technologies and Infrastructure
Due to the relatively low wave energy potential identified in this case study, it was decided to exclude wave energy from the conceptual design of the floating island. Instead, the focus was placed solely on wind and solar energy potential. Consequently, the overall design balance thoroughly considered only wind and PV technologies.
Table 6 provides information about the efficiency, cost, and expected lifetime of the five PV models often used in solar plants. Their efficiency is significantly low, but the price is also reduced compared to commercial PV devices.
It can be observed that all presented devices have a similar efficiency of more than 20%, a price of around 0.14E/W, and a lifetime warranty of 25 years, except the First Solar panel, which has increased cost and reduced efficiency because they are optimized for usage in very hot environments, for example, in desertic regions. In the current research, it was assumed that the efficiency of PV panels is 20%, increasing the calculations’ safety factor.
Similarly, Table 7 presents five often-used models of wind turbines with a power output of 10 MW.
| Model | Capacity factor (%) | Cost (Euro/MW) | Expected lifetime (years) |
|---|---|---|---|
| GE Haliade-X 12 MW (operational at 10 MW) [81] | 63 | 4,000,000 | 25 |
| Siemens Gamesa SG 11.0–200 DD [82] | 62 | 3,900,000 | 25 |
| Vestas V164−10.0 MW [83] | 60 | 4,200,000 | 25 |
| MingYang MySE 8–10 MW [84] | 57 | 3,500,000 | 25 |
| Goldwind GW10S [85] | 58 | 3,400,000 | 25 |
The cost of these five models varies between 3,400,000 Euro/MW and 4,000,000 Euro/MW, while all models have a similar expected working life of 25 years. The capacity factor of turbines ranges between 58% at minimum and 63% at maximum, where devices with a higher capacity factor generally have higher costs.
As seen in Figure 10, the darkest areas exhibit significant wind potential, particularly those with a mean wind speed exceeding 10.0 m/s. For 10 MW Class 1 wind turbines, as specified by the IEC-61400 European Standard [86], a hub height of 119 m is required. Moreover, the corrected mean wind velocity at this height is 10.7 m/s, confirming that these locations have adequate wind potential to power 10 MW Class 1 wind turbines. Nevertheless, the availability of wind turbines was reduced to 85% to account for operational malfunctions and maintenance.
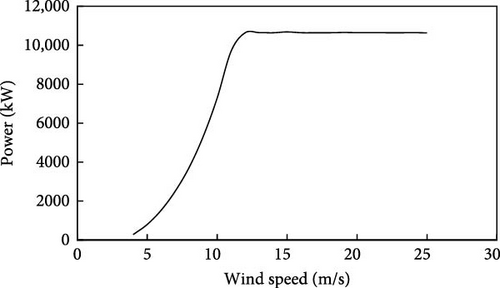
Hence, NREL-10 MW wind turbines were used as a reference for wind energy production [71]. Table 8 and Figure 19 show the specifications of the preferred turbine and its power curve, respectively. According to the power curve, the average wind speed in the selected region, shown in Figure 10, allows optimal energy production. Since the rotor diameter of a wind turbine is 198 m, the spacing between turbines on the proposed modular platform is presented as eight units of rotor diameter, according to [87, 88]. This recommendation gives 1584 m of minimum separation between wind towers.
| Item | Value |
|---|---|
| Name | IEA 10 MW RWT |
| Rated power | 10 MW |
| Rated wind speed | 11 m (s) |
| Cut-in wind speed | 4 m (s) |
| Cut-out wind speed | 25 m (s) |
| Rotor diameter | 198 m |
| Hub height | 119 m |
| Drivetrain | Direct drive |
| Control | Pitch regulation |
| IEC class | IA |
Regarding the type of PV panels, the characterization of panels must be available in harsh offshore environmental conditions. However, this study does not focus on specific solar panels since they have been recently tested for offshore conditions in the literature [89, 90].
Considering the characteristics of the wind turbines mentioned above and the approximate efficiency of PV panels assumed as 20%, a floating energy island consisting of three modules was proposed. The reduced efficiency of the PV panels is attributed to maintenance processes and potential operational errors. Therefore, we assumed this value for the optimal system. Each module will have a hexagonal shape of 6.52 km2 of area. A wind turbine will be installed on each node, and 16 wind turbines will be distributed in the three modules. The solar panels can take up to 50% of the total area and will be installed a few meters above the significant wave height to increase their survivability to extreme events. A summary of the floating island’s main characteristics is shown in Table 9 and schematically represented in Figure 20.

| Characteristics | Size |
|---|---|
| Single module area | 6.52 km2 |
| Total number of wind turbines (10 MW, 85% availability) | 16 |
| PV coverage (20% efficiency) | 53.12% |
| Total PV area | 10.39 km2 |
| Total island area | 19.56 km2 |
It is essential to highlight that the distance between wind turbines has been chosen from a very conservative point of view as eight times the diameter of the rotor. Nevertheless, it could be significantly decreased if further computational fluid dynamics (CFS) models are explored in detail.
In contrast with Kurniawati et al. [36], the structure proposed for this energy island is based on modular hexagons instead of a single octagon to enable modular systems that could be scaled and extended based on the energy demand. The hexagon shape, which also allows for triangular modularity, was chosen due to its prominent modular capacity. As nature has demonstrated, bees build their honeycombs in hexagonal shapes because they have the maximum area with the minimum perimeter and easily enlarge their constructions by adding more hexagons that fit perfectly into their colony [91, 92]. The performance of hexagonal floating shapes has also been studied experimentally in [93]. The shape of the island structure may be critical for offshore construction and maintenance conditions.
4.2.2. Expected Power Output
With the geometry and characteristics shown in the section above, the expected installed power and energy output were calculated for the arrangement of the three floating modules. As can be seen from Tables 10 and 11, the installed power is slightly below the annual peak demand. However, since the peak demand will only be present during a short period over the year, the storage systems are expected to provide the rest of the required energy and the ability to adapt to electricity production and consumption patterns to maintain the balance between supply and demand and ensure stable operation in an economically sustainable manner.
| Power type | Existing power (MW) | Proposed power from the floating island (MW) | Total (MW) |
|---|---|---|---|
| Wind | 200.3 | 117.8 | 318.1 |
| Solar | 107.4 | 465.7 | 573.1 |
| Total | 307.7 | 583.5 | 891.2 |
| Energy type | Existing energy output (GWh) | Proposed energy output from the floating island (GWh) | Total (GWh) |
|---|---|---|---|
| Wind | 574.77 | 1032.30 | 1607.07 |
| Solar | 123.42 | 4088.00 | 4211.42 |
| Total | 698.20 | 5120.30 | 5818.50 |
Despite wave energy not being considered at the moment, if the technology advances and more energy-efficient wave-energy converters are developed in the future, the platform could efficiently allocate wave-energy converters in the perimeter or interconnection of the hexagonal/triangular modules and increase the installed capacity of the floating island [94–96].
The detailed monthly calculation for the installed power and the generated electricity of the energy island is given in Table 12. As seen in Figure 21, the proposed floating energy island, in addition to the existing wind parks and PV panels, can supply the desired energy demand for Crete throughout the year. Results are similar to those obtained previously by Nikolaou et al. [97] when studying a pumped hydro energy storage system for Crete.
| Month | Wind speed index | Average wind power (MW) | Monthly wind energy production (GWh) | Average insulation (kWh/m2) | Average power (MW) | Monthly energy production (GWh) | FEI energy generation (GWh) |
|---|---|---|---|---|---|---|---|
| January | 1.03 | 144 | 107.05 | 91.4 | 255.3 | 189.9 | 297.0 |
| February | 0.92 | 115 | 77.32 | 97.6 | 301.8 | 202.8 | 280.1 |
| March | 0.83 | 86 | 63.75 | 139.0 | 388.2 | 288.8 | 352.6 |
| April | 0.85 | 92 | 66.10 | 155.3 | 448.2 | 322.7 | 388.8 |
| May | 0.79 | 74 | 54.94 | 200.5 | 560.0 | 416.6 | 471.6 |
| June | 1.01 | 142 | 102.33 | 247.3 | 713.7 | 513.9 | 616.2 |
| July | 1.44 | 145 | 108.17 | 269.2 | 751.9 | 559.4 | 667.6 |
| August | 1.36 | 145 | 108.17 | 240.9 | 672.8 | 500.6 | 608.8 |
| September | 1.03 | 144 | 103.70 | 190.6 | 550.1 | 396.1 | 499.8 |
| October | 0.90 | 108 | 80.44 | 146.8 | 410.0 | 305.1 | 385.5 |
| November | 0.88 | 101 | 72.75 | 104.5 | 301.6 | 217.2 | 289.9 |
| December | 0.93 | 118 | 87.63 | 84.2 | 235.2 | 175.0 | 262.6 |
4.3. Other Essential Aspects
4.3.1. Hybrid Energy Integration
Recently, there has been a transformative evolution in the electricity grid, and industrialized countries such as Germany and Denmark have made significant progress in increasing the share of renewable energy systems in their energy generation mix [98]. Since power generation from these sources varies with time and location, variations in power output could lead to grid instability and low reliability [99]. Thus, with the rise of RESs, the uncertainty in energy supply is shifting from consumption to production. Although the hybrid integration has been successful, especially in powering remote and small communities, the high variability in power output requires detailed planning regarding grid connections and consideration of additional storage systems to enhance reliability. So, utilizing hybrid systems that combine various sustainable sources (e.g., wind and solar) and appropriate storage systems could ensure long-term constant energy production.
Lithium-ion battery storage systems stand out among energy storage technologies tailored for offshore applications due to their flexibility, fast response times, and efficiency. Especially in island-based systems, such as Crete and Astypalaia, BESS demonstrated significant potential for maintaining stability and optimizing renewable energy penetration while minimizing fuel costs and emissions and enhancing grid reliability. However, challenges, including environmental impact for the raw material extraction as well as limited scalability for seasonal storage, which are critical in the case of Crete, remain. Alternatively, pumped hydro storage, the most cost-effective, or compressed air energy storage, and hydrogen storage provide less efficient but long-duration energy storage possibilities [100].
The integration and maintenance of any of these energy storage systems always rely on complex energy management systems that ensure optimal energy flow and account for varying demand scenarios by monitoring energy production, aligning it with immediate demand, thus minimizing wastage, managing the state of charge of storage systems to maximize their lifecycle and ensuring compliance with grid codes. Moreover, it is pivotal for providing ancillary services such as frequency regulation, reactive power support, and voltage stabilization to enhance grid reliability, particularly during peak energy demand scenarios [101].
4.3.2. Grid Connection
The integration of distributed renewable energy systems into the grid and current standards and challenges were studied in Zahedi [102], and the end-user perception issues were predominant. Unfortunately, the grid’s stability, power quality, and voltage profiles can be significantly affected by the connection to distributed generation systems (DGs), for example, floating energy islands [103]. Notably, power quality is crucial for renewable DGs because modern loads are sensitive to power quality disturbances, and the usage of renewable energy systems and nonlinear loads is steadily growing in distribution power networks [104].
All things considered, a connection request from any energy project developer needs to be followed by a rigorous grid compatibility check that includes grid expansion costs and costs of generating and transporting the energy to the grid connection point, which depends on current national sub-national policies, amongst other factors. The operation and integration of power systems should also comply with the European Union’s norms, which define a tolerance of ±10% in daily power system operations [105]. At the HV level, system operators have adopted sophisticated methods, including automatic supervisory control systems, to effectively regulate reactive power injection.
As mentioned, ~22%–25% of Crete’s energy production is renewable, with numerous projects currently underway to further increase RESs and energy storage solutions. Integrating and expanding existing supporting infrastructure would significantly reduce production costs and support the modular island’s sustainable growth. For instance, a project operated by IPTO aims to enhance the interconnection of Crete with the Hellenic Electricity Transmission System (HETS), with a double link system (150 kV AC, 2x200 MVA) interconnection between Crete and Peloponnese, including but not limited to two 135 km submarine cables and substations on both Peloponnese and Crete (the first phase of the project was completed 2021) [106]. Since 2011, IPTO has owned and operated the HETS. IPTO is responsible for the HETS’s operation, monitoring, maintenance, and development to secure a reliable electricity supply across Greece. Another project worth mentioning is a new electric interconnection between Crete and the mainland system in Attica. Greece’s largest electricity transmission project utilizes state-of-the-art voltage source converters (VSCs) technology for AC/DC conversion, with a 1GW transmission capacity link [107]. Learning from case studies and experiences nationally and internationally and extensive simulations with accurate data and exact island locations would be critical to ensure that chosen grid connection technologies and management strategies are effective and practical to deploy at a large scale, ultimately making Crete an energy-independent island.
4.3.3. Social Acceptance
A framework in [108] describes social acceptance as a product of three dimensions: socio-political, community, and market acceptance. Considering the mutual environmental policy framework for RESs and the decarbonization goals, along with the market and energy companies’ efforts toward providing more green renewable energy, achieving market acceptance and socio-political approval is realistic [109]. Besides, the new electricity connections and the energy island may bring many benefits to Crete, including integration into the wholesale electricity market, which could help lower electricity prices. Conducting surveys and structured questionnaires to collect data on public expectations can detect potential conflicts and concerns regarding the project and enhance social acceptance by engaging stakeholders, including but not limited to residents, businesses, and environmental organizations. For example, the International Renewable Energy Agency (IRENA) emphasizes that stakeholder engagement enhances transparency and ensures project alignment with community needs and values.
Furthermore, an innovative approach regarding energy storage is proposed to increase the project’s overall social acceptance. The excess energy produced would provide power to the local desalination plant by adding a local storage system to stabilize the power flow locally and avoid power export. When energy production exceeds energy demand, the excess would be utilized to produce drinking water, effectively addressing a significant issue in the local community. Researchers have already proposed and explored a wave energy converter with a small desalinization system [110]. Other energy storage systems were assessed in detail for Crete in Caralis et al. [111].
Of course, for a proper evaluation of the economic and social impacts, such as detailed job creation potentials, local energy prices, and investments, a comprehensive cost–benefit analysis would be essential but is beyond the scope of this paper.
4.3.4. Recommended Design Methodology
An energy island’s design is a multidisciplinary and complex topic that requires extensive research beyond this paper’s scope. Complex systems such as modular energy islands that combine two or more types of renewable energy harvesting devices are subjected to many factors that affect their efficiency and operability. Wind turbines are designed to withstand expected synoptic and synoptic winds. However, during 25 years of operation, the climate can significantly change, causing excess wind speeds that can negatively affect the integrity of the wind turbine structure. Offshore wind turbines are still in the research phase when talking about combined wind and water wave loading, which also contributes to the possible unexpected need for maintenance or failure of the whole turbine. Also, marine structures are subjected to various adverse effects, including corrosion, sea creature accumulation, and the need for underwater maintenance.
Comprehensive risk assessment for the proposed design is outside the scope of this work and needs to be further investigated using state-of-the-art methodologies. Recent research on the topic points out the importance of expert judgment and uncertainty study in complex systems, providing guidelines to address challenges like identifying sources of uncertainty together with ethical considerations and the need for continuous learning in social system analysis, enabling improvement of proposed models interpretability and reliability in real-world applications [112, 113].
Future research should focus on simulating energy production using detailed scenarios and real-time data specific to the exact location of the modular energy island and the identified energy sources. Additionally, it is crucial to address the energy island concept from a structural perspective to determine precise geometric requirements, materials, and mooring systems [114]. Furthermore, exploring suitable energy storage solutions and grid integration strategies remains essential for successfully implementing the energy island.
- •
Simulate energy production using detailed modeling according to the potential already identified.
- •
Study different energy storage solutions and how they can be included in the energy island.
- •
Address the energy island concept from a structural point of view to determine minimum geometric requirements, materials, and mooring system.
- •
Explore other traits that could increase the social acceptance of the project.
5. Conclusions
- •
The evaluation of Crete Island’s energy resources demonstrated significant potential for integrating different RESs, with floating energy islands appearing particularly promising for the islands’ development.
- •
The best location for the proposed floating energy island is east of Crete, which has high energy potential from wind and solar sources and no interference from existing human activities. This location is also close to ports and an electrical substation that can be used for the island’s installation, operation, and maintenance.
- •
A hexagonal shape was defined for the modular platforms inspired by the structure of a honeycomb, and previous research has proved that this shape is highly convenient in terms of modularity.
- •
Each hexagon must support up to seven wind turbines, one on each node plus one in the center. In addition, 20% of the area in the floating platform could be used to allocate solar panels and the perimeter to provide the infrastructure for wave energy converters in a future stage.
- •
A floating energy island provides flexibility that could be difficult to attain if existing islands or onshore installations were used instead. Offshore wind potential has been conventionally explored for many years. Rethinking how wind farms are constructed to take advantage of their infrastructure may be vital to increasing the energy density of such developments.
- •
Hybrid integration may be a crucial point for the success of renewable energy systems. The use of combined sustainable sources along with storage may provide the required reliability to ensure the constant supply of the system.
- •
Utilization of existing and continuous examination of new technologies depending on the authorized design of the modular island is the key to tackling the grid connectivity issue.
- •
Ensuring constant energy production, securing the storage, and detailing the structure and construction process may be some of the biggest challenges a project of this scale may encounter.
The present study highlights the current and potential status, weaknesses, strengths, and future opportunities for hybrid energy generation in Crete. According to findings, wind and solar systems are the main partners of the renewable energy islands, while wave and hydrogen integrations still need many developments. Therefore, future directions and research may be interested in providing integrated energy production and storage systems on a modular floating platform.
Furthermore, the innovative modular design proposed here enables hybrid energy systems’ scalability and flexibility, making it well-suited for future pilot projects in Mediterranean conditions similar to those of Crete. This approach also opens the possibility of providing island communities with energy independence.
Conflicts of Interest
The authors declare no conflicts of interest.
Funding
This research was supported by the following funding bodies: The European Cooperation in Science and Technology (COST), Grant No. CA20109—MODENERLANDS. The Croatian Science Foundation (Hrvatska Zaklada za Znanost), Grant No. IP-2022-10-9434 (AHEFES), awarded to the third author, Marin Ivanković.
Acknowledgments
The authors extend warm appreciation to the trainers and colleagues of the training school, particularly to Lorenzo Cappietti, Nikitas Stefopoulos, and Christabelle Vassallo. The authors acknowledge that part of this work builds upon ideas presented at the Strategic Workshop: Visions and Strategies to enhance the concept of Floating Energy Islands organized by the Cost Action CA20109 MODENERLANDS [13].
Open Research
Data Availability Statement
The data that support the findings of this study are available from the corresponding author upon reasonable request.


