Machine Learning-Driven Energy Efficiency Enhancement and Emission Reduction in Diesel Engines Using Pumpkin Seed Biodiesel Blends and CeO2 Nanoparticles
Abstract
The rising dependence on fossil fuels, depleting renewable resources, and increasing oil costs necessitate alternative energy sources. Biofuels, such as pumpkin seed biodiesel, offer environmentally friendly solutions with lower greenhouse gas emissions. This is the first study to integrate pumpkin seed oil–based biodiesel blended with cerium oxide (CeO2) nanoparticles and machine learning (ML) models for optimizing diesel engine performance and emission characteristics. The study uses response surface methodology (RSM) and XGBoost ML to maximize engine performance and predict emissions of carbon monoxide (CO), hydrocarbon (HC), nitrogen oxide (NOx), and smoke opacity. The optimal blend, achieving a brake thermal efficiency (BTE) of 24.99% with minimal emissions, was 18.32% biodiesel, 63.84% engine load (operating at 75% of maximum capacity), and 48.55 ppm CeO2. This study demonstrates the effectiveness of combining RSM and ML, providing new insights into the sustainable optimization of biodiesel blends for compression ignition engines.
1. Introduction
The development of biodiesel blends for compression ignition engines has gained significant momentum due to the global drive toward sustainable and environmentally friendly fuels, aligning with key initiatives, such as the sustainable development goals (SDGs), particularly SDG 7 (affordable and clean energy), and the broader net-zero emissions targets set by governments worldwide [1–3]. Biodiesel, derived from vegetable oils and waste biomass, is a renewable diesel fuel that produces fewer carbon monoxide (CO), unburned hydrocarbons (HCs), and particulate matter (PM) emissions during combustion [4–7]. These benefits make biodiesel a promising alternative to traditional fossil fuels, contributing to a reduction in greenhouse gas emissions and aiding efforts to mitigate climate change [8–11]. However, biodiesel’s higher viscosity, lower volatility, and reduced heating value compared to conventional diesel fuel often lead to increased specific fuel consumption (SFC) and changes in combustion behavior [12–14]. The research community has focused on optimizing biodiesel blend ratios to address performance challenges, ensure efficient operation, and minimize emissions [15–17]. Pumpkin seed oil biodiesel, in particular, has emerged as a beneficial fuel candidate, offering advantageous properties, abundant availability, and substantial environmental benefits, contributing to the global transition toward sustainable energy sources [18–21]. Further development is required to enhance combustion efficiency and improve emission characteristics, which remain critical to meeting international climate goals [22–24].
Biodiesel’s performance can be significantly improved when nanoparticles are added as fuel additives [25, 26]. Cerium oxide (CeO2) nanoparticles, in particular, have demonstrated superior catalytic properties that enhance combustion efficiency, reduce ignition delay, and lower harmful emissions [27, 28]. The oxygen-donating properties of CeO2 nanoparticles improve both air-fuel mixing quality and oxidation rates to achieve higher brake thermal efficiency (BTE) and diminished nitrogen oxide (NOx) and smoke emissions [29, 30]. Finding the perfect mix ratio between biodiesel and nanoparticle concentration is difficult as fastening the degradation of their components causes faulty measurements to create irregular combustion of engines [31]. Response surface methodology (RSM) is a widely used statistical technique for optimizing engine performance and emissions, including biodiesel blends. RSM helps explore the relationships between multiple input variables and output responses, offering efficient solutions to complex optimization problems. Recent studies have highlighted RSM’s effectiveness in optimizing biodiesel blends, engine parameters, and emission reductions, particularly when using alternative fuels like biodiesel blends and nanoparticles [32, 33]. RSM has also shown promising results in reducing pollutants and improving fuel efficiency in diesel engines fueled by biodiesel blends [34, 35]. RSM combined with machine learning (ML) models for engine performance prediction provides the solution for current challenges in biodiesel blend and nanoparticle analysis [36–38]. While XGBoost regression models coupled with other ML algorithms generate enhanced prediction accuracy by the detection of complicated nonlinear patterns, RSM serves for experimental design and parameter relationship discovery [39–41].
The research combines two performance optimization techniques through a CI engine analysis to reach maximum efficiency objectives with minimum emission results. This research aims to assess how CI engine performance and emissions respond when using blends of biodiesel from pumpkin seeds with CeO2 nanoparticle additives. The research seeks to use RSM for blend ratio optimization and ML for accurate predictions of SFC, BTE, CO, HC, NOx, and smoke emission values under various engine load and CeO2 concentration conditions. Experimental validation of the optimized fuel blend is performed using RSM and ML prediction analysis. The research establishes optimal biodiesel blend ratios together with nanoparticle concentrations to advance fuel efficiency and decrease engine emissions in CI engines, resulting in sustainable fuel alternatives with improved performance. Summary of contemporary research on biodiesel blends with nanoparticle additives compares recent studies focusing on biodiesel blends with different nanoparticle additives, as listed in Table 1, including CeO2 and cupric oxide, across various engine performance and emission characteristics. These studies provide a snapshot of the effectiveness of nanoparticle additives in improving fuel efficiency and reducing emissions in diesel engines.
| S. no. | Tested fuel | Nano additive used | Particle size | Engine performance and emission characteristics in percentage (%) | Reference paper | ||||||
|---|---|---|---|---|---|---|---|---|---|---|---|
| BTE | SFC | CO | CO2 | NOx | HC | Smoke | |||||
| 1 | Jatropha biodiesel | Cerium oxide | 20–80 ppm | 1.5↑ | — | 37↓ | — | 30↓ | 40↓ | — | [42] |
| 2 | Cerium oxide | 40–80 ppm | 6.2↑ | 4.5↓ | 29.7↓ | — | 33.6↓ | 18.75↓ | — | [43] | |
| 3 | Waste cooking oil | Cerium oxide | 40–50 nm | — | 4.51↓ | 38.8↓ | — | 18.9↓ | 71.4↓ | — | [44] |
| 4 | Diesel | Cerium oxide | 50 and 40 ppm | 6↑ | — | — | — | 30↓ | — | — | [45] |
| 5 | Diesel, ethanol, and castor oil | Cerium oxide | 30 nm | 7.9↓ | 8.7↓ | 31.8↓ | — | 54↓ | — | — | [46] |
| 6 | Calophyllum inophyllum biodiesel | Cerium oxide | 20–60 ppm | 5.4↑ | 17.6↓ | — | — | — | 14.7↓ | — | [47] |
| 7 | Ethanol and biodiesel | Cerium oxide | 10–20 g | 38↓ | 1.4↓ | — | — | 25↓ | 60↓ | — | [48] |
| 8 | Waste cooking oil | Cerium oxide | 30 nm | 32↓ | — | — | — | 30↓ | — | — | [49] |
| 9 | Waste cooking oil | Cerium oxide and aluminum oxide | 50 and 100 ppm | 11.39↑ | 13.74↑ | 15.06↓ | — | 18.29↓ | — | — | [50] |
| 10 | Waste cooking oil | Cerium oxide | 100 ppm | — | 24↓ | 30↓ | — | — | — | 52↓ | [51] |
| 11 | Waste plastic oil | Cerium oxide | 25–50 ppm | 3↑ | — | — | — | — | — | — | [52] |
| 12 | Pumpkin seed biodiesel | Cupric oxide | 25–50 ppm | — | — | 11↓ | — | — | — | — | [12] |
| 13 | Pumpkin and teak seed oil | Diethyl ether | 5% | — | — | — | 12.96↓ | 26.57↓ | 67.16↑ | 9.84↑ | [53] |
Previous studies have thoroughly documented the use of biodiesel blends, nanoparticle additives, and RSM for engine parameter optimization. However, scientists have yet to determine the optimal ratio of biodiesel blends and CeO2 nanoparticles for achieving maximum efficiency and minimizing emissions in a CI engine. While prior research has focused on individual optimization techniques like RSM or ML, there is a gap in the combined application of these methods for enhanced accuracy and optimization. Research has also shown that NOx emissions tend to increase when biodiesel blends are used, and more advanced techniques are needed to improve both engine performance and emission reductions simultaneously.
This study presents a novel approach by combining RSM and ML algorithms, specifically XGBoost, to systematically analyze biodiesel blend ratios, CeO2 concentrations, and engine load conditions for optimization. Unlike traditional research, which typically uses linear models, this study incorporates both quadratic and linear models to improve the accuracy of predictions for engine performance parameters. The optimal blend of 18.32% biodiesel, 63.84% engine load, and 48.55 ppm CeO2 yields better fuel economy and lower emissions compared to standard diesel–biodiesel mixes. The use of XGBoost regression as an ML technique offers superior predictive accuracy compared to RSM alone, resulting in a more reliable model for optimizing biodiesel blends. This is the first study to integrate pumpkin seed oil–based biodiesel blended with CeO2 nanoparticles and ML models for optimizing diesel engine performance and emission characteristics. By combining RSM with XGBoost ML, this work presents a novel approach to analyzing and optimizing biodiesel blends and nanoparticle concentrations, focusing on enhancing engine efficiency and reducing emissions. This unique methodology contributes significantly to the field by offering accurate predictions for complex engine performance and emissions parameters, such as CO, HC, NOx, and smoke opacity, making a substantial advancement toward sustainable fuel technologies.
2. Materials and Methods
2.1. Pumpkin Seed Biodiesel (Pumpkin Seed Oil Methyl Ester [PSOME])
Pumpkins rank among Cucurbitaceae plants and offer healing plus nutritious traits to human health. Pepita seeds contain about half an oil that is highly useful for biodiesel production because they contain linoleic acid and vitamin E [54]. The local market provided pumpkin seed oil that was processed through filtration to remove solid impurities. Temperature at 60°C removed water content so that the substance could proceed with the transesterification treatment [55]. The low acid content of 0.40 mg KOH/g in the oil required a base-catalyzed transesterification process as per ASTM D6751 standards (Figure 1). The filtered oil received sodium methoxide treatment when sodium hydroxide was mixed with methanol to form the sodium methoxide solution [56].
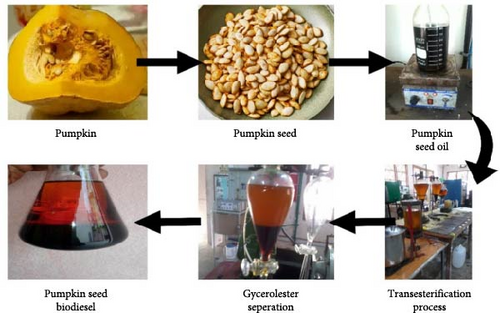
The stirring mixture heated between 55 and 66°C remained active for 1 h. The biodiesel product known as PSOME rose to the top after 24 h of settling in a separation funnel. The biodiesel underwent several water-washing steps to purify itself at a temperature of 65°C. This study filtered the product to achieve its highest possible quality. Pumpkin seed biodiesel (B100) has its physical and chemical attributes measured and compared to conventional diesel through the standard ASTM standards. Table 2 provides a comprehensive inventory of the properties of Pumpkin seed biodiesel [57].
| Property | Diesel | Pumpkin seed biodiesel (B100) | ASTM standards |
|---|---|---|---|
| Density (kg/m3) | 823.1 | 901.2 | D 1298 |
| Kinematic viscosity at 40°C (CST) | 3.9 | 5.8 | D 445 |
| Flashpoint (°C) | 57 | 174 | D 93 |
| Gross calorific value (MJ/kg) | 43.4 | 40.3 | D 240 |
| Fire point (°C) | 69 | 190.2 | D 93 |
The product needs fewer safety measures when you store and handle it because of its high ignition resistance. Higher oil viscosity affects isomethane fuel atomization quality and raises brake-SFC (BSFC), which is in line with biodiesel research.
2.2. CeO2 Additive
To improve combustion efficiency and lower pollutants, the biodiesel mixes included CeO2. Table 3 lists the CeO2 nanoparticles’ physicochemical characteristics [58].
| Properties | Values |
|---|---|
| Molecular formula | CeO2 |
| Molar mass | 172.115 g (mol) |
| Appearance | White/pale yellow solid, slightly hygroscopic |
| Density | 7.215 g/cm3 |
| Melting point | 2400°C |
| Boiling point | 3500°C |
| Solubility in water | Insoluble |
| Particle size | <25 nm |
| Crystal structure | Cubic (fluorite) |
2.3. Test Fuel Samples
The sample size for this study was determined to balance statistical power with practical considerations, such as available resources and the complexity of the experimental setup. To detect meaningful differences in engine performance and emission characteristics, four biodiesel blends were evaluated, mixed with pure diesel at CeO2 nanoparticle concentrations ranging from 35 to 55 ppm. The tested biodiesel blends included B10 (10% PSOME + 90% diesel), B20 (20% PSOME + 80% diesel), and B30 (30% PSOME + 70% diesel), along with pure diesel as a baseline. These blends were carefully tested to assess their influence on combustion characteristics, fuel efficiency, and pollutant emissions such as CO, HC, NOx, and smoke opacity, highlighting the potential of PSOME as a sustainable fuel alternative.
To ensure statistical reliability, the study employed an L27 orthogonal array design for RSM, involving 27 experimental runs [59]. This design was chosen to minimize the number of experiments while exploring the main effects and interactions of multiple variables, such as biodiesel blend ratios, nanoparticle concentrations, and engine load conditions. The 27 experimental runs (with triplicates) were determined using the Design Expert software v13 to optimize the experimental conditions efficiently [60, 61]. The use of RSM in this software allowed for a compelling exploration of the experimental space, ensuring robust and statistically significant results. This sample size aligns with prior studies, including Singh et al. [62] and Bhan et al. [50], demonstrating its adequacy for optimizing biodiesel blends and achieving meaningful findings. The experimental runs were selected based on the design of experiment (DOE) approach in Design Expert software v13, using an RSM user-defined model. This methodology helped systematically analyze the interactions between biodiesel blend ratios, CeO2 nanoparticle concentrations, and engine load conditions, ensuring the results’ reliability and reproducibility.
2.4. Experimental Setup and Procedure
The study utilized a single cylinder taken from a four-stroke DI diesel engine, together with an eddy current dynamometer for engine load control (Figure 2). The sensing equipment underwent improved technology updates for accurate measurement during the experimental procedures. The instrument used a piezoelectric pressure sensor to track both internal engine combustion and fuel flow through the delivery system. The system enabled precise measurement of pressure data correlated with crankshaft position information.
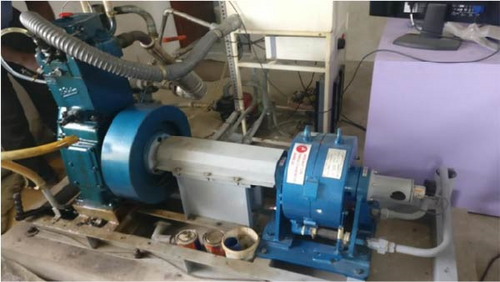
The test engine relied on a combination of a mass airflow sensor for intake air detection and a strain sensor for engine operation checks under load conditions. The tested fuel consumption resulted from the calculations performed by the fuel flow meter. The study utilized an nondispersive infrared (NDIR) technologically equipped AVL 444 DI gas analyzer to test exhaust emissions of CO, HC, and NOx. The primary purpose of the AVL 437C smoke meter is to serve during smoke testing operations. The engine testing framework functioned with data acquisition hardware for functional monitoring of combustion feedback, which verified biodiesel mixture operational precision. The table below lists the test engine specifications (Table 4).
| Parameters | Specification |
|---|---|
| Engine type | Four stroke, single cylinder water-cooled |
| Cylinder bore | 87.5 mm |
| Stroke length | 110 mm |
| Power output | 5.2 kW |
| Displacement | 661 cc |
| Speed | 1500 rpm |
| Compression ratio | 17.5:1 |
| Gas analyzer | AVL DI 444N |
| Smoke meter | AVL 437C |
| Dynamometer | Eddy current, water cooled |
| Software used | Engine soft |
Testing took place while the engine ran steadily at 50%, 75%, and 100% load levels. The system took readings after the engine established its stable mode of operation. The research conducted a structured analysis to show how mixing different biodiesel blends and CeO2 nanoparticles affects how well an engine runs and burns fuel while controlling exhaust emissions.
2.5. Experimental Uncertainty Analysis
Experimental uncertainty analysis is essential for understanding the variability in the measurements obtained during experimentation. This variability can arise due to factors, such as environmental conditions, equipment used, instrument calibration, and observation precision. The propagation of error method, as outlined by Holman [63], was used to quantify the total uncertainty. The total uncertainty was calculated using the root-sum-square method, which involves summing the squares of individual uncertainties.
This total uncertainty value of ± 2.27% represents the aggregate uncertainty in the entire measurement process.
This uncertainty analysis (Table 5) provides a comprehensive evaluation of the potential errors in the measurements. The table outlines the ranges, measuring techniques, accuracy, and error margins for each parameter involved in the experimental process.
| Parameters | Range | Measuring Technique | Accuracy | Errors (±) |
|---|---|---|---|---|
| Speed | 0–10,000 rpm | Principle of magnetic pickup | ±10 rpm | ±0.1 |
| Measurement of fuel flow | 0–500 mm | Volume-based measurement | ±0.1 cm3 | ±1 |
| Load | 0–50 kg | Strain gauge–based load cell | ±10 N | ±0.2 |
| Engine crank angle encoder | — | Principle of magnetic pickup | ±1° | ±0.2 |
| Temperature | 0–1200°C | Temperature sensing thermocouple | ±1°C | ±0.15 |
| Time | — | Stopwatch (manual) | ±0.1 s | ±0.2 |
| Pressure | 0–5000 psi | Principle of magnetic pickup | ±0.1 kg | ±0.1 |
| Deflection of manometer | 0–250 mm | Balancing the liquid column | ±1 mm | ±1 |
| NO | 0–5000 ppm | Nondispersive infrared (NDIR) method | ±12 ppm | ±0.2 |
| CO | 0%–10% vol | Nondispersive infrared (NDIR) method | ±0.02% volume | ±0.2 |
| Smoke | 0–100 HSU | Opacimeter | ±1 HSU | ±1 |
| HC | 0–20,000 ppm | Nondispersive infrared (NDIR) method | ±10 ppm | ±0.1 |
2.6. DOE and RSM
RSM within Design Expert v13 software analyzed how biodiesel blend ratio, engine load, and CeO2 nanoparticle concentration affect engine performance, together with emissions [64]. An L27 orthogonal array design structure created an efficient method to evaluate variable interrelationships while requiring a minimum number of experimental runs. Real statistics through RSM enabled researchers to produce quadratic regression equations that described engine performance indicators, including SFC, BTE, CO, HC, and NOx emissions. At the same time, smoke opacity followed a linear equation model. The statistical testing using analysis of variance (ANOVA) confirmed both statistical significance and predictive accuracy of model adequacy. The response surface, along with contour plots, delivered an enhanced understanding of how biodiesel blends operate jointly with nanoparticle concentrations in affecting combustion characteristics. The optimization through RSM determined the best operating parameters to enhance BTE and decrease SFC alongside emissions reductions to increase biodiesel-fueled CI engine efficiency.
2.7. ML–Based Prediction Models
ML was employed in this study to enhance the predictive accuracy of engine performance and emission characteristics when using biodiesel blends with nanoparticle additives [65]. Traditional methods, such as RSM, are highly effective for optimization; however, they often struggle to capture nonlinear interactions between input variables and complex output responses. ML, specifically XGBoost, was integrated to address these limitations by providing a more robust framework for modeling complex relationships in the data [66, 67]. The use of ML allows for more precise predictions of difficult-to-predict emission parameters, such as NOx, HC, CO, and smoke opacity, which are challenging to capture using linear models. Furthermore, ML models can identify patterns within large datasets that might not be apparent with conventional statistical techniques, thereby improving the overall optimization process for engine performance and emission reductions. Hyperparameter tuning with key parameters like learning rate, tree depth, and number of estimators was performed using grid search cross validation to obtain the maximum R2 score [68]. Experimental data and RSM predictions validated the trained ML model to better capture the nonlinear relationship between input parameters and engine responses. Finally, actual value vs. predicted plot, training vs. validation loss curves, and density distribution plots were created to validate the model’s performance further. By integrating ML and RSM, this study takes a comprehensive approach to optimize biodiesel combustion performance with associated emission reductions, bridging the gap between experimental research and predictive analytics.
3. Results and Discussions
3.1. Fourier Transform Infrared (FTIR) Analysis of CeO2 Nanoparticles
FTIR spectroscopy analysis of CeO2 powder generates (Figure 3) essential information about sample functional groups and chemical bonds. Multiple absorption peaks show up across the transmittance spectrum to reveal different sample vibrational modes. Organic matter on the surface and remaining HC molecules can be seen through the broad characteristic peak at 2927 cm⁻1. At 2162 cm⁻1, the spectroscopic spectrum shows a peak that suggests small amounts of carbonaceous material exist in the sample. Because CeO2 reacts with CO2 in the air, the carbonyl (C═O) and carboxylate groups show up at 1750 cm⁻1 and 1533 cm⁻1, respectively. The peaks at 1406 and 1216 cm⁻1 indicate C─O stretching vibrations on the surface that might stem from hydroxylated areas. The stretch at 1058 cm⁻1 and 815 cm–3 shows metal–oxygen bonds that show Ce─O bonds taking part in the CeO2 framework. There is a cubic fluorite CeO2, as demonstrated by the FTIR peaks at 711 and 650 cm⁻1, which are typical Ce─O stretching signals.
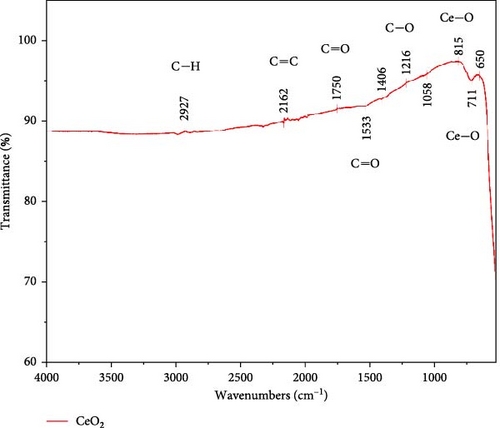
Strong peak intensities confirm how CeO2 maintains a well-defined crystal structure, together with a few structural imperfections. The FTIR analysis clearly shows that the Ce─O bonds are the most essential spectral feature. This indicates that the CeO2 nanoparticles are very pure and have their structures intact. The fact that there are minor peaks connected to surface hydroxylation and organic residues shows that the nanoparticles and their surroundings are in contact with each other. Characterization shows that CeO2 powder is chemically stable and can be used in fuels and catalysis to improve the efficiency of biodiesel blend combustion.
3.2. DOEs and RSM
Design Expert v13 software was used to create an experimental design based on RSM to investigate how biodiesel blend percentages (B10, B20, B30), engine loads (50%, 75%, and 100%), and CeO2 nanoparticle concentrations (35, 45, and 55 ppm) affect the performance and emissions of a single-cylinder, four-stroke Kirloskar TV1 diesel engine (5.2 kW, 1500 rpm). An L27 experimental design was implemented to analyze the interactive effects of these variables efficiently. An eddy-current dynamometer was used to connect the engine and test it under controlled load variations. The next part of the effort was the DOEs, which allowed for the formulation of a robust statistical model that would be able to thoroughly analyze the effect of biodiesel blend and nanoparticle doping on SFC, BTE, CO, HC, NOx, and smoke opacity. In Table 6, the experimental values of these responses are summarized.
| Exp. no. | Biodiesel blend | Load (%) | CeO2 (ppm) | SFC (kg/kWh) | BTE (%) | CO (% of volume) | HC (ppm) | NOx (ppm) | Smoke (HSU) |
|---|---|---|---|---|---|---|---|---|---|
| 1 | 10 | 50 | 35 | 0.38 | 19 | 0.029 | 45 | 471 | 19 |
| 2 | 10 | 50 | 45 | 0.36 | 21 | 0.028 | 42 | 450 | 21 |
| 3 | 10 | 50 | 55 | 0.37 | 22 | 0.027 | 39 | 426 | 24 |
| 4 | 10 | 75 | 35 | 0.34 | 23 | 0.026 | 43 | 642 | 28 |
| 5 | 10 | 75 | 45 | 0.33 | 24 | 0.024 | 40 | 625 | 32 |
| 6 | 10 | 75 | 55 | 0.32 | 25 | 0.023 | 40 | 611 | 37 |
| 7 | 10 | 100 | 35 | 0.35 | 26 | 0.034 | 55 | 733 | 38 |
| 8 | 10 | 100 | 45 | 0.34 | 28 | 0.032 | 51 | 720 | 41 |
| 9 | 10 | 100 | 55 | 0.36 | 28 | 0.031 | 52 | 708 | 43 |
| 10 | 20 | 50 | 35 | 0.36 | 21 | 0.028 | 43 | 488 | 19 |
| 11 | 20 | 50 | 45 | 0.34 | 22 | 0.026 | 40 | 470 | 23 |
| 12 | 20 | 50 | 55 | 0.35 | 23 | 0.027 | 42 | 441 | 28 |
| 13 | 20 | 75 | 35 | 0.34 | 24 | 0.025 | 41 | 645 | 32 |
| 14 | 20 | 75 | 45 | 0.31 | 26 | 0.023 | 39 | 638 | 34 |
| 15 | 20 | 75 | 55 | 0.33 | 28 | 0.024 | 42 | 627 | 36 |
| 16 | 20 | 100 | 35 | 0.35 | 27 | 0.035 | 53 | 773 | 40 |
| 17 | 20 | 100 | 45 | 0.33 | 29 | 0.033 | 52 | 752 | 43 |
| 18 | 20 | 100 | 55 | 0.34 | 29 | 0.033 | 54 | 740 | 47 |
| 19 | 30 | 50 | 35 | 0.37 | 19 | 0.027 | 41 | 536 | 24 |
| 20 | 30 | 50 | 45 | 0.35 | 21 | 0.025 | 39 | 520 | 26 |
| 21 | 30 | 50 | 55 | 0.36 | 23 | 0.026 | 40 | 512 | 29 |
| 22 | 30 | 75 | 35 | 0.35 | 23 | 0.024 | 41 | 694 | 34 |
| 23 | 30 | 75 | 45 | 0.33 | 25 | 0.022 | 38 | 680 | 37 |
| 24 | 30 | 75 | 55 | 0.34 | 26 | 0.023 | 39 | 672 | 39 |
| 25 | 30 | 100 | 35 | 0.38 | 25 | 0.036 | 55 | 795 | 43 |
| 26 | 30 | 100 | 45 | 0.36 | 28 | 0.034 | 53 | 786 | 45 |
| 27 | 30 | 100 | 55 | 0.37 | 28 | 0.035 | 54 | 761 | 49 |
3.3. RSM Modeling
3.3.1. ANOVA
3.3.1.1. Quadratic Models (SFC, BTE, CO, HC, NOx)
Table 7 presents the ANOVA results, and it is seen that the quadratic models for SFC, BTE, CO, HC, and NOx are statistically significant for engine performance and emissions predictions. All models have R2 values above 0.92, indicating a strong correlation between experimental and predicted values. The R2 values of the adjusted and predicted models also prove the reliability of the models. BTE (78%), CO (40%), HC (66%), and NOx (92%) are most affected by the engine load (B), and better fuel combustion at increased engine load results in less emissions [69]. The concentration of CeO2 nanoparticles mainly influences the BTE (15%) effects. However, emissions do not change significantly, indicating that while they improve combustion, they do not directly reduce emissions. It contributes 47% and 17% for the quadratic terms (B2 and A2). It is found that fuel consumption is nonlinear with respect to load and biodiesel blend percentage.
| Source | SFC | BTE | CO | HC | NOx | ||||||||||
|---|---|---|---|---|---|---|---|---|---|---|---|---|---|---|---|
| Sum of squares | F-value | Contribution (%) | Sum of squares | F-value | Contribution (%) |
Sum of squares | F-value | Contribution (%) | Sum of squares | F-value | Contribution (%) | Sum of Squares | F-value | Contribution (%) | |
| Model | 0.0076 | 24.64 | — | 227.44 | 109.75 | — | 0.0005 | 176 | — | 981.97 | 103.74 | — | 3.64E + 05 | 555.2 | — |
| A-biodiesel blend | 0.0002 | 5.87 | 3 | 0.3472 | 1.51 | 0 | 2.22E-07 | 0.7096 | 0 | 2.72 | 2.59 | 0 | 18,050 | 247.64 | 5 |
| B-Load | 0.0002 | 5.87 | 3 | 177.35 | 770.22 | 78 | 0.0002 | 638.61 | 40 | 648 | 616.12 | 66 | 3.35E + 05 | 4590.06 | 92 |
| C-CeO2 | 0.0004 | 10.43 | 5 | 34.72 | 150.8 | 15 | 0 | 39.91 | 0 | 12.5 | 11.89 | 1 | 4324.5 | 59.33 | 1 |
| AB | 0.0007 | 19.8 | 9 | 0.5208 | 2.26 | 0 | 0 | 52.15 | 0 | 8.33 | 7.92 | 1 | 133.33 | 1.83 | 0 |
| AC | 8.33E-06 | 0.2444 | 0 | 0.75 | 3.26 | 0 | 2.08E-06 | 6.65 | 0 | 5.33 | 5.07 | 1 | 36.75 | 0.5042 | 0 |
| BC | 0 | 0.9776 | 0 | 0.3333 | 1.45 | 0 | 3.33E-07 | 1.06 | 0 | 2.08 | 1.98 | 0 | 48 | 0.6585 | 0 |
| A2 | 0.0013 | 36.72 | 17 | 10.23 | 44.42 | 4 | 7.41E-08 | 0.2365 | 0 | 0.463 | 0.4402 | 0 | 696.96 | 9.56 | 0 |
| B2 | 0.0036 | 105.15 | 47 | 1.34 | 5.81 | 1 | 0.0003 | 823.33 | 60 | 284.74 | 270.73 | 29 | 6359.19 | 87.25 | 2 |
| C2 | 0.0013 | 36.72 | 17 | 1.85 | 8.04 | 1 | 6.69E-06 | 21.35 | 1 | 17.8 | 16.92 | 2 | 0.9074 | 0.0124 | 0 |
| Residual | 0.0006 | — | — | 3.91 | — | — | 5.32E-06 | — | — | 17.88 | — | — | 1239.1 | — | — |
| Cor total | 0.0081 | — | — | 231.35 | — | — | 0.0005 | — | — | 999.85 | — | — | 3.66E + 05 | — | — |
| R2 | 0.9288 | — | — | R2 | 0.9831 | — | R2 | 0.9894 | — | R2 | 0.9821 | — | R2 | 0.9966 | — |
| Adjusted R2 | 0.8911 | — | — | Adjusted R2 | 0.9741 | — | Adjusted R2 | 0.9838 | — | Adjusted R2 | 0.9727 | — | Adjusted R2 | 0.9948 | — |
| Predicted R2 | 0.8164 | — | — | Predicted R2 | 0.961 | — | Predicted R2 | 0.9699 | — | Predicted R2 | 0.9502 | — | Predicted R2 | 0.9907 | — |
The statistical significance of the SFC model’s F-value of 24.64 suggests that the model is robust. Biodiesel blend (3%), load (3%), and CeO2 concentration (5%) have a moderate impact, while the quadratic terms B2 and C2 significantly influence the outcome at 47% and 17%, respectively. The reliability of BTE, with R2 = 0.9831, indicates that increasing load and CeO2 nanoparticles strongly improve thermal efficiency. The F-values for CO (176) and HC (103.74) indicate that load is the main factor affecting emissions in both models. The NOx model results (R2 = 0.9966) show that load is the main factor influencing emissions, responsible for 92%, while the biofuel blend accounts for 5%. This agrees with the trend that biodiesel causes increased NOx emissions owing to its increased oxygen content. The low residual values in all models suggest that the regression equations for predicting optimal engine conditions with biodiesel are reliable.
3.3.2. ANOVA for Linear Smoke Model
The ANOVA results in Table 8 show that the Smoke Opacity model’s regression equation is statistically significant, with a high R2 value of 0.9893 and an adjusted R2 of 0.9879, indicating a strong correlation between experimental and predicted values. The F-value of 709.6 and the p-value (<0.0001) validate that the model is highly significant. Engine load (B) is the most critical factor affecting smoke formation, accounting for 86%. CeO2 nanoparticle concentration (C) contributes 8%, while biodiesel blend (A) accounts for 5%. Higher engine loads result in incomplete combustion at elevated fuel flow rates, which increases smoke emissions. Adding CeO2 nanoparticles, which help burn fuel more completely, can improve combustion efficiency and reduce smoke emissions. The low residual value (21.52) and high predicted R2 (0.9854) indicate that the model is reliable and well-fitted for predicting smoke opacity trends with various biodiesel blends and nanoparticle concentrations in a compression ignition engine.
| Source | Sum of squares | df | Mean square | F-value | p-Value | Significance status | Contribution (%) |
|---|---|---|---|---|---|---|---|
| Model | 1991.67 | 3 | 663.89 | 709.6 | <0.0001 | Significant | — |
| A-biodiesel blend | 102.72 | 1 | 102.72 | 109.79 | <0.0001 | Significant | 5 |
| B-Load | 1720.89 | 1 | 1720.89 | 1839.37 | <0.0001 | Significant | 86 |
| C-CeO2 | 168.06 | 1 | 168.06 | 179.63 | <0.0001 | Significant | 8 |
| Residual | 21.52 | 23 | 0.9356 | — | — | — | — |
| Cor total | 2013.19 | 26 | — | — | — | — | — |
| R2 | 0.9893 | — | — | — | — | — | — |
| Adjusted R2 | 0.9879 | — | — | — | — | — | — |
| Predicted R2 | 0.9854 | — | — | — | — | — | — |
3.3.3. 3D Surface Plot and Residual Analysis of Interaction Between Input and Outputs
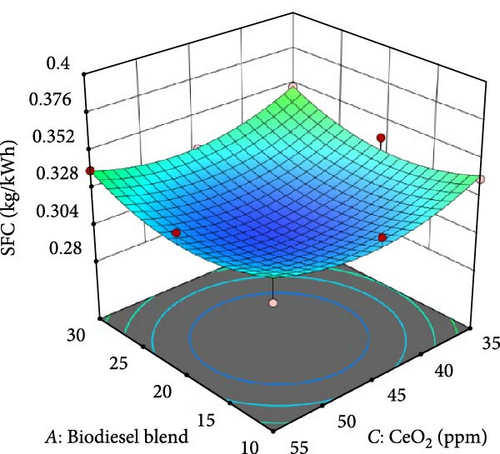
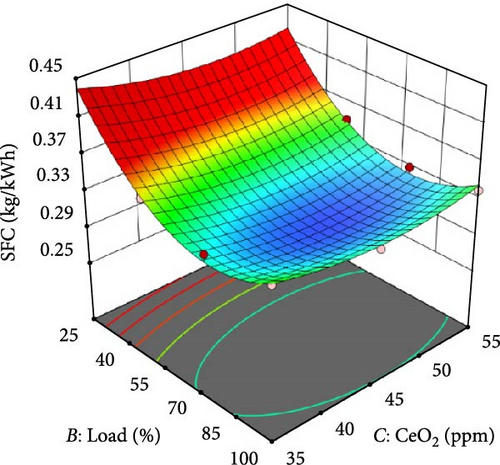
The 3D response surface plots illustrate the effect of biodiesel blend percentage, engine load, and CeO2 nanoparticle concentration on SFC. In Figure 4a, SFC is shown to decrease with an increase in engine load, as higher loads improve combustion efficiency, leading to better fuel utilization. However, at higher biodiesel blend ratios, SFC increases slightly due to the higher viscosity and lower calorific value of biodiesel compared to diesel. Figure 4b examines the interaction between biodiesel blend and CeO2 concentration, showing a reduction in SFC with increasing CeO2 nanoparticle concentration, as CeO2 acts as a combustion catalyst, improving fuel oxidation and reducing fuel wastage. Figure 4c highlights the combined influence of engine load and CeO2 concentration, demonstrating that at higher load conditions, the catalytic action of CeO2 leads to enhanced combustion, further lowering SFC.
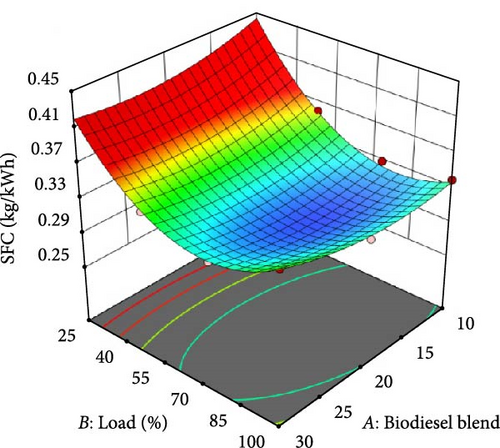
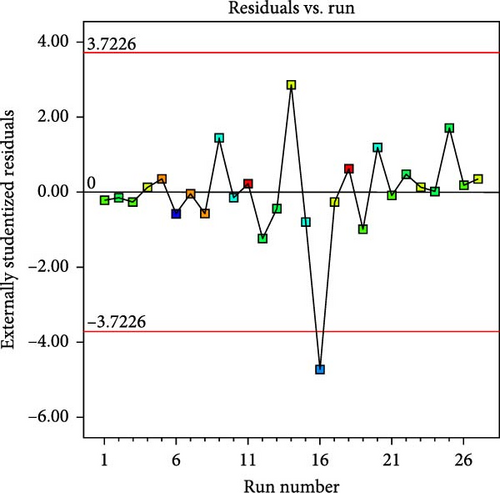
The residual plot, Figure 4d, evaluates the adequacy of the developed quadratic model. The externally studentized residuals are scattered within the acceptable limits (± 3.72), indicating no significant outliers and confirming that the model assumptions are valid. The random distribution of residuals across runs suggests that the model does not exhibit any systematic bias, ensuring its reliability for predicting SFC. These findings validate that RSM effectively captures the influence of biodiesel blends and CeO2 nanoparticles on engine efficiency, guiding the selection of optimal fuel formulations for enhanced performance.
The 3D response surface plots in Figure 5 illustrate the influence of biodiesel blend, engine load, and CeO2 nanoparticle concentration on BTE. In Figure 5a, BTE increases with increasing engine load, as higher loads improve combustion due to elevated in-cylinder temperatures and better fuel-air mixing. However, excessive biodiesel blends reduce BTE due to their higher viscosity and lower calorific value, leading to incomplete combustion.
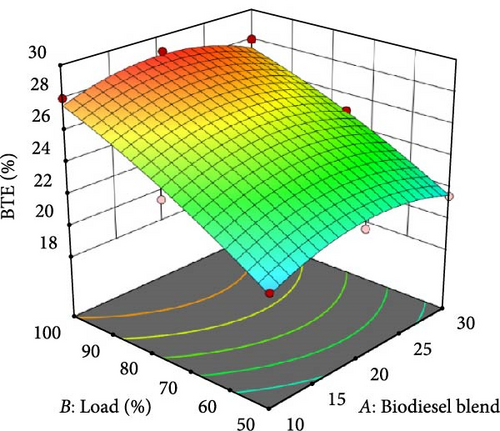
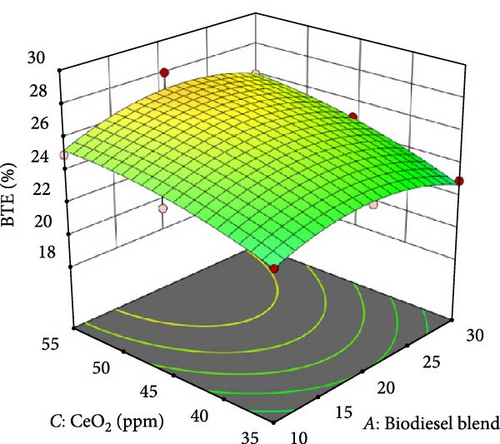

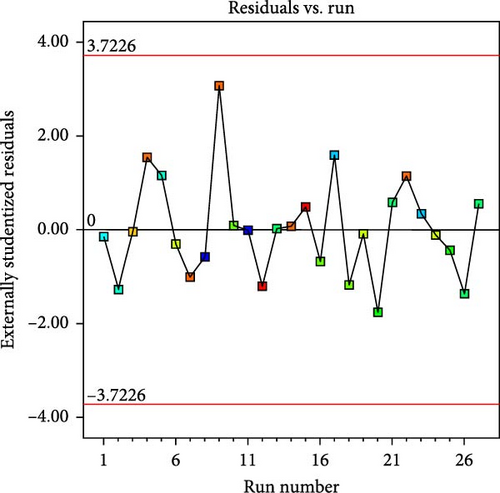
Figure 5b highlights the interaction between biodiesel blend and CeO2 concentration, showing that moderate CeO2 concentrations (45–50 ppm) enhance combustion efficiency by acting as a catalyst, resulting in better oxidation and reduced heat losses. At higher CeO2 concentrations (55 ppm), BTE slightly drops due to nanoparticle agglomeration, which can hinder uniform fuel distribution. Figure 5c examines the interaction between load and CeO2 concentration, demonstrating that at moderate load (75%) and optimal CeO2 concentration (50 ppm), maximum BTE is achieved, ensuring efficient fuel combustion with minimal energy losses. The residual plot Figure 5d validates the model’s accuracy by analyzing the externally studentized residuals. The random scatter within the control limits (± 3.72) confirms that there are no systematic biases or outliers, ensuring the model’s reliability. The uniform distribution of residuals across the experimental runs further strengthens the validity of the quadratic regression model in predicting BTE.
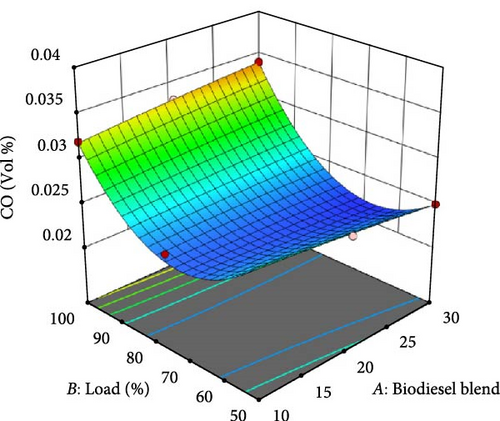
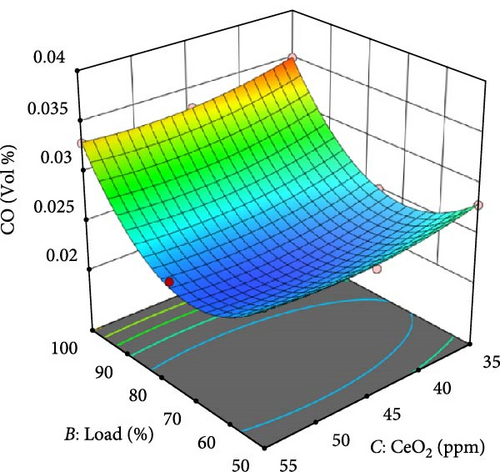
The 3D response surface plots in Figure 6 illustrate the impact of biodiesel blend, engine load, and CeO2 nanoparticle concentration on CO emissions. Figure 6a shows that CO emissions decrease as engine load increases, particularly at moderate biodiesel blends (B20). This is because higher loads improve combustion efficiency, reducing incomplete oxidation of fuel. However, excessive loads may lead to fuel-rich zones, slightly increasing CO emissions. Figure 6b highlights the interaction between biodiesel blend and CeO2 concentration, showing that increasing CeO2 concentration (up to 50 ppm) significantly reduces CO emissions due to its catalytic effect, which enhances oxidation reactions and promotes complete combustion. Figure 6c presents the impact of load and CeO2 concentration, confirming that at moderate load (75%) and optimal CeO2 concentration (50 ppm), CO emissions reach their lowest value (~0.0229%). In contrast, extreme loads and higher CeO2 levels show minor variations due to possible over-oxidation effects. The residual plot (Figure 6d) assesses the statistical reliability of the CO model by plotting externally studentized residuals against the experimental runs. The randomly scattered distribution of residuals within the control limits (± 3.72) indicates that there are no systematic errors or significant deviations in the model’s predictions. The absence of strong trends or clustering suggests that the quadratic model effectively captures the relationship between biodiesel blend, CeO2 concentration, and load on CO emissions. Additionally, the even spread of residuals across all runs ensures that the model does not suffer from heteroscedasticity or bias, confirming its robustness in predicting CO emissions with high accuracy.

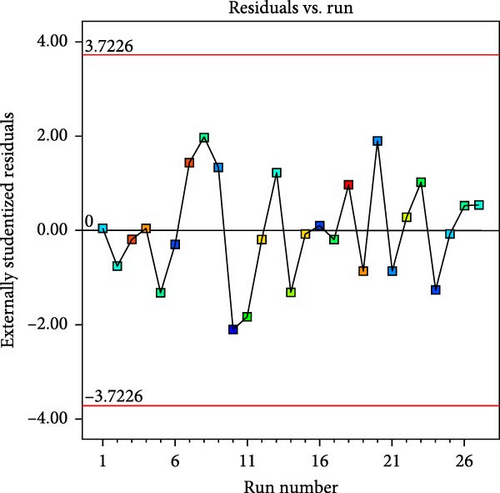
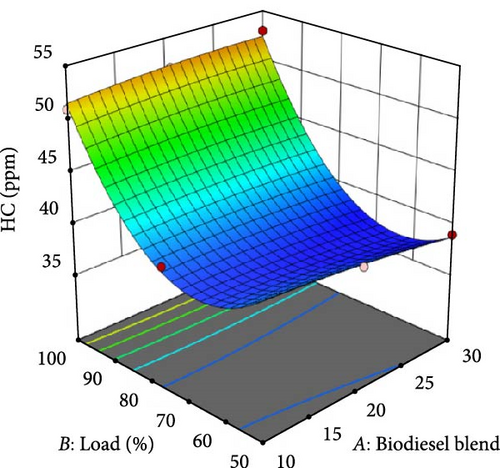
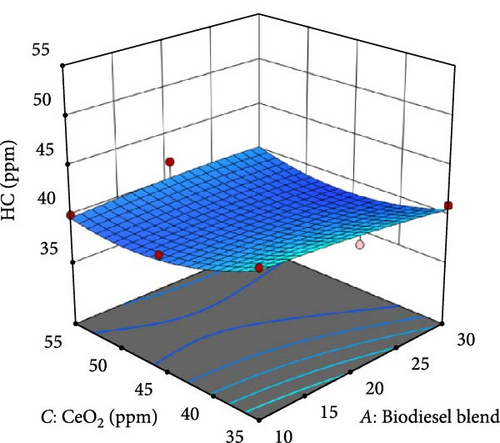
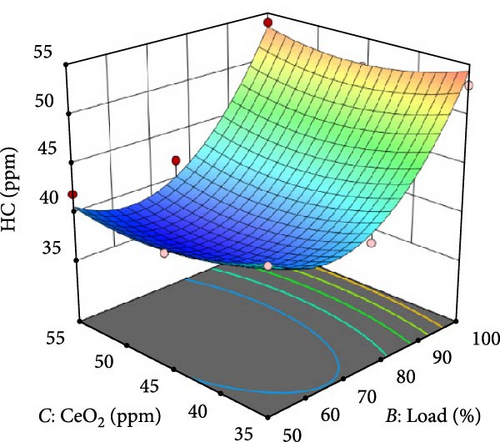
The HC model (Figure 7) presents the influence of biodiesel blend (A), load (B), and CeO2 concentration (C) on HC emissions in a CI engine. Figure 7a illustrates the interaction between biodiesel blend and load on HC emissions. At higher loads and lower biodiesel blends (B10–B20), HC emissions remain minimal due to improved combustion efficiency. However, at lower loads and higher blends (B30), HC emissions rise due to incomplete combustion caused by the higher viscosity and lower volatility of biodiesel. Figure 7b shows the effect of biodiesel blend and CeO2 nanoparticles on HC emissions. Increasing CeO2 concentration to 45–50 ppm significantly reduces HC emissions across all biodiesel blends, indicating enhanced catalytic oxidation, which improves combustion efficiency. However, at excessive CeO2 levels (>50 ppm), the reduction rate slows down, possibly due to nanoparticle agglomeration affecting fuel-air mixing. Figure 7c examines the combined effect of load and CeO2 nanoparticles on HC emissions. At lower loads, the addition of CeO2 reduces HC emissions effectively by facilitating better combustion. At higher loads (100%), HC emissions slightly increase due to higher fuel consumption, but CeO2 still mitigates incomplete combustion. Figure 7d ensures the validity of the regression model. The residuals are randomly scattered around zero, confirming that the model has no significant bias. The majority of the data points lie within the control limits, indicating that the developed HC model provides reliable predictions with minimal error.
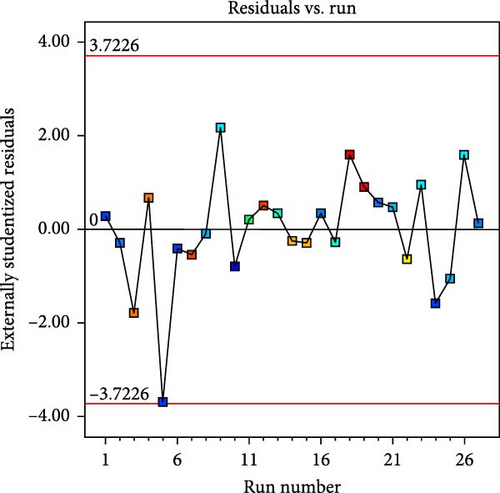
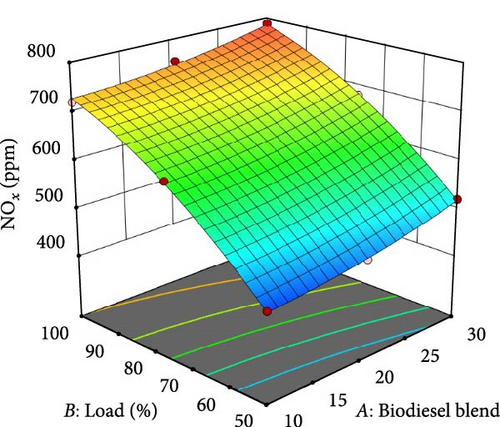
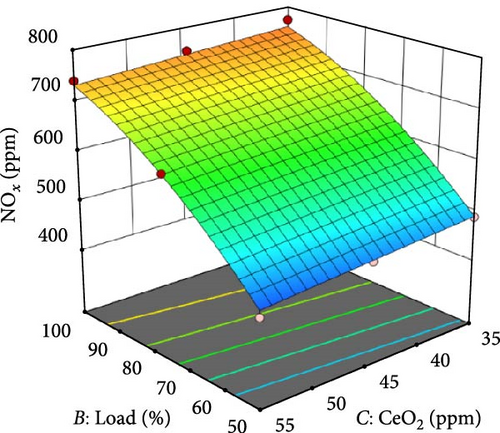
The NOx model (Figure 8) demonstrates the influence of biodiesel blend (A), load (B), and CeO2 nanoparticle concentration (C) on NOx emissions in a CI engine. Figure 8a depicts the effect of biodiesel blend and load on NOx emissions. Higher loads (90%–100%) and increased biodiesel blending (B30) result in elevated NOx emissions due to the oxygenated nature of biodiesel, leading to higher combustion temperatures. At moderate loads (75%) and B20 blends, NOx emissions are lower due to an optimal balance between oxygen content and combustion temperature. Figure 8b illustrates the interaction between biodiesel blend and CeO2 nanoparticles on NOx emissions. At higher CeO2 concentrations (45–55 ppm), NOx emissions remain relatively stable due to the nanoparticles’ catalytic effect, which enhances combustion efficiency without significantly raising temperatures. However, at lower CeO2 concentrations (35 ppm), NOx levels increase due to incomplete combustion. Figure 8c shows the combined impact of engine load and CeO2 concentration on NOx emissions. At higher loads (90%–100%), NOx emissions rise due to the higher in-cylinder temperature, despite the presence of CeO2 nanoparticles. The lowest NOx levels are observed at moderate loads (75%) and 50 ppm CeO2, as the nanoparticles aid in improving combustion efficiency while controlling peak temperatures. Figure 8d confirms the statistical validity of the NOx model. The residuals are randomly scattered, indicating the absence of systematic errors. Most data points lie within the control limits, validating the accuracy of the NOx prediction model with minimal deviations.

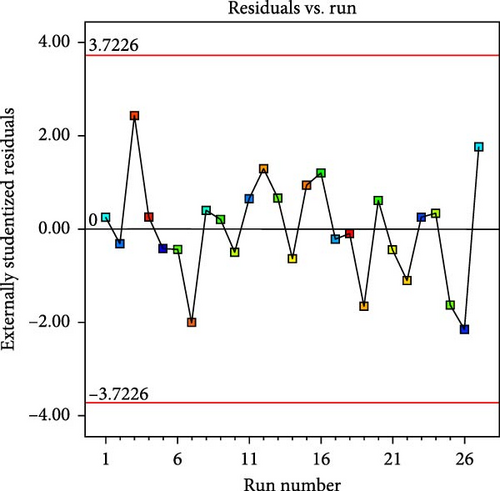
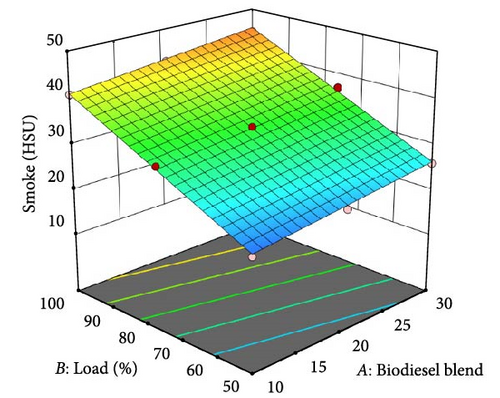
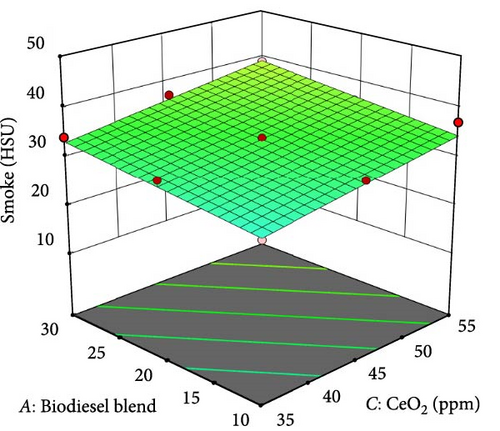
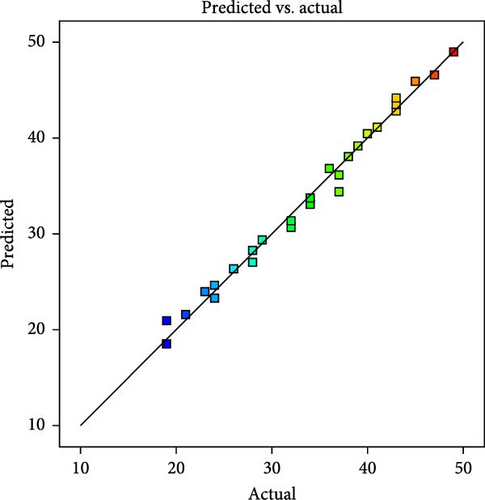
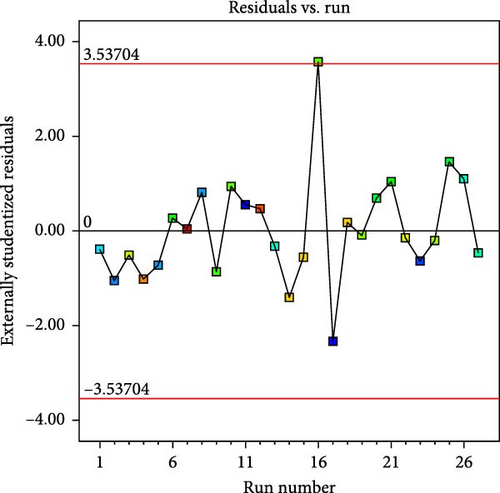
The Smoke model (Figure 9a,b) illustrates the relationship between biodiesel blend, load, and CeO2 nanoparticle concentration on smoke emissions in a CI engine. Higher biodiesel blends (B30) and increased engine load (100%) result in higher smoke opacity due to incomplete combustion, whereas B20 at 75% load shows the lowest smoke emissions (30.05 haze smoke units [HSUs]), benefiting from improved combustion efficiency. CeO2 nanoparticles further reduce smoke emissions by promoting better oxidation, with the optimal reduction observed at B20 with 50 ppm CeO2. The actual vs. predicted plot (Figure 9c) confirms strong agreement between experimental and predicted values, while the residuals plot (Figure 9d) indicates that the model maintains high accuracy with minimal deviation.
3.3.4. Input Parameter Optimization
The optimization results (Figure 10) indicate that the best combination of input parameters for achieving optimal engine performance and emission control is a biodiesel blend of 18.32%, an engine load of 63.84%, and a CeO2 nanoparticle concentration of 48.55 ppm. The desirability value of 0.959 confirms that this combination provides a well-balanced trade-off between fuel efficiency and emission reduction. The optimized SFC is 0.3197 kg/kWh, indicating improved combustion efficiency facilitated by CeO2 nanoparticles, which enhance oxidation and promote better fuel utilization. Additionally, the BTE reaches 24.99%, demonstrating an effective energy extraction from the fuel, primarily due to the catalytic effect of CeO2 and the optimal biodiesel blend ratio. The CO emissions are significantly reduced to 0.0229%, confirming that the improved combustion process results in less incomplete oxidation of fuel. Similarly, HC emissions are minimized to 38 ppm, attributed to enhanced air-fuel mixing and oxidation reactions promoted by CeO2 nanoparticles.
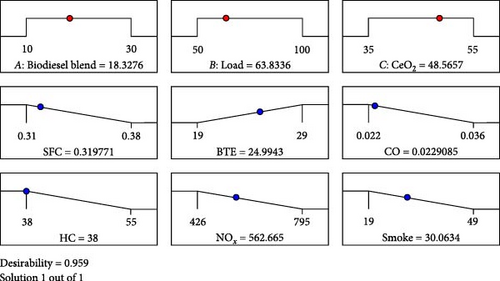
The NOx emissions are observed at 562.74 ppm, which is relatively high due to increased combustion temperatures and the oxygen-enriched nature of biodiesel, but still manageable with emission reduction techniques. Furthermore, smoke opacity is significantly reduced to 30.06 HSU, indicating better combustion with fewer unburned carbon particles. The results from optimization tests demonstrate that thermal efficiency and emissions reduction, alongside reduced fuel consumption, can be achieved when using an 18.32% biodiesel blend under moderate engine load and CeO2 nanoparticle doping. The control of NOx emissions is possible through exhaust gas recirculation (EGR) techniques and alternative after-treatment systems. Experimental findings show the potential of using biodiesel-CeO2 blends for CI engines since they offer both high efficiency and environmental friendliness in fuel solutions.
3.4. The Procedure of XGBoost Regressor for ML Prediction
Step 1. The initial phase involves loading the dataset and identifying pertinent input features. Thus, in this case, the chosen inputs are biodiesel blend (A), load (B), and CeO2 nanoparticle concentration (C). Emissions like CO, SFC, BTE, HC, NOx, and smoke are the target variables for prediction. Finally, we standardized the dataset by using a StandardScaler, which ensures that all the features have a mean of 0 and a standard deviation of 1 to improve the model’s convergence.
Step 2. Split the dataset: Before testing the model, the dataset is split into subsets, with 80% for training and 20% for testing. At this point, train_test_split is used to do so. This helps the model avoid overfitting to the training data and ensures it validates on unseen data.
Step 3. GridSearchCV: Hyperparameter tuning was performed using GridSearchCV to optimize the XGBoost regressor model and enhance its predictive performance. The tuning aimed at identifying the best hyperparameter combination to minimize mean squared error (MSE) and maximize the R2 score. In this study, the hyperparameter n_estimators (number of trees) was set between 500 and 1000 to ensure complexity without overfitting. A trial-and-error approach ranging from 0.25 to 1.0 was adopted to lessen the step size, improving model precision while balancing training speed. The maximum depth varied from 4 to 9, striking a balance between complexity and effectively capturing nonlinear relationships. This range was thoughtfully selected to optimize the model’s performance. The subsample fraction (0.25–0.65) decreased the number of samples used by the tree to enhance variance, though this came at the cost of some accuracy. To avoid redundancy, colsample_bytree was adjusted between 0.25 and 0.65 to optimize feature usage per tree. With these optimized hyperparameters, the model was trained with computational efficiency to achieve enhanced generalization capability. Table 9 shows the optimal combination of parameters, based on the lowest MSE and highest R2 score, resulting in a reliable model for predicting engine performance and emissions.
| Hyperparameters | ML output models | |||||
|---|---|---|---|---|---|---|
| SFC | BTE | CO | HC | NOx | Smoke | |
| n_estimators | 700 | 700 | 600 | 1000 | 1000 | 1000 |
| Learning_rate | 0.5 | 0.2 | 0.65 | 0.95 | 0.95 | 0.95 |
| Max_depth | 8 | 8 | 5 | 8 | 8 | 8 |
| Subsample | 0.25 | 0.4 | 0.35 | 0.4 | 0.6 | 0.65 |
| Colsample_bytree | 0.25 | 0.4 | 0.35 | 0.4 | 0.6 | 0.65 |
Step 4. After selecting the best hyperparameters through Grid Search Cross Validation, the XGBoost regressor is retrained to enhance prediction accuracy. RMSE is the key metric used to guide training, monitor model performance, and improve predictions. The model’s learning process effectively utilizes both training and testing data, preventing any risk of overfitting. Incorporating an evaluation set that encompasses both training and testing datasets ensures comprehensive training of the model. The model’s performance is carefully monitored during training over several epochs to identify when it fits optimally. The final evaluation metrics, including RMSE, MAE, and R2 Score, are listed in Table 10, providing a detailed assessment of the model’s predictive capability across different engine performance and emission parameters.
| Output models | R2 | RMSE | MAE |
|---|---|---|---|
| SFC | 0.934 | 0.0046 | 0.0032 |
| BTE | 0.9935 | 0.2405 | 0.2016 |
| CO | 0.8746 | 0.001 | 0.0007 |
| HC | 0.9682 | 0.7406 | 0.5731 |
| NOx | 0.9946 | 8.0317 | 6.0402 |
| Smoke | 0.9854 | 1.0414 | 0.8305 |
Step 5: After the XGBoost Regressor model finishes its training process, it proceeds to make predictions for the output parameter through the test data. The model reliability is measured through various performance metrics during prediction accuracy assessments. The prediction error assessment uses MAE to find the average absolute deviation between measured data and simulated values. The amount of prediction error can be measured through RMSE, and better model performance is achieved when RMSE values remain low. The prediction accuracy assessment of the model depends heavily on R2 Score metrics that determine how well the model interprets data variations, along with its significance for data interpretation. These evaluation metrics jointly confirm that the predictive model effectively duplicates complex relationships involved in biodiesel blend, load, and CeO2 nanoparticle concentration interactions with engine emission and performance parameters to ensure accurate and dependable predictions.
Step 6: Visualization of prediction performance, three key plots were made to investigate the engine performance, emission prediction accuracy, and effectiveness of the XGBoost regressor model. The actual vs. predicted scatter plot shows the relation between the predicted and actual value and a regression line that represents the closeness of the model’s prediction and actual data. If a strong linear correlation is expressed, then a well-trained model with minimum prediction error is produced. RMSE trends over training epochs are visualized by the training vs. validation loss curve so that a model converges properly without overfitting. RMSE trend that decreases in both training and validation indicates the model is learning effectively, whereas divergence can be very significant and imply overfitting or underfitting. The density plot at last compares the distribution of the actual and predicted values to see how well the model generalizes new data. The closer the fit of the expected distribution to the exact values, the more it confirms that the model has accurately recorded how the underlying patterns are present in the data. Together, these visualizations provide confidence in the use of the XGBoost model to estimate SFC, BTE, CO, HC, NOx, and smoke emission rates as a function of biodiesel blend, load, and CeO2 concentration. The predicted performance of the model is optimized, resulting in minimum prediction errors consistent with high R2 scores, and therefore, the model is a robust choice for diesel engine performance modeling.
3.4.1. Prediction Performance of ML Models
Figure 11 displays the training and validation loss trends for each output model across training epochs. These plots give clues on how the model learns, converges, and how generalizable it is. The RMSEs of both training and validation are decreasing smoothly in the SFC plot as the number of epochs increases. The loss ceases to provide meaningful insights around 350 epochs, suggesting that while the model understands the relationship between the input variables and SFC, it perceives this connection as overly generalized. RMSE decreases very quickly in the first 100 epochs and oscillates after that, which indicates that learning is effective. Good generalization is signaled by close adherence of the validation RMSE to that of the training RMSE. Following the initial decline, the RMSE demonstrates notable variability in the predictions for CO and HC. The HC model achieves stable RMSE values of about 0.0015 after 500 epochs. In contrast, the HC model shows more significant fluctuations, indicating more complex relationships between input parameters and HC emissions that require further fine-tuning.

The study finds a notable drop in loss in the NOx model within the first 200 epochs, when it stabilizes at regularly low values paired with a low RMSE. This model has impressive foresight. The Smoke model also shows a significant drop in the first 100 epochs, then a point of equilibrium. All these patterns confirm the assumption that the XGBoost model makes efficient use of the available data. For every model, the slight variation in RMSE between training and validation reveals no overfitting, achieves optimum epochs, and generates strong prediction accuracy for engine performance and emissions.
Actual and predicted data points from the tested XGBoost regressor model demonstrate (Figure 12) its prediction ability for output parameters, and R2 values on these plots indicate the accuracy level. Hence, the closer value to 1.0 reflects better prediction accuracy. The SFC prediction through the model exhibits a high level of accuracy based on its R2 value of 0.934. The overlapped points along the regression line verify the model’s reliability for predicting fuel consumption trends. The BTE model displays remarkable performance because its R2 exceeds 0.993, marking a near-perfect accuracy level. The compact grouping of data points near the regression line shows the model’s capability to represent the connection between biodiesel blend, load, CeO2 concentration, and thermal efficiency. An R2 value of 0.875 indicates a robust correlation according to the CO prediction model, despite its slightly increased distribution between points. The predictive accuracy demonstrated by the HC model is exceptional because its R2 value reaches 0.968, while the linear regression line closely fits most observer points.
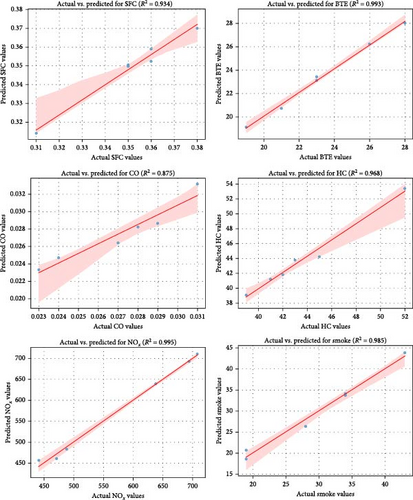
The NOx model displays an exceptional R2 value of 0.995 that verifies its capability to predict nitrogen oxide emissions accurately because these emissions strongly respond to combustion conditions. The results obtained from the Smoke show that predictions reach an R2 value of 0.985, indicating the model provides high accuracy in its predictions. These research findings demonstrate that XGBoost regressor successfully recognizes the nonlinear behavior between input variables, which leads to highly dependable predictions for all performance/emission characteristics of the engine. The slight discrepancy in predictive capabilities demonstrates why this model should be used for performance modeling biodiesel-based CI engines.
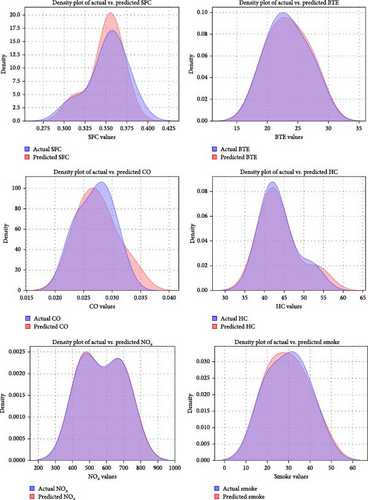
A visual assessment of the XGBoost model performance emerges from density plots, which display actual and predicted model output distributions (Figure 13). The distribution patterns identified by the model stay faithfully matched with actual values through the proximity of blue (actual) and red (predicted) distributions displayed in most plots. The actual and predicted values for SFC, BTE, NOx, and Smoke exhibit a close alignment, which indicates high prediction reliability. Most prediction errors are small enough not to affect the general trend patterns visible between actual values and predicted values for CO and HC data. The NOx distribution pattern with two peaks demonstrates accurate alignment of actual values and expected outcomes, thus demonstrating excellent model performance. These density plots show how closely the XGBoost Regressor determines reliable diesel engine performance and emission values within both biodiesel blends and CeO2 nanoparticle conditions.
3.5. Validation of ML and RSM With Experimental Value
Both experimental data and predictive values from ML and RSM are visually compared as bar graphs (Figure 14) for all output parameters. The predictions from both ML and RSM closely followed experimental findings, which confirms their strong predictive accuracy. SFC predictions demonstrate consistent accuracy because their predicted output value (0.319) closely matches experimental (0.319) and both ML (0.32) and RSM (0.323) predictions show very close results when compared to experimental data. The experimental value at optimal conditions matches closely with BTE predictions, which display minimal variations (experimental: 24.99%, ML: 25.15%, and RSM: 25.05%).
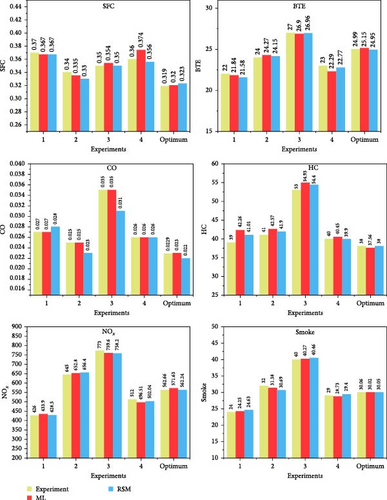
The measurement methods show accurate performance through emission parameter evaluation. Test results matched with predicted CO emissions values from the experiment to be 0.0229%, 0.023%, and 0.022% through ML and RSM tables, thus showing the minimal discrepancy. Experimental tests confirmed the optimal HC emissions values as highly effective forecasters, while validating these results yielded experimental: 38 ppm, ML: 37.56 ppm, and RSM: 38 ppm. The measurement reliability of both prediction techniques was verified through the matching NOx emission outcomes, which occurred at the optimum operating points (experimental: 512 ppm, ML: 502.94 ppm, and RSM: 512.66 ppm). The prediction tests performed at optimum conditions yielded outstanding accuracy agreement with the experimental results being 30.06 HSU, the ML results being 30.02 HSU, and the RSM results being 30.05 HSU.
Predictions of engine performance through ML and RSM models show excellent accuracy, thus demonstrating their fitness for optimization studies in engine systems. High-performance results from ML–based models exceed those from RSM in some instances because of their strong capacity to identify complicated nonlinear relationships. These optimization parameters derived from RSM generated results identical to those verified by ML for boosting engine performance and emission reduction, which shows that these approaches succeed in diesel engine research.
Table 11 shows the average absolute error percentage of ML and RSM prediction results against experimental measurements for SFC and all other output parameters (BTE, CO, HC, NOx, and smoke). This error provides insight into the accuracy and reliability of the predictive models, calculated using the formula (8):
| Percentage of error | SFC | BTE | CO | HC | NOx | Smoke | ||||||||
|---|---|---|---|---|---|---|---|---|---|---|---|---|---|---|
| Biodiesel blend | Load (%) | CeO2 ppm | ML | RSM | ML | RSM | ML | RSM | ML | RSM | ML | RSM | ML | RSM |
| 10 | 50 | 55 | 0.838 | 0.882 | 0.727 | 1.894 | 0.741 | −2.442 | −8.359 | −5.150 | −1.854 | −0.597 | −1.042 | −2.623 |
| 20 | 75 | 35 | 1.588 | 2.816 | −1.125 | −0.622 | −0.800 | 7.779 | −3.829 | −2.253 | −1.209 | −1.768 | 1.938 | 4.109 |
| 20 | 100 | 35 | −1.057 | 0.175 | 0.359 | 0.141 | 1.429 | 11.267 | −3.642 | −2.633 | 1.734 | 1.917 | −0.675 | −1.157 |
| 30 | 50 | 55 | −4.000 | 1.008 | 3.087 | 0.967 | 0.385 | −0.109 | −1.125 | 0.261 | 3.025 | 1.944 | 0.931 | −1.405 |
| 18.32 | 63.8 | 48.56 | −0.157 | 0.297 | −0.652 | 0.152 | 0.961 | 3.476 | 1.158 | 0.003 | −1.594 | 0.042 | 0.133 | 0.044 |
| Average absolute error | −0.558 | 1.036 | 0.479 | 0.506 | 0.543 | 3.994 | −3.159 | −1.955 | 0.020 | 0.308 | 0.257 | −0.207 | ||
The prediction errors established by ML alongside RSM methods demonstrate low percentages in every output parameter analysis. The predictive accuracy of ML surpasses RSM by demonstrating an average absolute error rate of 0.558% for SFC, while RSM shows a 1.036% error rate for SFC. The BTE predictions from ML (0.479%) surpass RSM (0.506%) because ML demonstrates a better ability to detect nonlinear behavioral patterns. The prediction of emissions yields better results through ML since ML calculates lower error rates for CO (0.543% vs 3.994%) and HC (3.159% vs 1.955%) compared to RSM. The predictions for NOx and Smoke from both ML and RSM match exceptionally well with error percentages at 0.020% and 0.308% for ML and 0.257% and 0.207% for RSM, respectively.
Results show that, while handling challenging emissions data, the prediction errors from the ML model remain below the RSM model errors, indicating higher accuracy. Different methods perform closely to each other in practice, thus confirming their effective use together. The research shows how ML teamed up with RSM to optimize biodiesel blend with CeO2 nanoparticles while demonstrating the strengths of RSM in experimental condition determination and ML’s advantage in accurate predictions. The dual method produces reliable optimization techniques that promote sustainable biodiesel use and efficient operation of CI engines.
The performance and emission results from this study were compared with those from various recent studies in the literature. This study’s findings showed that the optimal biodiesel blend of 18.32% biodiesel, 63.84% engine load, and 48.55 ppm CeO2 resulted in a 24.99% BTE and a 0.3197 kg/kWh SFC, which aligns with similar studies using CeO2 as a nanoparticle additive. For instance, Khanam et al. [49] found significant performance improvements with CeO2 nanoparticles, reporting a 32% increase in BTE with a 30% reduction in NOx emissions when using waste cooking oil biodiesel blends. Bhan et al. [50] also reported improvements in engine performance with CeO2 and aluminum oxide additives, achieving 11.39% BTE and emission reductions for CO2 and NOx. In contrast, our study achieved higher emission reductions for NOx (562.74 ppm) and smoke (30.06 HSU) compared to these studies. Additionally, the ML model in this study outperformed RSM in predicting complex emission characteristics, a finding consistent with Şahin [12], who demonstrated the superior predictive capability of ML models for biodiesel emissions. These comparisons highlight the efficacy of combining CeO2 nanoparticles with biodiesel in optimizing engine performance and reducing emissions.
4. Conclusions
- •
The optimal biodiesel blend was found to be 18.32% biodiesel, 63.84% engine load, and 48.55 ppm CeO2, resulting in a desirability score of 0.959.
- •
Under these conditions, the engine displayed significantly improved emissions and performance, with CO at 0.0229%, HC at 38 ppm, NOx at 562.74 ppm, smoke at 30.06 HSU, and SFC at 0.3197 kg/kWh.
- •
The ML model surpassed RSM in predicting complex emission characteristics, showing lower average absolute errors across several key performance metrics, including SFC (0.558% vs. 1.036%), BTE (0.479% vs. 0.506%), CO (0.543% vs. 3.994%), HC (3.159% vs. 1.955%), NOx (0.020% vs. 0.257%), and smoke (0.257% vs. 0.207%).
- •
Both ML and RSM techniques demonstrated strong agreement with experimental results, confirming the reliability of the predictive models and their effectiveness in optimizing engine performance.
- •
The integration of RSM and ML successfully optimized biodiesel blend parameters, leading to improved fuel economy and a significant reduction in hazardous emissions. This further supports the feasibility of pumpkin seed biodiesel as a sustainable alternative fuel.
In conclusion, this study underscores the potential of pumpkin seed biodiesel combined with CeO2 nanoparticles as an environmentally friendly fuel solution. The RSM and ML models proved effective in optimizing engine performance and reducing emissions. Future studies could focus on other biodiesel sources, investigate long-term engine performance, and explore advanced ML models, such as deep learning, to further enhance prediction accuracy. Additionally, research on other nanoparticle additives, like Al2O3 and TiO2, as well as detailed environmental and economic analyses through life cycle assessments (LCAs), would be valuable to assess the broader sustainability and cost-effectiveness of biodiesel blends for large-scale applications.
Nomenclature
-
- TFC:
-
- Total fuel consumption
-
- BTE:
-
- Brake thermal efficiency (%)
-
- BP:
-
- Brake power
-
- BSFC:
-
- Brake specific fuel consumption
-
- SFC:
-
- Specific fuel consumption (kg/kWh)
-
- CO:
-
- Carbon monoxide (% by volume)
-
- HCs:
-
- Hydrocarbons (ppm)
-
- NOx:
-
- Nitrogen oxides (ppm)
-
- HSUs:
-
- Haze smoke units
-
- RSM:
-
- Response surface methodology
-
- ML:
-
- Machine learning
-
- XGBoost:
-
- Extreme gradient boosting
-
- CeO2:
-
- Cerium oxide nanoparticles (ppm)
-
- PSOME:
-
- Pumpkin seed oil methyl ester
-
- B10:
-
- 10% Biodiesel + 90% diesel
-
- B20:
-
- 20% Biodiesel + 80% diesel
-
- B30:
-
- 30% Biodiesel + 70% diesel
-
- ppm:
-
- Parts per million
-
- kWh:
-
- Kilowatt hour
-
- g/m3:
-
- Grams per cubic meter
-
- cm3:
-
- Cubic centimeter
-
- mg:
-
- Milligram
-
- L:
-
- Liter
-
- g/mol:
-
- Grams per mole
-
- ANOVA:
-
- Analysis of variance
-
- RMSE:
-
- Root mean square error
-
- MAE:
-
- Mean absolute error.
Ethics Statement
No human participants or animals were involved in this study, ensuring compliance with ethical research standards.
Disclosure
The research focuses solely on material synthesis, characterization, and computational modeling.
Conflicts of Interest
The authors declare no conflicts of interest.
Author Contributions
Shaisundaram V. S.: experimental work, investigation, materials. Saravanakumar Sengottaiyan: software, machine learning, writing–original draft. Gunasekaran Raji: optimization, validation. Kumaravel S.: experimental testing, writing–original draft. Chandrasekaran M.: research administration, methodology. All authors have approved the submission.
Funding
There are no funding sources for this research work.
Open Research
Data Availability Statement
The Python code used for machine learning predictive modeling is available upon reasonable request.


