Assessing the Economic Impacts of Net Metering on Residential Solar Photovoltaic Adoption: A Palestinian Case Study
Abstract
This research evaluates impacts of net metering on residential photovoltaic (PV) adoption in Palestine, focusing on PV systems ranging from 2 to 5 kWp. The analysis considers key factors such as energy generation, self-consumption, self-sufficiency, and economic viability, with PV coverage meeting an annual demand of 6378 kWh. Under the current net-metering scheme, 10% discounted of exported energy, and unused energy is forfeited at year end. The 2 kWp system generated 3405 kWh annually, achieving a self-consumption rate of 63% and covering 35% of household energy needs. Conversely, the 5 kWp system produced 8514 kWh but exhibited a lower self-consumption rate of 31% and a self-sufficiency rate of 43%. In terms of economic performance, the 2 kWp system delivered the highest internal rate of return (IRR) at 23.60% and a discounted payback period (DPP) of 4.95 years. Meanwhile, the 3 kWp and 4 kWp systems demonstrated IRRs of 23.1% and 22.76%, with DPPs of 5.07 and 5.15 years, respectively. Although the 4 kWp system had a higher net present value of $5,626.8 compared to $2968.2 for the 2 kWp system, the latter remained more efficient with a higher IRR of 23.60%, vs. 22.76% for the 4 kWp system, suggesting that the 4 kWp system offers greater overall profit, but the 2 kWp system yields better returns on investment. Nevertheless, the 5 kWp system, despite generating the most energy, had the lowest IRR at 16.72% and the longest DPP of 7.20 years due to discounted and forfeited credits at year end. Therefore, the study recommends that households install PV systems closely aligned with their energy consumption to maximize self-consumption.
1. Introduction
As global energy demand continues to rise, the depletion of fossil fuels has become an increasing environmental and economic concern [1, 2], and this trend is expected to persist. Consequently, developing sustainable energy sources is becoming increasingly essential. Due to declining costs and improved performance, photovoltaic (PV) systems have seen significant growth. In 2022, the output from PV systems increased by 26%, ranking as the fastest-growing source among renewable energy technologies [3].
Distributed generation (DG) is reshaping the electricity generation landscape. Unlike conventional power plants, which require large distances from population centers, high-cost infrastructure, and pose reliability concerns along with polluted emissions [4, 5], DG units are located near electrical loads which reduces the current that must be transmitted through distribution lines, thereby reducing electrical losses in distribution networks [6]. Moreover, DG enhances grid stability and improves voltage profiles. Additionally, DG offers capital savings, as the construction of large centralized power plants can be avoided. Moreover, at optimal levels, DG can enable consumers to generate surplus electricity and sell it back to the grid, becoming prosumers [7]. However, excessive penetration of DG systems complicates grid management due to the variability of both power generation and load demand. When generation reaches its maximum while load is at its minimum, challenges arise, including regulating power flows, preventing reverse power flow, and maintaining grid stability. This transition from unidirectional to bidirectional electricity flows presents one of the most significant challenges in modern power systems, particularly with the rapid growth of solar PV installations [8]. Several methods have been developed to solve this issue. One approach is to encourage self-consumption, where consumers use the electricity they generate instead of exporting it to the grid. This reduces reverse power flows and, consequently, minimizes the potential for voltage instability issues [9]. Additionally, self-sufficiency, or the ability to meet energy needs independently of the grid, has been proposed as a way to reduce dependence on main grid. Therefore, developing efficient billing. According to the National Renewable Energy Laboratory (NREL) [10], regulation mechanisms are specifically designed to reward owners of DG systems for the electricity they export to the grid. As more DG units are installed, establishing effective regulation mechanisms will be crucial for ensuring the PV systems are integrated efficiently and equitably into the grid [11].
Regulation mechanisms such as feed-in tariffs (FiTs) were initially introduced to promote the installation of DG systems when their costs were prohibitively high [12]. FiTs have played a crucial role in increasing renewable energy adoption by offering fixed payments for the electricity produced and fed back into the grid. However, as FiTs became more widespread, technical challenges previously mentioned especially in periods of excess generation and low demand [13]. This occurs because users with FiTs are not incentivized to match their consumption with their generation. These conditions have complicated grid management, sometimes requiring inverters to be switched off to prevent injected more power in case high voltage rise. Therefore, the growing adoption of PV systems has led to regulatory changes aimed at addressing these challenges [14].
Thereafter, mechanisms such as net metering were developed to address these issues [15]. Net metering allows consumers to sell excess electricity produced by their PV systems back to the utility to offset the energy they consume from the grid. This fosters self-consumption and reduces electricity bills [16]. This scheme designed to maximize the benefits of DG while maintaining grid stability.
Energy security in Palestine is highly critical. Meanwhile, ~90% of the electricity consumed is purchased from outside suppliers—mostly from the Israeli Electricity Company, and in minor portions from Jordan and Egypt [17]. This huge dependence, nevertheless, places the region under continuous risk of disruptions in supplies and price fluctuations, setting serious obstacles to sustainable development [18]. Despite these difficulties, Palestine enjoys rich solar resources with more than 3000 h of sunshine per year and daily average solar radiation of 5.4–6 kWh/m2/day and annual PV system yield of 1700 kWh/kWp [19]. Therefore, solar energy has become the most promising renewable energy source. Its development, however, faces other challenges in terms of geopolitical constraints, including regulatory hurdles and the fact that Area C, occupying 60% of the West Bank, is still under Israeli control. These economic, geopolitical, and social challenges, therefore, pose significant implications for renewable energy development within Palestine. For instance, limited access to Area C restricts large-scale renewable energy projects, while political instability, nevertheless, hampers long-term planning.
These challenges contrast sharply with the success of neighboring countries such as Jordan and Morocco, where similar solar potential has been effectively leveraged through international investments and robust regulatory frameworks [20]. To further promote renewable energy, use in Palestine, the Palestinian Energy Authority (PEA) issued a renewable energy strategy aimed at generating 130 megawatts of electricity from renewable sources by 2020. By the end of 2021, the total capacity of PV systems had reached 178.5 megawatts, with annual PV production representing 10.5% of total electricity production.
As shown in Table 1, this capacity is distributed among various electricity distributors across the country, with the Jerusalem Electricity Distribution Company accounting for 37.86 MW, the Gaza Electricity Distribution Company contributing 18.98 MW, and municipalities and local councils providing 84.38 MW, among others. This achievement highlights the success of the renewable energy strategy and underscores the growing significance of solar energy in Palestine’s energy landscape [21]. Notably, local municipalities contributed 84.38 MW, most of which is located in Area C. Despite the challenges associated with zoning divisions in the Palestinian territories, their impact on the residential sector is relatively minor, as Palestinians often utilize their rooftops to install PV systems tailored to meet their household energy consumption.
| Electricity distributor | PV capacity (MW) |
|---|---|
| Northern Electricity Distribution Company | 11.88 |
| Tubas Electricity Distribution Company | 11.00 |
| Jerusalem Electricity Distribution Company | 37.86 |
| Hebron Electricity Distribution Company | 8.48 |
| Southern Electricity Distribution Company | 5.90 |
| Gaza Electricity Distribution Company | 18.98 |
| Local Municipalities not under the main distribution companies | 84.38 |
| Total | 178.5 |
Conversely, in areas with high energy demand, such as those with significant commercial and industrial activities or large residential complexes, the high cost of land further complicates the adoption of ground-mounted PV systems. These factors make the installation of rooftop solar panels on individual homes one of the most viable and effective approaches for promoting solar energy adoption.
The electrical legislation issued by the Palestinian Authority is unified across all regions, regardless of the classification of the area. This legislation is enacted by law and directed to distribution companies as well as local councils, which are responsible for electricity distribution, regulation, and price collection. The focus of this paper is on legislation related to residential systems, which is also unified. Initially, the PEA encouraged households to adopt solar panels through an initiative that allowed the first 1000 homes to use FiT and install 5 kWp PV systems. This regulation enabled users to sell their generated energy directly to the grid at favorable prices, which was particularly important when PV system costs were high.
Additionally, this initiative helped create a local market for PV systems by fostering the establishment of new companies specializing in solar energy. Socially, it raised awareness among the public through success stories that demonstrated the viability and benefits of solar PV systems. Over time, solar PV installations expanded significantly due to the sharp reduction in PV system costs. Following this initial experiment and after thorough evaluation, distribution companies observed a decrease in revenue due to reduced electricity consumption, coupled with ongoing costs for billing and grid maintenance.
As a result, the PEA transitioned to a net-metering system, which was introduced in 2015 and updated in 2020. This system plays a critical role in promoting solar energy adoption in Palestine.
The net-metering scheme allows consumers to generate electricity, export surplus energy to the grid, and receive credits to offset future consumption. This mechanism not only supports grid stability but also incentivizes investment in PV systems and enhances the overall system load factor [22]. Under the net-metering framework, consumers are equipped with bidirectional meters that track both imported and exported energy. The earlier version of the net-metering scheme in Palestine, as discussed in [23], focused on evaluating the initial implementation of the system and its impact on solar energy adoption and grid operators. This version calculated the net difference between imported and exported energy, applying a 25% deduction on the positive value of export-minus-import credits between months, with annual reconciliation. However, the study primarily addressed the regulations in effect at that time and did not account for the revised policies introduced in 2020. Moreover, Biancardi et al. [24] analyzed a 5 kW residential PV system in Palestine, demonstrating that baseline scenarios under net metering consistently result in positive net present values (NPVs). This finding underscores the critical role of net metering in ensuring the economic viability of PV systems and its contribution to achieving Sustainable Development Goal 7. While these studies highlight the economic advantages of net metering, they often oversimplify its mechanisms, providing limited insights into the broader systemic and regulatory implications of net metering in the Palestinian context. Furthermore, they lack actionable recommendations to optimize the benefits of the system.
To the best of the author’s knowledge, this study represents a pioneering effort to analyze recent regulatory changes in net metering, specifically the export discount and the forfeiture of unused energy at the end of the year, and their implications for self-consumption and self-sufficiency. The updated net-metering scheme is applied to evaluate energy credited and debited from households, along with monthly balances. Economic performance is assessed using financial metrics such as NPV, internal rate of return (IRR), and discounted payback period (DPP). The study examines a typical residential consumer’s energy consumption and solar energy potential over a year, focusing on how varying net-metering policies impact the financial viability of PV systems of different capacities. Additionally, a sensitivity analysis accounts for variations in parameters such as energy prices, system costs, and solar radiation. The findings culminate in practical recommendations based on simulation results, providing insights into the financial and operational feasibility of PV systems under the updated net-metering policy in Palestine.
2. Methodology
- •
Data collection: Evaluation of household energy consumption patterns using real measured data to establish the monthly and hourly demand profiles.
- •
PV Power Estimation: Calculation of energy generation for four PV system capacities (2 kWp, 3 kWp, 4 kWp, and 5 kWp) using HOMER Pro software to simulate hourly PV output based on solar radiation data.
- •
Simulation of PV-Grid Interaction: Hourly simulations of PV generation and load demand to determine the energy imported from and exported to the grid.
- •
Performance Metrics: Calculation of self-consumption and self-sufficiency metrics to assess the effectiveness of different PV system sizes in meeting household energy needs.
- •
Net-Metering Implementation: Application of the updated net-metering scheme, including deductions for exported energy and forfeited year-end balances.
- •
PV Utilized Energy Calculation: Determination of the energy effectively used by the household, excluding deductions and forfeitures.
- •
Economic Analysis: Assessment of system feasibility using financial metrics such as NPV, IRR, and DPP.
- •
Sensitivity Analysis: Investigation of how variations in key parameters (electricity prices, interest rate) affect the financial and operational outcomes.
2.1. Study Area
A typical Palestinian household is selected for the case study. 1 year of hourly load data is gathered to ensure accurate representation of consumption across different seasons. Additionally, solar radiation and temperature data for a complete year were taken from the NASA database using HOMER Pro.
The solar energy potential as shown in Figure 1 is highly promising, particularly when analyzing the daily solar radiation and temperature patterns throughout the year. Meanwhile, the solar radiation levels exhibit a pronounced seasonal variation, with the highest daily solar radiation occurring in the summer months. For instance, June experiences peak solar radiation of 7.79 kWh/m2/day, making it the most optimal time for PV energy generation. Similarly, May, July, and August also show high solar radiation values, exceeding 7 kWh/m2/day, which emphasizes the region’s suitability for harnessing solar power during this period. Conversely, the winter months, particularly December and January, record the lowest daily solar radiation, at 2.49 and 2.71 kWh/m2/day, respectively [25, 26].
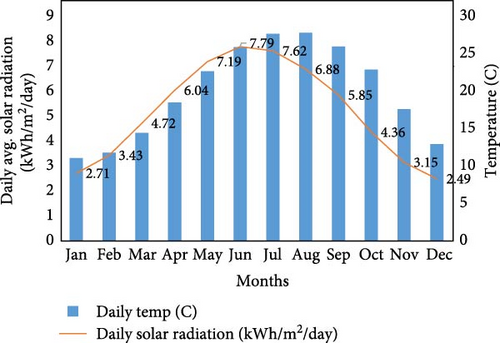
Moreover, the daily temperature plays a crucial role in influencing PV system performance, as excessive heat can reduce the efficiency [27]. Throughout the year, the temperature ranges from a cool 11.07°C in January to a peak of 27.81°C in August. Therefore, the moderate temperatures in the spring and autumn months—ranging from 18.49°C in April to 25.98°C in September—are particularly favorable for maintaining high PV efficiency, as systems typically operate best in cooler conditions. In addition, the temperature data aligns well with the solar radiation levels, particularly in the months between March and October, where both factors combine to create ideal conditions for sustained solar energy production.
On the other hand, during the colder months (November to February), while the solar radiation is lower, the moderate temperatures reduce the likelihood of overheating in PV systems, ensuring stable, albeit reduced, performance. Therefore, the balance between temperature and solar radiation throughout the year ensures that PV installations would perform effectively, with minimal seasonal interruptions [26].
2.2. Load Demand
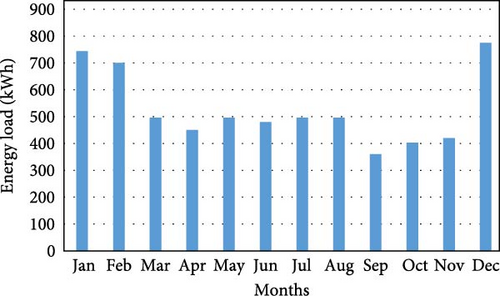
The household’s monthly energy consumption, based on real measured data described in Figure 2, has an average consumption pattern of 526 kWh per month, totaling 6378 kWh annually. This pattern reflects increased energy use due to air conditioning during the hot summer months of June, July, and August, as well as the use of electric heaters during the winter months of December, January, and February. Additionally, the household uses a washing machine, dishwasher, lighting, and a television. The consumption over 1 year is shown in Figure 2.
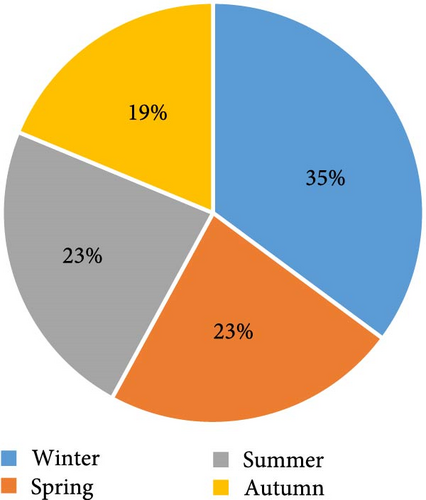
Household energy consumption varies across seasons as shown in Figure 3, with the highest usage in winter at 35.13% due to the extensive use of heaters to combat the cold. In summer, energy consumption is slightly higher than in spring, reaching 23.31%, primarily driven by the use of air conditioners to cool the home. Spring and autumn see lower energy usage, at 22.83% and 18.73%, respectively, as the milder temperatures reduce the need for both heating and cooling. This seasonal variation highlights the impact of temperature control on household energy consumption.
2.3. Estimating of PV Output Energy
This study considers four different PV capacities: 2, 3, 4, and 5 kWp. The PV output power was obtained using Homer Pro software, which simulates each PV system based on the parameters in Table 2.
| Parameter | Value |
|---|---|
| PV technology | Monocrystalline |
| Module efficiency | 17.72% |
| Inverter efficiency | 95% |
The hourly power output for each PV system is estimated using local solar radiation and temperature data specific to the selected location. Key factors such as panel efficiency, inverter losses, and the temperature’s impact on system performance are taken into account.
2.4. Self-Consumption and Self-Sufficiency Analysis
Eimport: hourly import energy (kWh); Eexport: hourly export energy (kWh); Epv: hourly PV generated energy (kWh); Edemand: hourly load energy (kWh).
For each of the three PV systems, the hourly energy balance (import/export) is calculated for an entire year to assess grid reliance and self-generation potential.
This analysis helps determine the degree of energy independence that each PV system size can provide for the household.
2.5. Net-Metering Scheme in Palestine
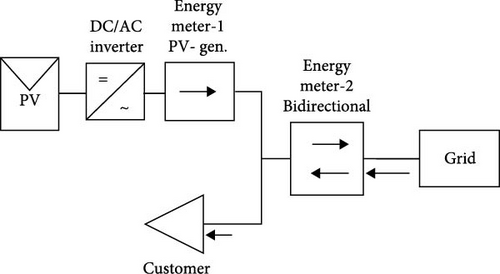
To utilize the net-metering regulation, consumers with PV systems are equipped with bidirectional kWh meters. These meters accurately measure the energy imported from the grid when PV generation is less than the demand and the energy exported to the grid when PV generation exceeds the load, as illustrated in Figure 4.
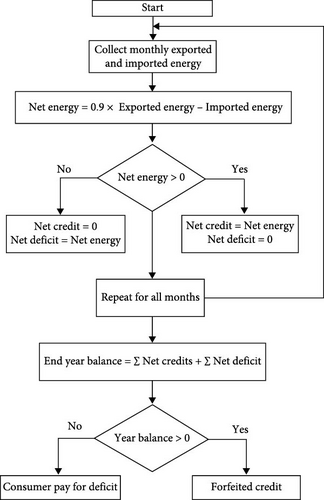
The updated 2020 net-metering scheme is described in Figure 5 through a flowchart that collects monthly exported and imported energy. A 10% discount is then applied to the value of the exported energy to account for the use of grid infrastructure. The monthly credit or deficit is calculated after applying the discount. At the end of the year, if the annual balance is positive, the excess credits are forfeited. If the annual balance is negative, the deficit is paid by the consumer [30].
EPV utilized: Annual PV energy generated (kWh); EPV: Annual PV energy generated (kWh); Eexport: Annual PV energy exported to the grid (kWh); Eforfeited: Annual energy credits forfeited at the end of the accounting period (kWh).
2.6. Economic Evaluation
Iannual: The annual income ($) EPVutilized: Annual PV energy utilized (kWh/year) CE: The cost of electricity ($/kWh)
The inputs for the economic calculation include the initial cost per kWp and the annual maintenance cost, which is typically a percentage of the initial cost. These costs depend on local market conditions and illustrated in Table 3.
| Parameter | Value | Unit |
|---|---|---|
| PV system initial cost | 850 | $/kWp |
| Annual maintenance cost | 5% of initial cost | $/year |
| The cost of electricity | 0.15 | $/kWh |
| Project lifetime | 20 | Year |
| Interest rate | 2 to 10 | % |
After identifying all these inputs (income and cost), an economic evaluation of the PV system is conducted using key financial metrics such as NPV, IRR, and DPP.
2.6.1. Net Present Value
- •
Iannual(t): Annual income from energy savings in consumer bill.
- •
Cannual(t): Annual maintenance cost in year t, it includes expenses like cleaning and general upkeep of the PV system.
- •
Cinitial: Initial investment cost of the PV system. This includes the cost of the PV panels, inverters, installation, and any other associated setup expenses.
- •
r: Discount rate.
- •
T: The time period over which the system is evaluated.
2.7. Internal Rate of Return
2.8. Discounted Payback Period
This analysis provides insights into the financial viability of each PV system under the updated net-metering policy.
3. Simulation Results
This section includes the energy production of different PV rated capacities, self-consumption, and self-sufficiency, as well as the economic results.
3.1. PV Energy Analysis
The PV energy generation for systems with capacities of 2, 3, 4, and 5 kWp exhibits a strong dependence on both the rated PV power and seasonal variations in solar radiation. The results in Figure 6 clearly show that energy generation is highest during the summer months (May–August), when solar radiation is most intense, peaking in July, and lowest during the winter months (November–February), when solar radiation is reduced. This seasonal trend reflects the typical variation in solar irradiance throughout the year.
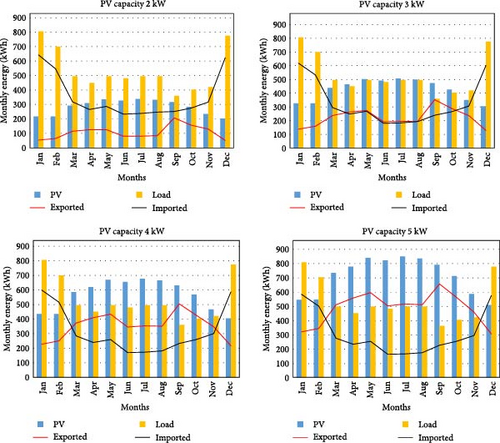
As the rated PV power increases, the energy output also increases proportionally. For instance, in July, the 5 kWp system produces 846 kWh, while the 2 kWp system generates only 338.37 kWh. This significant difference underscores the role of system capacity in determining energy output. Across all system sizes, the summer months not only provide the highest energy yields but also offer the greatest potential for reducing grid reliance and exporting surplus energy.
Seasonal energy dynamics are also influenced by variations in household demand. During winter months, energy demand is typically higher due to the increased use of electric heating systems, while PV generation is at its lowest, resulting in greater reliance on grid imports. In contrast, summer months experience higher PV generation due to intense solar radiation. However, high ambient temperatures slightly reduce PV efficiency, and household demand increases due to the widespread use of air conditioning systems. This combination often leads to a balance where exported energy remains moderate, as much of the PV generation is consumed locally to meet cooling needs.
Spring and autumn months represent transitional periods with moderate demand and generation. In these seasons, household energy requirements are relatively lower because there is minimal need for heating or cooling. Consequently, PV generation during these periods often leads to higher exports since the energy generated exceeds household consumption. This explains the seasonal variation in energy exports and imports across different PV capacities.
The monthly energy dynamics, illustrated in Figure 6, highlight the interaction between PV energy generation, household demand, and grid interaction. For smaller systems (2 and 3 kWp), most of the generated energy is consumed locally, resulting in lower exported energy and higher reliance on grid imports during low-generation months. Meanwhile, larger systems (4 and 5 kWp) generate surplus energy, leading to increased exports, particularly during peak summer months. However, the increased exports for larger systems also underscore the importance of favorable net-metering policies to ensure economic viability.
3.2. Self-Consumption and Self-Sufficiency
The monthly variations in import and export energy significantly influence two key performance metrics: self-consumption and self-sufficiency. Understanding these metrics is essential, as they provide valuable insights into the efficiency of PV system utilization and its advantages in reducing reliance on the grid. Self-consumption, in particular, highlights how much of the generated PV energy is directly used to meet household demand, while self-sufficiency reflects the extent to which the household is independent of imported energy.
As shown in Figure 7, the monthly self-consumption percentages vary significantly across different PV capacities (2, 3, 4, and 5 kWp), driven by seasonal changes in solar energy production and household energy demand. During the winter months (January to February and November to December), self-consumption percentages are notably higher. This trend is primarily due to increased household energy demand for heating, which aligns more closely with the relatively lower PV generation during these months. For instance, the 2 kWp system achieves its highest self-consumption percentages in January, demonstrating its ability to closely match household load under reduced solar output conditions. Meanwhile, larger PV systems, despite generating more energy, export a higher share of their output.
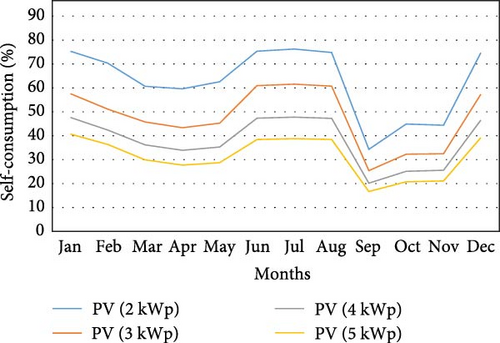
As the year transitions into spring (March–May), self-consumption percentages begin to decline steadily for all system sizes. This seasonal decrease corresponds to the increasing PV generation, which starts to exceed household demand. Nevertheless, the decline is more pronounced for larger systems, such as the 5 kWp system, due to their higher generation capacities. Consequently, a greater portion of surplus energy is exported to the grid, reducing the self-consumption percentage.
The summer months (June–August) represent a period of relative stability in self-consumption percentages for all system sizes. High solar radiation levels during these months lead to increased PV generation, which is offset by elevated household energy demand due to air conditioning usage. Accordingly, systems such as the 3 kWp PV maintain moderate self-consumption percentages during this period. However, it is worth noting that while higher generation generally leads to more exported energy, the concurrent increase in demand during summer mitigates this effect to some extent.
In contrast, the transitional months of September and October exhibit a sharp decline in self-consumption percentages, particularly for larger PV systems. This decline is attributed to the reduction in household energy demand as cooling requirements diminish, while PV generation remains relatively high. For example, the 5 kWp system achieves only a 16.67% self-consumption rate in September, as surplus energy is predominantly exported to the grid.
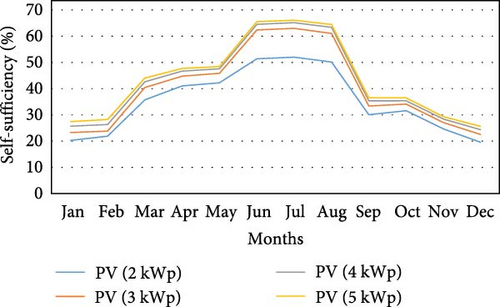
Figure 8 illustrates the PV self-sufficiency percentages for different PV systems reflecting the proportion of the household’s energy demand that is met directly by the PV system. As expected, self-sufficiency increases with larger PV system capacities. Seasonal variation is also evident, with higher self-sufficiency during the summer months (e.g., June and July) when solar radiation is at its peak, allowing households to meet over 65% of their energy needs with a 5 kWp system. In contrast, winter months like December and January show lower self-sufficiency, with values as low as 19.53% for a 2 kWp system, as both solar production and daylight hours decrease.
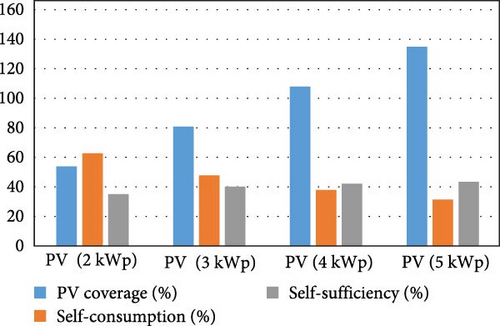
The annual performance metrics of PV systems with capacities of 2, 3, 4, and 5 kWp is shown in Figure 9. It shows that as the PV system size increases, PV coverage (the percentage of total household energy demand met by the PV system) rises significantly, from 54% for a 2 kWp system to 135% for a 5 kWp system. However, self-consumption (the percentage of PV energy used directly by the household) decreases as the system size increases, with the smallest system having a self-consumption rate of 63%, while the largest has only 31%. This is because larger systems tend to generate more energy than the household can consume, leading to more exported energy. In contrast, self-sufficiency (the proportion of the household’s total energy demand met by the PV system) increases moderately as the system size grows, from 35% for a 2 kWp system to 43% for a 5 kWp system. This highlights the diminishing returns in self-sufficiency as system sizes grow beyond the household’s needs, as excess energy is often exported to the grid rather than consumed onsite.
3.3. Implementation of Net-Metering Scheme
This section analyzes the performance of PV systems under the net-metering scheme, focusing on energy generated, utilized, and lost due to the scheme’s limitations. The annual indicators for PV systems with capacities of 2, 3, 4, and 5 kWp are presented to highlight the implications of system size on energy utilization and financial viability.
Table 4 illustrates the annual energy metrics for various PV system capacities, including total energy generated, energy lost through export deductions, and end-of-year forfeitures. As expected, the total PV energy generated increases proportionally with system size, with the 5 kWp system generating the highest annual output (8514 kWh). Meanwhile, the percentage of PV energy utilized, calculated using Equation (7), and divided by the PV energy generation, decreases as the system size increases. For instance, the 2 kWp system utilizes 96.27% of its generated energy, while the 5 kWp system utilizes only 74.91%. Notably, the 4 and 5 kWp systems both utilize 6378 kWh annually. In this regard, increasing system capacity beyond 4 kWp does not proportionally increase energy utilization. This diminishing return is a direct consequence of the limitations imposed by the current net-metering framework.
| Energy parameter | PV (2 kWp) | PV (3 kWp) | PV (4 kWp) | PV (5 kWp) |
|---|---|---|---|---|
| Annual energy PV generated (kWh) | 3405 | 5108 | 6811 | 8514 |
| Annual export energy discounted (kWh) | 127 | 266 | 424 | 586 |
| Annual end year energy forfeited (kWh) | 0 | 0 | 9 | 1550 |
| Annual energy PV utilized (kWh) | 3278 | 4842 | 6378 | 6378 |
| PV energy utilized percent (%) | 96.27 | 94.79 | 93.64 | 74.91 |
The annual export energy loss, caused by the 10% deduction applied to exported energy, also increases with system size. This loss is minimal for the 2 kWp system (127 kWh) but becomes substantial for the 5 kWp system (586 kWh), reflecting the higher export volumes of larger systems. Meanwhile, end-of-year energy forfeitures significantly impact the 5 kWp system, which loses 1550 kWh of unused energy. These forfeitures highlight the inefficiency of the net-metering scheme for larger systems. Consequently, these losses undermine the financial benefits of installing higher-capacity PV systems, particularly for households with stable energy demands.
From an economic perspective, the results suggest that appropriately sized systems, such as the 2 or 3 kWp configurations, are more aligned with household energy consumption patterns and maximize energy utilization under the current scheme. In contrast, oversized systems, while capable of generating more energy, face substantial losses due to export deductions and energy forfeitures. Therefore, larger PV systems are less economically viable within the current regulatory framework. Accordingly, optimizing system size to match household energy consumption is critical to achieving higher efficiency and maximizing economic returns under the net-metering scheme.
3.4. Economic Results
The economic analysis of the PV systems in this study is based on several key assumptions previously mention in methodology section Table 3. The primary savings for the household come from the utilized PV energy, which offsets grid electricity demand. The total generated energy is not fully credited to the household due to the net- metering policy that deducts 10% of the exported energy and forfeits any remaining credits at the end of the year. Therefore, the economic feasibility is highly dependent on the PV system’s ability to meet direct energy consumption, with any excess energy being subject to these losses. The analysis evaluates the NPV, IRR, and DPP for four PV system sizes: 2, 3, 4, and 5 kWp.
Table 5 shows the economic results of the PV systems reveal several key insights. Meanwhile, the annual savings for the 2, 3, 4, and 5 kWp systems are $492, $726, $957, and $957, respectively. Nevertheless, despite the 5 kWp system generating the most energy, its annual savings are no higher than the 4 kWp system due to the limitations imposed by the net-metering policy. The NPV further reflects this trend. The NPV for the 4 kWp system is the highest at $5,626.83, while the 5 kWp system’s NPV drops to $4,289.36. This indicates that the excess energy produced by the 5 kWp system is not fully utilized, resulting in reduced financial returns.
| Economic parameter | PV (2 kWp) | PV (3 kWp) | PV (4 kWp) | PV (5 kWp) |
|---|---|---|---|---|
| Annual saving ($) | 492 | 726 | 957 | 957 |
| NPV ($) | 2,968.2 | 4314.7 | 5,626.8 | 4,289.3 |
| IRR (%) | 23.60 | 23.1 | 22.76 | 16.72 |
| DPP (year) | 4.95 | 5.07 | 5.15 | 7.20 |
Therefore, smaller systems like the 2 and 3 kWp systems, with NPVs of $2,968.26 and $4,314.70, respectively, may be more financially efficient as they better match household demand. In terms of the IRR, the 2 kWp system has the highest IRR of 23.60%, with the IRRs for the 3, 4, and 5 kWp systems at 23.1%, 22.76%, and 16.72%, respectively. The declining IRR for the larger systems emphasizes the diminishing returns as the PV capacity exceeds the household’s self-consumption ability. Meanwhile, the DPP follows a similar trend, with the 2 kWp system having the shortest DPP of 4.95 years and the 5 kWp system having the longest at 7.20 years. When comparing the 2 and 4 kWp PV systems, the 4 kWp system has an NPV of $5,626.8 compared to $2,968.2 for the 2 kWp system, indicating that it generates more total profit over its lifetime due to greater energy production and savings. However, the 2 kWp system has a slightly higher IRR at 23.60%, compared to 22.76% for the 4 kWp system, suggesting that it offers a better return on investment in terms of efficiency. While the 4 kWp system provides higher overall profitability with its greater NPV, the 2 kWp system is a more efficient investment, offering a quicker return relative to the initial cost. Therefore, the 2 kWp system is ideal for those prioritizing investment efficiency and faster returns, while the 4 kWp system is more suitable for those seeking higher overall profitability.
3.5. Sensitivity Analysis
A sensitivity analysis is performed to explore how changes in key variables impact the system’s economic performance. The variable considered in this analysis is the interest rate. The sensitivity analysis demonstrates that as interest rates increase from 2% to 10%, as shown in Table 6, and impacts of that on NPV, DPP, and IRR.
| Interest rate (%) | NPV ($) | DPP (Year) | IRR (%) |
|---|---|---|---|
| 2 | 4955 | 4.4076 | 23.60 |
| 4 | 3831 | 4.6655 | 23.60 |
| 6 | 2968 | 4.95 | 23.60 |
| 8 | 2296 | 5.2923 | 23.60 |
| 10 | 1765 | 5.684 | 23.60 |
It is worth noting thatthe NPV decreases significantly, from $4,955 at 2% to $1,765 at 10%, indicating that higher interest rates reduce the profitability of the investment. Similarly, the DPP extends from 4.41 years at 2% to 5.68 years at 10%, showing that higher interest rates delay the time required to recover the initial investment this decreasing in NPV and increasing of DPP is shown in Figure 10.
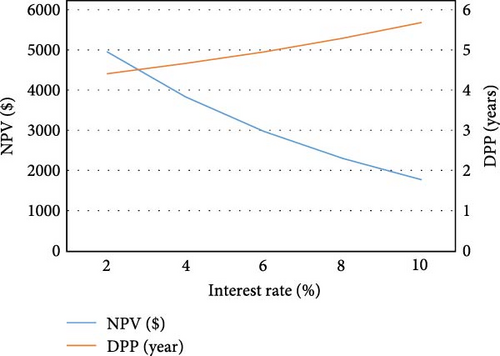
Meanwhile, the IRR remains constant at 23.60% across all interest rates, as it reflects the internal profitability of the investment, independent of external interest rates. These results suggest that while the project remains viable, higher interest rates make the investment less financially attractive due to the reduced NPV and longer DPPs. Therefore, the PV system investment is most appealing at lower interest rates, where returns are maximized and the time to recover the investment is shorter.
3.6. Recommendations
This section outlines strategic recommendations to optimize the benefits of net metering for both residential users and the PEA. By addressing the needs of these key stakeholders, these recommendations aim to enhance the adoption and effectiveness of PV systems under the updated net-metering regulations.
3.7. Recommendation for PV Users
To maximize the benefits of PV systems under the current net-metering scheme, users should focus on appropriately sizing their PV systems to ensure higher utilization of the generated energy by aligning system capacity with household energy consumption patterns. Oversizing systems lead to increased export losses and forfeitures, thereby reducing economic returns. Instead, enhancing self-consumption is crucial. Users can shift energy-intensive activities, such as laundry and cooking, to times of peak PV generation, reducing export energy and minimizing energy deductions. This approach increases the PV utilization percentage and ultimately shortens the DPP.
3.8. Recommendation for the PEA
The PEA can support the widespread adoption of PV systems by revising the export deduction policy. Lowering or removing the current 10% deduction on exported energy would make larger PV systems more attractive to residential users, enhancing overall adoption rates.
Implementing flexible credit policies, such as rolling over excess credits to the following year or allowing buy-back options for surplus energy, can further incentivize users to adopt PV systems. These changes would also address concerns about energy forfeitures under the current netmetering framework.
4. Conclusion
This study evaluated the economic impacts of net metering on residential PV adoption in Palestine, focusing on household load demands covered by PV systems with rated capacities of 2, 3, 4, and 5 kWp. The findings reveal that PV systems with higher utilization percentages, such as the 2 kWp and 3 kWp configurations, align better with household energy consumption patterns. These systems, by covering load demand with minimal export energy and forfeited energy, achieved shorter DPP, with the 2 kWp system reaching a DPP of just 4.95 years. In contrast, larger systems like the 5 kWp generated more energy but faced significantly lower utilization percentages. This was primarily due to high export losses and energy forfeitures under the current net-metering rules, resulting in the longest DPP of 7.20 years. While larger systems produce greater energy output, their economic viability diminishes due to these inefficiencies.
From a policy perspective, the study highlights the current net-metering scheme’s limitations in supporting larger PV system adoption. Reducing the 10% export deduction or permitting unused credits to roll over could boost the financial appeal of larger systems and encourage renewable energy adoption, while also increasing household confidence in solar investments. To maximize PV benefits under net metering, users should size systems to match consumption, avoiding oversizing that leads to export losses and reduced returns. Shifting energy-intensive activities to peak PV generation enhances self-consumption, increasing utilization, and shortening the DPP.
5. Further Research Directions
Future studies could investigate alternative mechanisms, such as time-of-use (TOU) tariff schemes, which may open avenues for adopting new technologies like smart inverters and battery storage systems. These technologies can enhance PV solar energy utilization by enabling better load shifting and storage capabilities. Additionally, exploring such mechanisms could contribute to improving the power system’s efficiency and reliability in Palestine.
Future studies could also investigate the social and behavioral factors that influence the adoption of PV systems in Palestine under the updated net-metering scheme. Understanding consumer behavior, including motivations, barriers, and preferences, could provide valuable insights for policymakers. Conducting user surveys or focus groups may help identify key factors driving adoption, such as economic incentives, environmental awareness, and trust in emerging technologies.
Conflicts of Interest
The author declares no conflicts of interest.
Funding
There is no funding source for this research.
Open Research
Data Availability Statement
The data used to support the findings of this study are included within the article.


