Factors Associated With Upgrades From Biopsy Gleason Grades 1–3 to Radical Prostatectomy Gleason Grades 4–5 in Prostate Cancer Patients
Abstract
Introduction: Discordances of Gleason grade (GG) between biopsy and radical prostatectomy (RP) of prostate cancer (PCa) patients have raised great concerns. Our study aimed to identify these predictive factors for GG upgrading from biopsy to RP.
Methods: We retrospectively reviewed the records of PCa patients receiving RP in our medical center. All patients underwent a standardized 12-core transrectal ultrasound (TRUS)–guided prostate needle biopsy, with site-specific submissions. Pretreatment PSA–related parameters were assessed 2 weeks before the operation. Prostate volume (PV) was calculated from images.
Results: 679 patients were enrolled after screening. In the biopsy GG 1–3 group, 91 patients experienced upgrades. The multivariable analysis revealed that total PSA (tPSA) (p value < 0.01) and perineural invasion (p value = 0.01) were significantly associated with the likelihood of upgrading compared to the concordant group.
Conclusion: The GG 4 group demonstrated the lowest rate of concordance between biopsy and RP. Our analysis identified tPSA levels and perineural invasion as independent predictors of GG upgrading from biopsy GG 1–3 to RP GG 4–5 in PCa patients.
1. Introduction
Prostate cancer (PCa) is the most common malignancy of the urogenital system. Although most PCa patients have a favorable prognosis, those with advanced disease often fare poorly [1]. Gleason score (GS), utilized in both biopsy and radical prostatectomy (RP) specimens, is the most recommended PCa grading system to predict the prognosis of patients [2]. To enhance prognostic accuracy, the Gleason grade (GG) groups categorize the GS into five distinct groups [2–4], each associated with similar outcomes [5, 6]. For RP, the 5-year biochemical recurrence-free survival rates range from 96% in GG 1 to 26% in GG 5 [7].
While prostate biopsies provide essential pathological insights for diagnosing PCa, a mismatch is not avoidable between biopsy GG and RP GG, which suggests significant prognostic variations. These discrepancies, including both downgrades and upgrades from biopsy to RP, pose substantial challenges in managing clinically localized PCa. Patients with GG 2 or lower without distant metastases may qualify for active surveillance as part of a low/intermediate-risk indolent disease strategy [8]. These biopsy-to-RP variations can influence treatment decisions, significantly affecting patient’s quality of life and long-term prognosis. For example, downgrades in GG might lead to unnecessary surgeries. Athanazio et al. [9] noted that the most common discrepancies occurred in biopsy GG 4, with 45.7% of cases downgraded and 32.9% upgraded. Factors contributing to these discrepancies remain controversial. Davis et al. [10] indicated that fewer positive biopsy cores with a GS of (4 + 4) are often linked to downgrades in robot-assisted radical prostatectomies (RARPs). Moreover, Epstein [11] identified age, rising serum prostate–specific antigen (PSA) levels, and an increased maximum percentage of positive cores as predictors of upgrading from biopsy GS 5–6 to higher grades. Nevertheless, predictive factors for upgrading from biopsy GG 1–3 to RP GG 4–5, which correlates with a significant drop in the 5-year BCR to below 50%, are still not well-defined [7]. Thus, our study aimed to identify these predictive factors for GG upgrading from biopsy to RP.
2. Methods
2.1. Study Setting and Study Design
We retrospectively reviewed the records of patients diagnosed with PCa receiving RP in our medical center between January 2013 and July 2023. The inclusive criteria were as follows: (1) undergoing a prostate biopsy, (2) undergoing RP with a pathologically confirmed diagnosis of PCa, and (3) availability of clinicopathological data. The exclusive criteria were as follows: (1) undergoing a prostate biopsy with fewer than 12 cores, (2) preoperative hormone or neoadjuvant therapy, (3) prior prostate operations before RP, and (4) preoperative lab tests and radiological images unavailable. The inclusive and exclusive criteria are presented in Figure 1.
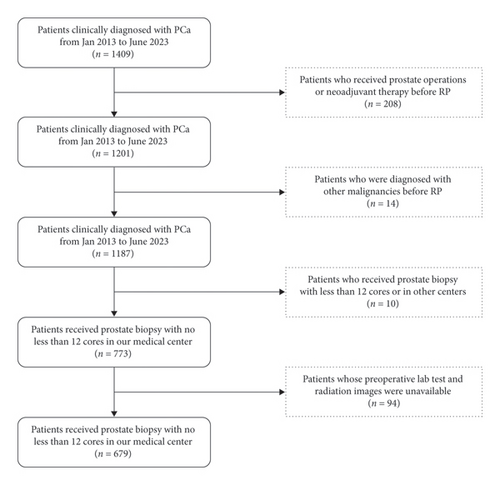
All patients underwent a standardized 12-core transrectal ultrasound (TRUS)–guided prostate needle biopsy, with site-specific submissions (two cores per anatomical site-apex, mid, and base on both the left and right sides). Additional biopsies (one or two cores per node) were performed when TRUS indicated nodal involvement of the prostate. GSs were reported separately for each biopsy site, and the global GGs were classified according to the criteria confirmed formally at the ISUP 2019 consensus meeting [3]. Both biopsy and RP pathological assessments were conducted by experienced pathologists. The GG categories are as follows: GS ≤ 6 (GG 1), GS3 + 4 (GG 2), GS4 + 3 (GG 3), GS8 (GG 4), and GS ≥ 9 (GG 5).
Pretreatment PSA–related parameters were assessed 2 weeks before the operation. Prostate volume (PV) was estimated using either TRUS or magnetic resonance imaging (MRI), with measurements of length (L), height (H), and width (W). PV was calculated using the formula PV = L∗H∗W∗ 0.52. Prostate antigen density (PSAD) was determined by dividing the total PSA (tPSA) by the PV. The perineural invasion and the membrane infiltration were determined by MRI.
2.2. Statistical Analysis
Continuous variables were summarized using the median/interquartile range (IQR), while categorical variables were presented as counts and percentages. To assess differences between continuous variables, either the Wilcoxon rank-sum test or the unpaired t-test was employed. Differences between categorical variables were evaluated using the chi-square test or the chi-square test for trend. All statistical analyses were performed using SPSS Version 26.0 (SPSS, Inc.), with statistical significance set at p value < 0.05.
3. Results
This research enrolled 679 patients after screening. The most common GG on biopsy was GG 5 (25.0%, 170/679). The distribution of RP GGs from GG 1 to GG 5 was 9.9%, 26.2%, 20.3%, 14.6%, and 29.0%, respectively, as detailed in Table 1.
| Biopsy | RP | |
|---|---|---|
| GG 1, (n/%) | 127 (18.7%) | 67 (9.9%) |
| GG 2, (n/%) | 167 (24.6%) | 178 (26.2%) |
| GG 3, (n/%) | 142 (20.9%) | 138 (20.3%) |
| GG 4, (n/%) | 73 (10.8%) | 99 (14.6%) |
| GG 5, (n/%) | 170 (25.0%) | 197 (29.0%) |
- Abbreviations: GG, Gleason grade; RP, radical prostatectomy.
Upgrades from biopsy to RP occurred in 218 patients (32.1%), while 115 patients (16.9%) experienced downgrades. Concordance rates were highest in the biopsy GG 5 group (131/170, 77.1%) and the biopsy GG 2 group (89/167, 53.2%). The lowest concordance rate was in the GG 4 group (23/73, 31.5%), with most cases either downgraded (32/73, 43.8%) or upgraded (18/73, 24.7%). A significant proportion (80/127, 63.0%) of the biopsy GG 1 cases upgraded, and more than one-third (63/167, 37.7%) of biopsy GG 2 cases upgraded, as shown in Table 2.
| Upgrades | Concordant | Downgrades | |
|---|---|---|---|
| GG 1, (n/%) | 80 (63.0%) | 47 (37.0%) | |
| GG 2, (n/%) | 63 (37.7%) | 89 (53.2%) | 15 (9.1%) |
| GG 3, (n/%) | 57 (40.1%) | 56 (39.4%) | 29 (20.4%) |
| GG 4, (n/%) | 18 (24.7%) | 23 (31.5%) | 32 (43.8%) |
| GG 5, (n/%) | 131 (77.1%) | 39 (22.9%) |
- Abbreviations: GG, Gleason grade; RP, radical prostatectomy.
3.1. Factors Predicting Upgrades From Biopsy GG to RP GG
Concordance between biopsy and RP GG was observed in 346 patients, whereas 218 patients showed upgrades. The baseline characteristics of patients with GG upgrades from biopsy to RP are listed in Table 3.
| Concordant (n = 346) | Upgrading (n = 218) | p value | |
|---|---|---|---|
| Age (years), median (IQR) | 69.0 (65.0–74.0) | 68.50 (64.0–75.0) | 0.30 |
| Height (cm), median (IQR) | 170.0 (165.0–174.0) | 170.0 (165.0–173.5) | 0.76 |
| Weight (kg), median (IQR) | 71.3 (65.0–79.0) | 71.0 (65.0–77.0) | 0.54 |
| BMI (kg/m2), median (IQR) | 24.9 (22.7–26.6) | 24.6 (22.8–26.3) | 0.29 |
| tPSA (ng/mL), median (IQR) | 13.1 (7.8–23.3) | 12.5 (7.5–21.5) | 0.49 |
| fPSA (ng/mL), median (IQR) | 1.6 (1.0–2.8) | 1.5 (0.9–2.5) | 0.34 |
| fPSA/tPSA, median (IQR) | 0.1 (0.1–0.2) | 0.1 (0.1–0.2) | 0.60 |
| Prostate volume (mL), median (IQR) | 37.1 (28.6–51.2) | 40.1 (29.6–50.3) | 0.35 |
| PSAD (ng/mL2), median (IQR) | 0.4 (0.2–0.7) | 0.3 (0.2–0.6) | 0.34 |
| Number of cores (n), median (IQR) | 12 (12–13) | 12 (12–12.25) | 0.17 |
| Number of positive cores (n), median (IQR) | 5 (3–8) | 4 (2–7) | < 0.01 |
| Number of positive cores (n)/number of cores (n), median (IQR) | 0.4 (0.2–0.7) | 0.3 (0.2–0.5) | < 0.01 |
| Maximum percentage of positive cores (%), median (IQR) | 80.0 (50.0–90.0) | 50.0 (20.0–80.0) | < 0.01 |
| Positive margin (n/%) | 143 (41.3%) | 72 (33.0%) | 0.04 |
| Membrane infiltration (n/%) | 129 (37.3%) | 67 (30.7%) | 0.11 |
| Seminal vesicle invasion (n/%) | 60 (17.3%) | 21 (9.6%) | 0.01 |
| Perineural invasion (n/%) | 222 (64.2%) | 139 (63.8%) | < 0.01 |
| Intravascular tumor thrombus (n/%) | 66 (19.1%) | 17 (7.8%) | < 0.01 |
- Note: Continuous variables were expressed as the median and interquartile range, and categorical variables as numbers (n) and percentages (%). The Mann–Whitney U test was utilized to evaluate the differences among the continuous variable groups, while a chi-squared test was applied to examine the differences between categorical variable groups.
- Abbreviations: BMI, body mass index; GG, Gleason grade; fPSA, free prostate–specific antigen; IQR, interquartile range; PSAD, prostate-specific antigen density; RP, radical prostatectomy; tPSA, total prostate–specific antigen.
A multivariable analysis of clinical and pathological parameters influencing GG upgrades is presented in Table 4. This analysis identified the maximum percentage of positive cores as the sole significant predictive factor for upgrades compared to the concordant group (odds ratio: 0.984, 95% CI: 0.976–0.991, p value < 0.01).
| Variables | OR | 95% CI | p value |
|---|---|---|---|
| Number of positive cores (n) | 0.871 | (0.456–1.591) | 0.66 |
| Number of positive cores (n)/number of cores (n) | 2.420 | (0.001–6976) | 0.82 |
| Maximum percentage of positive cores (%) | 0.984 | (0.9764–0.992) | < 0.01 |
| Positive margin | 0.844 | (0.567–1.255) | 0.40 |
| Perineural invasion | 1.405 | (0.940–2.118) | 0.10 |
- Note: Continuous variables were expressed as the median and interquartile range, and categorical variables as numbers (n) and percentages (%). The Mann–Whitney U test was utilized to evaluate the differences among the continuous variable groups, while a chi-squared test was applied to examine the differences between categorical variable groups.
- Abbreviations: CI, confidence interval; GG, Gleason grade; OR, odds ratio; RP, radical prostatectomy.
3.2. Factors Predicting Downgrades From Biopsy GG to RP GG
115 patients showed downgrades from biopsy GG to RP GG. The baseline characteristics of patients with GG downgrades from biopsy to RP are listed in Table 5, compared to the concordant group.
| Concordant (n = 346) | Downgrading (n = 115) | p value | |
|---|---|---|---|
| Age (years), median (IQR) | 69.0 (65.0–74.0) | 70.0 (65.0–76.0) | 0.09 |
| Height (cm), median (IQR) | 170.0 (165.0–174.0) | 168.0 (165.0–172.0) | 0.02 |
| Weight (kg), median (IQR) | 71.3 (65.0–79.0) | 70.0 (64.5–76.0) | 0.18 |
| BMI (kg/m2), median (IQR) | 24.9 (22.7–26.6) | 24.9 (22.3–26.7) | 0.74 |
| tPSA (ng/mL), median (IQR) | 13.1 (7.8–23.3) | 10.2 (6.6–18.3) | 0.18 |
| fPSA (ng/mL), median (IQR) | 1.6 (1.0–2.8) | 1.5 (0.9–2.2) | 0.57 |
| fPSA/tPSA, median (IQR) | 0.1 (0.1–0.2) | 0.1 (0.1–0.2) | 0.10 |
| Prostate volume (mL), median (IQR) | 37.1 (28.6–51.2) | 38.1 (27.3–45.7) | 0.47 |
| PSAD (ng/mL2), median (IQR) | 0.4 (0.2–0.7) | 0.3 (0.2–0.6) | 0.98 |
| Number of cores (n), median (IQR) | 12 (12–13) | 12 (12–13) | 0.14 |
| Number of positive cores (n), median (IQR) | 5 (3–8) | 5 (3–7) | 0.13 |
| Number of positive cores (n)/number of cores (n), median (IQR) | 0.4 (0.2–0.7) | 0.4 (0.2–0.6) | 0.09 |
| Maximum percentage of positive cores (%), median (IQR) | 80.0 (50.0–90.0) | 60.0 (40.0–85.0) | 0.02 |
| Positive margin (n/%) | 143 (41.3%) | 24 (21.6%) | < 0.01 |
| Membrane infiltration (n/%) | 129 (37.3%) | 30 (26.1%) | 0.04 |
| Seminal vesicle invasion (n/%) | 60 (17.3%) | 5 (4.3%) | < 0.01 |
| Perineural invasion (n/%) | 222 (64.2%) | 66 (57.9%) | 0.12 |
| Intravascular tumor thrombus (n/%) | 66 (19.1%) | 11 (10.4%) | 0.03 |
- Note: Continuous variables were expressed as the median and interquartile range, and categorical variables as numbers (n) and percentages (%). The Mann–Whitney U test was utilized to evaluate the differences among the continuous variable groups, while a chi-squared test was applied to examine the differences between categorical variable groups.
- Abbreviations: BMI, body mass index; fPSA, free prostate–specific antigen; GG, Gleason grade; IQR, interquartile range; PSAD, prostate-specific antigen density; RP, radical prostatectomy; tPSA, total prostate–specific antigen.
A multivariable analysis of clinical and pathological parameters influencing GG downgrades is presented in Table 6. This analysis indicated that the positive margin is the sole significant predictive factor for downgrades compared to the concordant group (odds ratio: 0.553, 95% CI: 0.324–0.946, p value = 0.03).
| Variables | OR | 95% CI | p value |
|---|---|---|---|
| Maximum percentage of positive cores (%) | 1.000 | (0.992–1.008) | 0.98 |
| Positive margin | 0.553 | (0.324–0.946) | 0.03 |
| Membrane infiltration | 0.900 | (0.534–1.518) | 0.69 |
| Seminal vesicle invasion | 0.367 | (0.135–0.993) | 0.05 |
| Intravascular tumor thrombus | 0.699 | (0.338–1.449) | 0.34 |
- Note: Continuous variables were expressed as the median and interquartile range, and categorical variables as numbers (n) and percentages (%). The Mann–Whitney U test was utilized to evaluate the differences among the continuous variable groups, while a chi-squared test was applied to examine the differences between categorical variable groups.
- Abbreviations: CI, confidence interval; GG, Gleason grade; OR, odds ratio; RP, radical prostatectomy.
3.3. Factors Predicting Upgrades From Biopsy GG 1–3 to RP GG 4–5
In the biopsy GG 1–3 group, GG was concordant between biopsy and RP in 169 patients, while 91 patients experienced upgrades. The clinicopathological characteristics associated with these GG upgrades from biopsy to RP are detailed in Table 7.
| Concordant (n = 169) | Upgrading (n = 91) | p value | |
|---|---|---|---|
| Age (years), median (IQR) | 69.0 (65.0–74.0) | 68.0 (63.0–73.0) | 0.17 |
| Age (≥ 70 years), (n/%) | 86 (50.9%) | 37 (40.7%) | 0.12 |
| Height (cm), median (IQR) | 170.0 (165.0–175.0) | 170.0 (165.0–173.0) | 0.37 |
| Weight (kg), median (IQR) | 71.5 (65.0–79.0) | 71.5 (63.5–75.6) | 0.54 |
| BMI (kg/m2), median (IQR) | 24.6 (22.5–26.6) | 24.4 (23.0–26.1) | 0.55 |
| BMI (≥ 25 kg/m2),(n/%) | 76 (45.0%) | 36 (39.6%) | 0.40 |
| tPSA (ng/mL), median (IQR) | 9.3 (6.5–13.0) | 14.9 (9.3–24.3) | < 0.01 |
| fPSA (ng/mL), median (IQR) | 1.6 (1.0–2.8) | 1.5 (0.9–2.5) | 0.34 |
| fPSA/tPSA, median (IQR) | 0.6 (0.3–1.3) | 0.3 (0.1–0.5) | < 0.01 |
| Prostate volume (mL), median (IQR) | 37.4 (28.7–53.0) | 38.1 (29.6–48.9) | 0.69 |
| PSAD (ng/mL2), median (IQR) | 0.2 (0.1–0.4) | 0.4 (0.3–0.6) | < 0.01 |
| fPSA/tPSA/PSAD (mL2/ng), median (IQR) | 0.6 (0.3–1.3) | 0.3 (0.1–0.5) | < 0.01 |
| Number of cores (n), median (IQR) | 12 (12–13) | 12 (12–13) | 0.66 |
| Number of positive cores (n), median (IQR) | 5 (3–8) | 4 (2–7) | < 0.01 |
| Number of positive cores (n)/number of cores (n), median (IQR) | 0.3 (0.2–0.4) | 0.3 (0.2–0.5) | 0.02 |
| Maximum percentage of positive cores (%), median (IQR) | 50.0 (30.0–80.0) | 60.0 (35.0–80.0) | 0.25 |
| Positive margin (n/%) | 44 (26.0%) | 35 (38.5%) | 0.04 |
| Membrane infiltration (n/%) | 34 (20.1%) | 38 (41.8%) | < 0.01 |
| Seminal vesicle invasion (n/%) | 7 (4.1%) | 9 (9.9%) | 0.07 |
| Perineural invasion (n/%) | 82 (48.5%) | 65 (71.4%) | < 0.01 |
| Intravascular tumor thrombus (n/%) | 4 (2.4%) | 9 (9.9%) | 0.01 |
- Note: Continuous variables were expressed as the median and interquartile range, and categorical variables as numbers (n) and percentages (%). The Mann–Whitney U test was utilized to evaluate the differences among the continuous variable groups, while a chi-squared test was applied to examine the differences between categorical variable groups.
- Abbreviations: BMI, body mass index; fPSA, free prostate–specific antigen; GG, Gleason grade; IQR, interquartile range; PSAD, prostate-specific antigen density; RP, radical prostatectomy; tPSA, total prostate–specific antigen.
A multivariable analysis was conducted, incorporating factors that showed significant differences in the univariate analysis, as presented in Table 8. Our results revealed that tPSA (OR: 1.119, 95% CI: 1.049–1.200, p value < 0.01) and perineural invasion (OR: 2.280, 95% CI: 1.193–4.469, p value = 0.01) were significantly associated with the likelihood of upgrading compared to the concordant group. The upgrading group exhibited higher tPSA levels and a higher incidence of radiological perineural invasion.
| Variables | OR | 95% CI | p value |
|---|---|---|---|
| Number of positive cores (n)/number of cores (n) | 5.491 | (0.002–2264) | 0.68 |
| tPSA (ng/mL) | 1.119 | (1.049–1.200) | < 0.01 |
| PSAD (ng/mL2) | 2.435 | (0.395–21.010) | 0.38 |
| (f/t) /PSAD | 0.739 | (0.360–1.130) | 0.36 |
| Membrane infiltration | 1.513 | (0.771–2.945) | 0.22 |
| Perineural invasion | 2.280 | (1.193–4.469) | 0.01 |
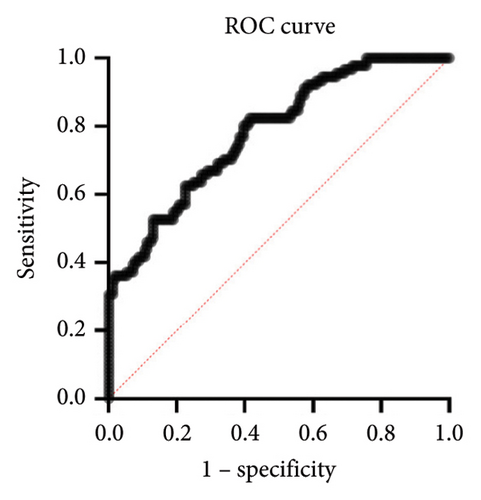
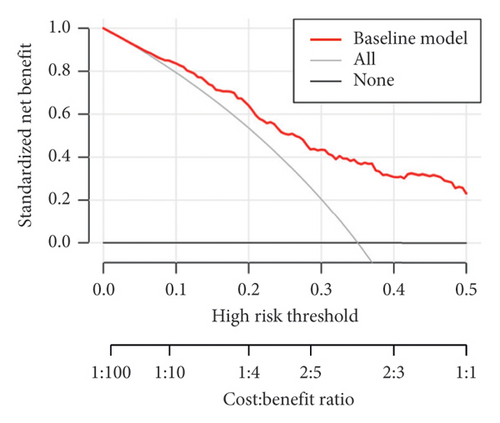
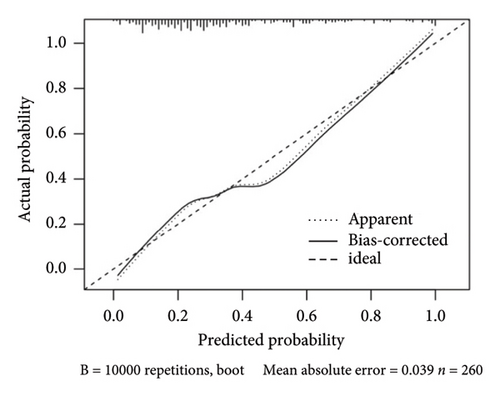
The calculated areas under the curve (AUC) value for prediction of the risk of upgrading from biopsy GG 1–3 to prostatectomy GG 4–5 was 0.7831 (95% CI: 0.7825–0.8819), as shown in Figure 2(a). The decision curve analysis of the training set was made based on the results of Table 8, as shown in Figure 2(b). The calibration curve of the model is shown in Figure 2(c). The calibration ability of the model is tested i by the Hosmer–Lemeshow goodness-of-fit test, with the χ2 value of 6.106 (p = 0.635).
4. Discussion
GG, derived from the GG system, plays a critical role in treatment decisions and prognosis assessment in PCa, as it reflects the biological behavior of the disease from a pathological perspective. However, discrepancies of biopsy GG and RP GG persist, presenting challenges for surgeons. Upgrades from biopsy GG to RP GG may lead to undertreatment, while downgrades may lead to overtreatment, adversely affecting the patient’s quality of life and prognosis. Patients with a relatively low biopsy GG may opt for active surveillance (AS) instead of surgery [8]. Yet, some of these patients may experience GG upgrades post-RP, indicating that AS was inappropriate and potentially causing them to miss timely surgical interventions, thereby increasing the risk of metastasis. Lellig [12] reported that the differentiation of prostate carcinomas was underestimated in over a third of patients eligible for AS who then underwent RP. In addition, patients reclassified into higher National Comprehensive Cancer Network (NCCN) risk categories due to GG upgrades might have a better prognosis if the biopsy GG accurately reflected the disease state, making them ideal candidates for multimodal treatments or clinical trials [13, 14]. Therefore, it is vital to investigate the factors influencing GG upgrades. This article aims to elucidate the predictive factors of GG upgrades from biopsy to RP, particularly from the biopsy GG 1–3 group to the GG 4–5 group.
We explored the predictors of GG upgrades from biopsy to RP. Our multivariate analysis revealed that neither the number of biopsy cores nor the number of positive cores significantly differed between the upgrading group and the concordant group, aligning with previous findings [15, 16]. Epstein et al. [11] suggested that the number of cores could predict upgrades from GS 5–6 at biopsy to GS > 6 at RP. Notably, our study included only patients who had undergone biopsies with at least 12 cores, in contrast to earlier studies that included biopsies with a minimum of 10 cores [17]. We propose that adhering to a standard of at least 12 biopsy cores could enhance the likelihood of concordance between biopsy GG and RP GG. For patients eligible for AS but who had fewer than 12 biopsy cores, an additional standard 12-core needle biopsy may be necessary to diminish the risk of GG upgrades. In addition, our findings indicate that the maximum percentage of positive cores is a predictor of GG upgrades. Moussa et al. also highlighted a nomogram that incorporates this metric to predict upgrades in low- and intermediate-grade PCa [18]. Our findings also indicate that the positive margin may predict the downgrades of GG.
We conducted further analysis to identify predictive factors for upgrading from biopsy GG 1–3 to RP GG 4–5. Elevated PSA levels were associated with unusually large prostate glands in older patients. PSA is commonly used for risk stratification and to predict pathological outcomes and prognosis. The associations between PSA–related parameters and GS/GG upgrading have received wide attention. Our findings suggest that tPSA can predict upgrades from GG 1–3 at biopsy to GG 4–5 at RP. Yang et al. [19] reported that PSA levels between 8.1 and 9.9 ng/mL, compared to ≤ 4.0 ng/mL, were linked with a higher risk of upgrades in patients with GS 3 + 4 favorable intermediate-risk PCa. Zhou et al. [20] found that a PSA level over 20 ng/mL is an independent risk factor for GS upgrading after RP among patients with GS 7 (GS 3 + 4/GS 4 + 3). Besides, PSAD is associated with GS upgrading in men with GS 6 [21] and in those on AS with negative MRI results [22]. Multiple studies have illustrated that higher tPSA levels are correlated with an increased risk of adverse outcomes in AS candidates, likely due to upgrades from biopsy GG 1–3 to RP GG 4–5. Alongside tPSA, the perineural invasion was also a significant component of our predictive model. Perineural invasion, the invasion of PCa cells into the perineural space, has been linked to poor pathological outcomes and prognosis. It has been demonstrated as an independent predictor of biochemical recurrence (BCR) of PCa after localized treatment [23]. Furthermore, Kraus RD indicated that perineural invasion was related to pT2c PCa and associated with a higher RP GS [24]. Though Andrew R. Barsky showed that perineural invasion on prostate biopsy was not associated with GS upgrading at RP in pT2N0R0 PCa patients [25], our results indicated that perineural invasion was associated with GG upgrading in biopsy GG 1–3 patients. We suggested that the contradictory conclusion might be the differences in inclusion and exclusion criteria, while the research of Barsky et al. [25] excluded patients with pT 3–4 disease or positive margins.
By identifying the factors that predict GG upgrades and downgrades, this study offers valuable insights to assist urologists in making more informed treatment decisions. The study suggested that a standard 12-core needle prostate biopsy, without additional cores, does not increase the risk of GG upgrades. Furthermore, for patients with biopsy GG 1–3, the tPSA level is an independent predictor. For biopsy GG 1–3 patients with relatively high tPSA levels, urologists may need to consider the possibility of GG upgrades when making treatment decisions to optimize patient outcomes. For patients with the aforementioned risk factors, it is essential to inform them of their higher risk of GG upgrades compared to patients without these risk factors when selecting treatment options. Ensuring patients are fully informed enables them to make decisions that align more closely with their own interests. Fully informed patients also contribute to a better understanding of the physician’s treatment decisions, which enhances patient compliance and ultimately facilitates comprehensive management of PCa, thereby improving patient care quality. Our findings also indicate that patients undergoing upgrades from biopsy GG 1–3 to RP GG 4–5 are at a higher risk of neurovascular bundle (NVB) invasion, potentially making them unfit for NVB–sparing surgery.
As a retrospective study, our analysis has several limitations. First, we excluded all patients with an unknown GS or perineural invasion status, which may introduce bias. Second, we have not yet explored the relationship between GG upgrades and prognosis; this will be the focus of our future investigations. Third, the current study did not involve multiparametric MRI (mpMRI)–related parameters, as not all participants underwent mpMRI at our hospital, and we were unable to collect sufficient data for analysis. Future studies will include additional participants willing to provide more data on imaging examinations for further analysis. Furthermore, as all patients underwent transrectal biopsies, our findings must be validated for their applicability to patients undergoing transperineal prostate biopsies.
The GG 4 group demonstrated the lowest rate of concordance between biopsy and RP. Our analysis identified tPSA levels and perineural invasion as independent predictors of GG upgrading from biopsy GG 1–3 to RP GG 4–5 in PCa patients. These findings provide additional evidence to support more precise clinical decision-making.
5. Conclusion
The GG 4 group demonstrated the lowest rate of concordance between biopsy and RP. Our analysis identified tPSA levels and perineural invasion as independent predictors of GG upgrading from biopsy GG 1–3 to RP GG 4–5 in PCa patients.
Nomenclature
-
- RCC
-
- Renal cell carcinoma
-
- TT
-
- Tumor thrombus
-
- RNAT
-
- Radical nephrectomy and thrombectomy
-
- CSS
-
- Cancer-specific survival
-
- ICIs
-
- Immune checkpoint inhibitors
-
- TKIs
-
- Tyrosine kinase inhibitors
-
- VTT
-
- Venous tumor thrombus
-
- ccRCC
-
- Clear cell renal cell carcinoma
-
- CT
-
- Computed tomography
-
- MRI
-
- Magnetic resonance imaging
-
- mpMRI
-
- Multiparametric MRI
-
- ASA
-
- The American Society of Anesthesiologists
-
- Scr
-
- Serum creatine
-
- eGFR
-
- Estimated glomerular filtration rate
-
- IVC
-
- Inferior vena cava
-
- OS
-
- Overall survival
-
- IQR
-
- Interquartile range
-
- PSM
-
- Propensity score matching
-
- RBC
-
- Red blood cell
-
- FFP
-
- Fresh frozen plasma
Conflicts of Interest
The authors declare no conflicts of interest.
Author Contributions
Le Yu, Kewei Chen, and Min Lu contributed equally to this work.
Funding
This research was supported by the National Natural Science Foundation of China (82072828).
Acknowledgments
The authors acknowledge all the nurses in our center for their service and the patients who participated in this study.
Open Research
Data Availability Statement
The data that support the findings of this study are available from the corresponding author upon reasonable request.


