Machine Learning Developed a T Cell Exhaustion Transcription Factor Signature for Predicting Clinical Outcomes and Immunotherapy Response in Skin Cutaneous Melanoma
Abstract
Background: The persistence of CD8+ Tex in the tumor microenvironment and their interactions with tumor cells and other immune cells are the keys to tumor immune escape and treatment failure. Transcription factors play a key role in the regulation of gene expression in cells. Few studies have fully clarified the characteristics of T cell exhaustion transcription factors in SKCM.
Methods: In the TCGA, GSE54467, GSE59455, and GSE65904 cohorts, an integrative machine learning analysis procedure comprising 10 algorithms was performed to develop a T cell exhaustion transcription factor signature (TTS). The relevance of TTS in predicting the advantages of immunotherapy was assessed using a number of measures, including tumor immune dysfunction and exclusion (TIDE) score, tumor mutation burden (TMB) score, immunophenoscore, intratumor heterogeneity score, and three immunotherapy datasets (IMvigor210, GSE91061, and GSE78220).
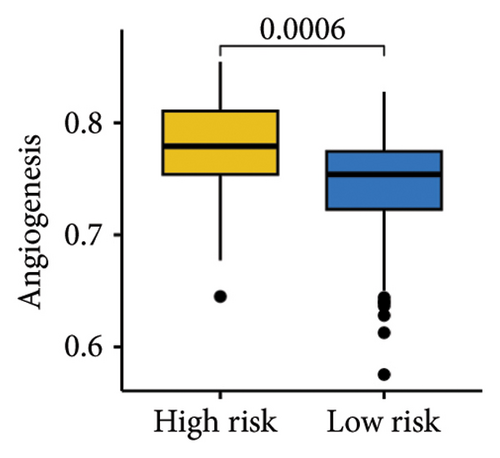
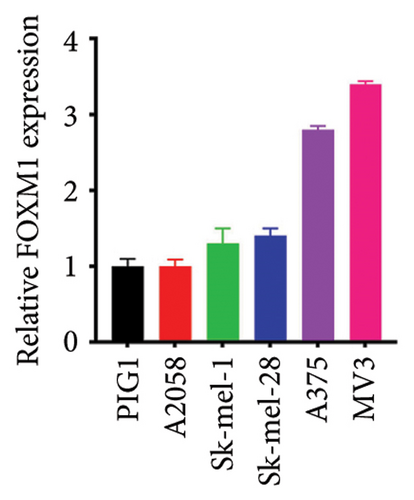
Results: The optimal prognostic TTS developed by the LASSO algorithm acted as an independent risk factor and had a stable and powerful performance in predicting the overall survival rate of SKCM patients, with the AUC of 1-, 3-, and 5-year ROC curve being 0.785, 0.812, and 0.839 in the TCGA cohort. SKCM patients with low TTS scores exhibited a lower TIDE score, lower immune escape score, lower intratumor heterogeneity score and higher TMB score, and higher PD1 and CTLA4 immunophenoscore. Gene sets implicated in angiogenesis, NOTCH signaling, hypoxia, and glycolysis exhibited lower scores in SKCM patients with low TTS scores. In vitro experiments showed that FOXM1 was upregulated in SKCM and knockout of FOXM1 inhibited tumor cell proliferation.
Conclusion: The current study constructed a novel TTS in SKCM, which acted as an indicator for predicting the clinical outcome and immunotherapy response of SKCM patients.
1. Introduction
Skin cutaneous melanoma (SKCM) is a malignant disease deriving from melanocytes and the incidence is rising [1]. Globally, there are projected to be over 331,000 new cases of SKCM and 58,000 fatalities associated with the disease in 2024 [2]. Some risk factors have been identified in SKCM, such as exposure to ultraviolet radiation; however, the mechanism of SKCM occurrence is still not fully clarified [3]. Treatments of SKCM include surgery, radiotherapy, targeted therapy, and immunotherapy, depending on the stage of the disease [4]. Immunotherapy has significantly improved the survival of SKCM patients after a string of historic approvals starting in 2011. When administered to individuals with an advanced disease, immunotherapy can produce an unparalleled, long-lasting response when compared to chemoradiotherapy. Nevertheless, only a tiny percentage of patients experience this reaction, and the impact varies widely throughout SKCM sufferers. The need to find novel methods for predicting which patients are intrinsically resistant to immunotherapy stems from these clinical issues. This can encourage the prudent use of clinical resources and better direct the therapeutic management of patients.
Dynamic interactions between SKCM and tumor microenvironment are vital for the heterogeneity and progression of SKCM. Tumor infiltrating lymphocytes, the vital component of the tumor microenvironment, show a significant correlation with response to immune checkpoint inhibition in SKCM [5]. A subset of tumor infiltrating lymphocytes known as CD8+ exhausted T cells (CD8+ Tex) is distinguished by its low capacity to eliminate pathogenic threats, block surface co-inhibitory receptors, and exhibit a low reactivity to antitumor immunotherapies [6]. The continued presence of CD8+ Tex in the tumor microenvironment, along with their interactions with tumor cells and other immune cells, plays a crucial role in tumor immune evasion and therapeutic failure [7, 8]. Transcription factors are proteins inside cells that play a key role in the regulation of gene expression in cells, thus determining the fate of cells. Increasing evidence has shown the vital role of transcription factors in T cell exhaustion. Transcription factor IRF8, expressed by tumor-associated macrophages, accelerated T cell exhaustion in cancer [9]. Moreover, NFAT encourages activated CD8+ T cells to run out of energy [10]. Nevertheless, the characteristics of T cell exhaustion transcription factors in SKCM have not been thoroughly elucidated by many research studies.
In our study, we performed a study to explore the prognostic role of T cell exhaustion transcription factors in SKCM and developed a T cell exhaustion transcription factor signature (TTS) with 10 machine learning methods. Valuations were also conducted on TTS’s predictive power for prognosis and immunotherapy benefits in patients with SKCM.
2. Materials and Methods
2.1. Datasets Sources
A similar method could be seen in a previous study [11]. From the TCGA database, bulk RNA-seq data of SKCM (n = 425) were extracted. Bulk RNA-seq data of normal skin samples were obtained from GTEx (https://www.gtexportal.org/home/). A further three Gene Expression Omnibus (GEO) datasets, GSE54467 (n = 79), GSE59455 (n = 122), and GSE65904 (n = 210), were utilized to assess the contribution of TTS to the clinical outcome prediction of patients with SKCM. The function of TTS in forecasting the advantages of immunotherapy for patients was investigated using three immunotherapy datasets (IMvigor210, n = 298; GSE91061, n = 98; and GSE78220, n = 28). The TISCH2 database (https://tisch.comp-genomics.org/) provided the scRNA-seq data of SKCM (GSE120575) [12].
2.2. Identification of Transcription Factors and Their Prognostic Role in SKCM
Identification of cell types and the transcription factors of CD8+ Tex relied on minor lineages (cell-type annotation) and the TF enrichment section of the TISCH2 database. Differentially expressed genes (DEGs) between SKCM and normal skin samples were explored with the “limma” package with the threshold value of |log fold change| ≥ 2 and p < 0.05. Univariate Cox analysis was conducted to explore the prognostic role of differentially expressed transcription factors in SKCM.
2.3. Development and Evaluation of a Prognostic TTS
Potential prognostic biomarkers were used to create a stable prognostic TTS using an integrative machine learning analysis. The process encompassed 10 machine learning techniques in total: random survival forest, elastic network, LASSO, ridge, stepwise Cox, CoxBoost, partial least squares regression for Cox, supervised principal components, generalized boosted regression modeling, and survival support vector machine. We developed the TTS in four steps by using the R scripts (https://github.com/Zaoqu-Liu/IRLS) from the earlier study [13]: (1) in order to investigate prognostic biomarkers in the TCGA dataset, univariate Cox regression was used, (2) a total of 90 algorithm combinations were then fitted to the prediction model of the TCGA dataset, (3) all algorithm combinations were carried out in GEO cohorts, and (4) the C-index was computed for each cohort. The detailed parameters of 10 machine learning algorithms are shown in Supporting Information. After obtaining the TTS score (risk score) of SKCM patients, the R package “survminer” contained the “surv_cutpoint” function, which was used to identify the optimal cutoff for separating SKCM patients into high and low TTS score groups. Using the “rms” software, we also computed the C-index curves for prognostic signatures and clinical features. The prognosis of SKCM was examined using univariate and multivariate Cox analyses to investigate the potential risk factors.
2.4. Immunotherapy Benefits Analysis and Gene Set Enrichment Analyses
The R package “immunedeconv” was used to assess the immunological abundance of each SKCM case [14]. The immune and ESTIMATE scores of the SKCM case were determined using the R package “estimate” [15]. To determine the gene set score associated with immune-related functions, cancer-related hallmarks, tumor escape, and surveillance score of SKCM cases, single-sample gene set enrichment analysis (ssGSEA) was performed. The Molecular Signatures Database (MSigDB) provided the gene sets associated with cancer hallmarks. The usefulness of TTS in forecasting the advantages of immunotherapy was evaluated using a number of prediction scores, including tumor immune dysfunction and exclusion (TIDE) score from TIDE (https://tide.dfci.harvard.edu) [16], tumor mutation burden (TMB) from the TCGA database, immunophenoscore (IPS) from The Cancer Immunome Database (https://tcia.at/home) [17], intratumor heterogeneity score being calculated with DEPTH2 [18], and immune escape score being calculated with gene set from the previous study [19]. We next used the “oncoPredict” R package to determine the IC50 of medications of SKCM cases based on data from Genomics of Drug Sensitivity in Cancer (https://www.cancerrxgene.org/).
2.5. Cell Culture and Cell Transfection
The melanoma cell lines (A375, A2058, MV3, Sk-mel-1, and Sk-mel-28) and the normal skin cell line (PIG1) from the Cell Bank of the Chinese Academy of Sciences (Shanghai, China) were propagated in RPMI-1640 medium supplemented with 10% FBS (Procell) and 1% antibiotics (Procell). si-FOXM1 and si-NC from Ribobio (Guangzhou, China) were individually transduced into melanoma cell lines for the knockdown of FOXM1.
2.6. Quantitative Real-Time Polymerase Chain Reaction (qRT-PCR)
Triquick Reagent (Solarbio, Beijing, China) was used for total RNA segregation. Following this, the cDNA of FOXM1 was amplified from RNA using the SweScript RT I FTTSt Strand cDNA Synthesis Kit (Servicebio, Wuhan, China). The produced cDNA was then used for qRT-PCR on a PCR system utilizing 2× SYBR Green qPCR Master Mix (low ROX) (Servicebio) and certain primers. Utilizing the 2−ΔΔCt method, the RNA abundance of FOXM1 was calculated and normalized to the inner contrast GAPDH level. The primer sequences were as follows: GAPDH-F, GTCTCCTCTGACTTCAACAGCG; GAPDH-R, ACCACCCTGTTGC TGTAGCCAA; FOXM1-F, TCTGCCAATGGCAAGGTCTCCT; and FOXM1-R, CTGGATTCGGTCGTTTCTGCTG.
2.7. Cell Counting Kit-8 (CCK-8) Assay
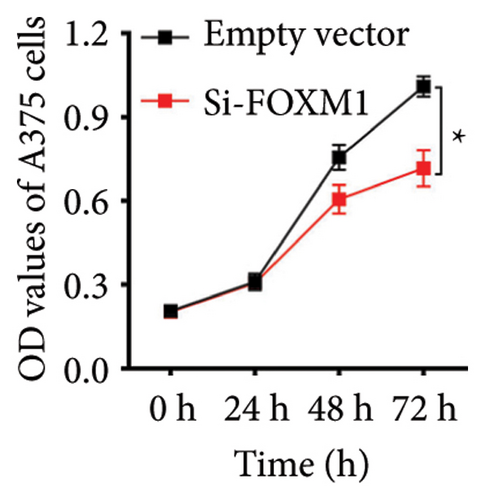
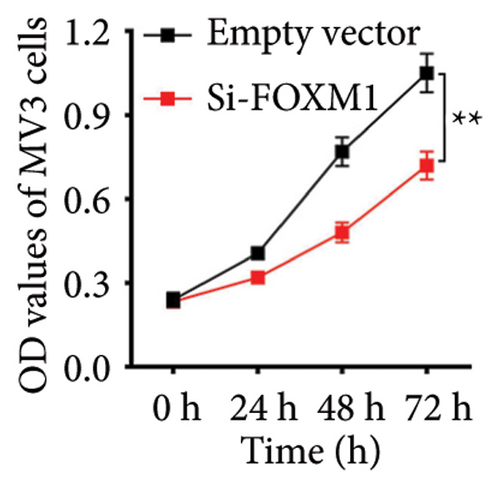
In order to assess viability, transduced A375 and MV3 cells were grown in 96-well plates for 24, 48, or 72 h. Following this, CCK-8 solution (Servicebio) was added to each well and incubated for 4 h at 37°C. Ultimately, an OD value was obtained at 450 nm using a microplate reader.
2.8. Statistical Analysis
The software utilized for all statistical analyses was R (Version 4.2.1). The difference between continuous variables was assessed using either the Student’s t-test or the Wilcoxon rank-sum test. Pearson’s correlation analysis was used to evaluate the connections between two continuous variables. The differences in the Kaplan–Meier survival curve were examined using the two-sided log-rank test.
3. Results
3.1. Identification of Transcription Factors and Their Prognostic Role in SKCM
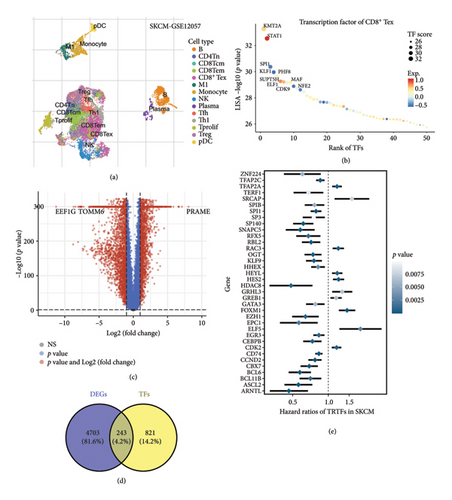
We first used the single-cell dataset GSE120575 to identify the CD8+ Tex cells in SKCM (Figure 1(a)). A total of 1064 transcription factors of CD8+ Tex cells were obtained in SKCM (Figure 1(b) and Supporting Table 1). We also explored the DEGs in SKCM, which found 4946 DEGs (Figure 1(c), p < 0.05). These DEGs included 243 transcription factors (Figure 1(d)). Thirty-seven genes among differentially expressed transcription factors were discovered to have a significant correlation with the prognosis of SKCM cases in univariate Cox analysis (Figure 1(e)).
3.2. TTS Developed With Integrative Machine Learning Analysis
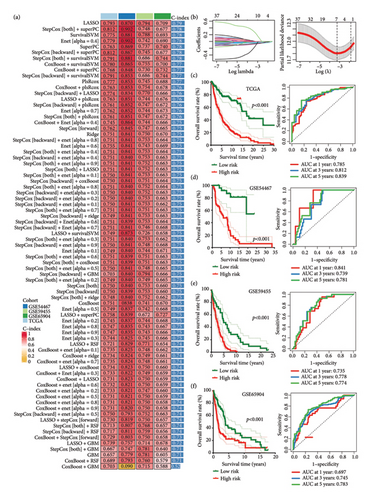
The above 37 potential prognostic biomarkers were subjected to an integrative machine learning analysis procedure to develop a stable prognostic TTS. As a result, a total of 77 kinds of prognostic models were generated and the C-index of each prognostic model is shown in Figure 2(a). We found that TTS developed by the LASSO method exhibited the highest average C-index of 0.79. The LASSO-based TTS was considered as the optimal TTS. Based on the LOOCV framework, the ideal λ for the LASSO regression was determined when the partial likelihood deviance approached the minimal value (Figure 2(b)). Based on LASSO regression analysis, the optimal TTS was built using 7 genes, and the TTS score (risk score) of SKCM cases was computed using the following method: 0.0181 × TFAP2Cexp + (−0.023) × KLF9exp + 0.0514 × CDK2exp + (−0.0799) × CEBPBexp + 0.0091 × HDAC8exp + 0.1610 × FOXM1exp + 0.0789 × EPC1exp. The optimal cutoff value was used to divide the SKCM cases in each cohort into a high TTS score group and a low TTS score group. In the TCGA, GSE54467, GSE59455, and GSE65904 cohorts (Figures 2(c), 2(d), 2(e), and 2(f), all p < 0.05), a higher TTS score was associated with a lower overall survival rate in SKCM. The AUC of the 1-, 3-, and 5-year ROC curve was 0.785, 0.812, and 0.839 in the TCGA cohort (Figure 2(c)); 0.841, 0.739, and 0.781 in the GSE54467 cohort (Figure 2(d)); 0.735, 0.778, and 0.774 in the GSE59455 cohort (Figure 2(e)); and 0.697, 0.745, and 0.783 in the GSE65904 cohort (Figure 2(f)), respectively.
3.3. Evaluation of the Performance of TTS
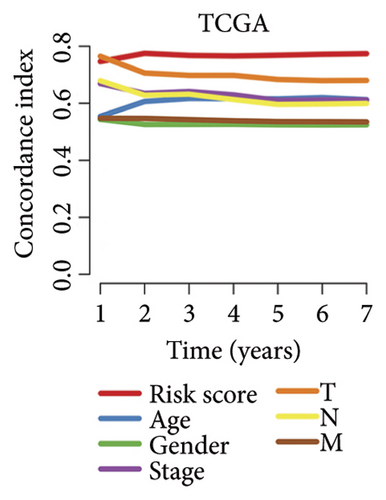
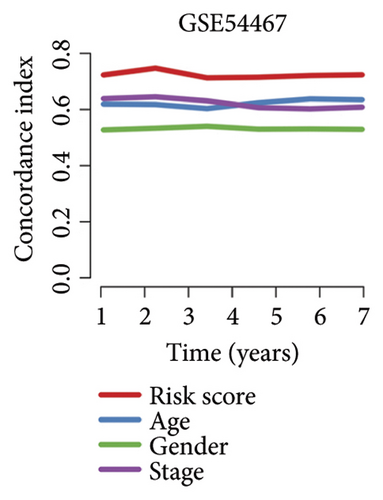
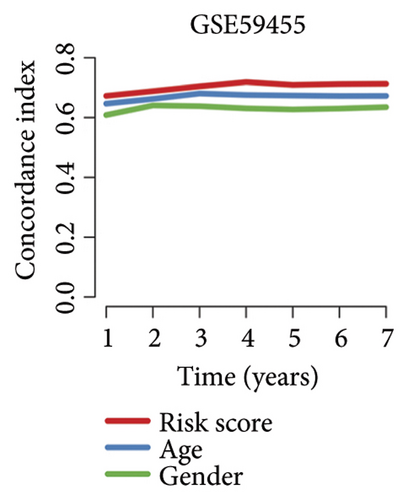
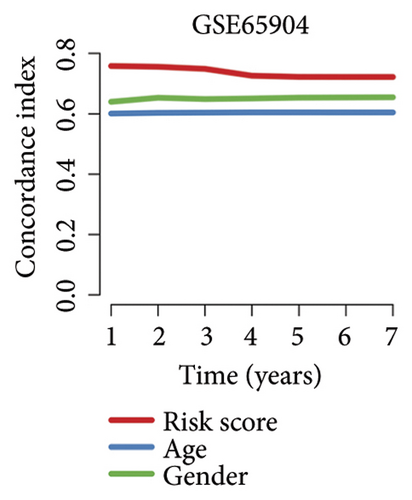
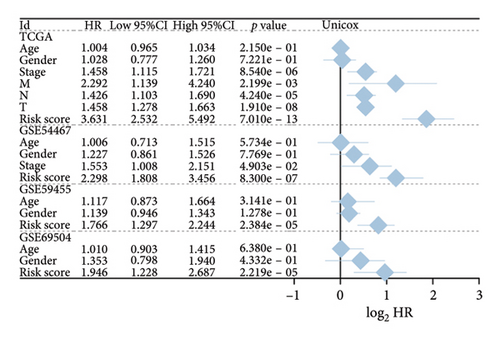
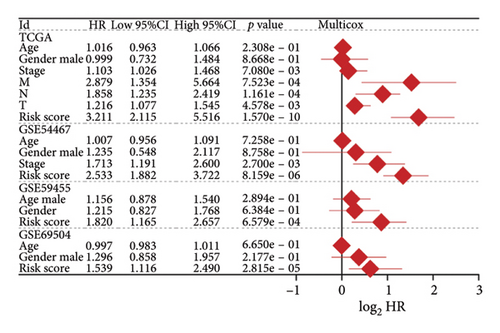
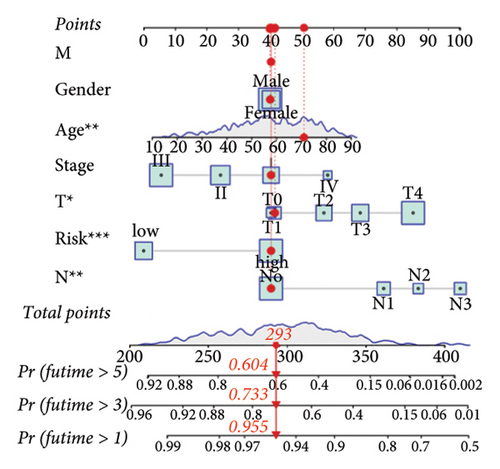
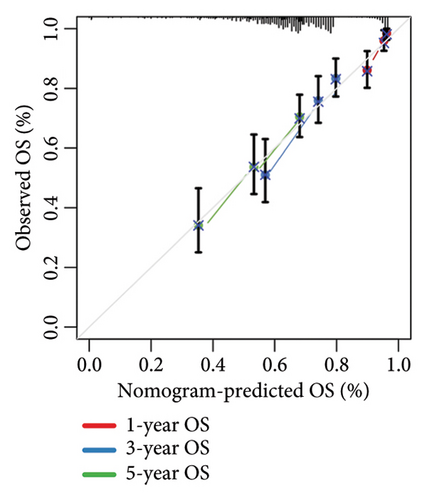
We then computed the C-index of TTS and clinical characteristics of SKCM patients in order to assess how well TTS and other clinical characteristics predicted the clinical outcome of SKCM patients. As a result, the C-index of TTS was higher than that of clinical characteristics, including age, gender, clinical stage and pT, pN, and pM stages, in the TCGA and all the GEO cohorts, as Figures 3(a), 3(b), 3(c), and 3(d) illustrates. In TCGA and all the GEO cohorts, univariate and multivariate Cox regression analyses showed TTS as an independent risk factor for the clinical outcome of SKCM cases (Figures 3(e) and 3(f), all p < 0.05), suggesting that the TTS has a strong and consistent performance in predicting the clinical outcome of SKCM patients. We constructed a nomogram including clinical characteristics and TTS (Figure 3(g)). The actual 1-, 3-, and 5-year survival periods were found to be very compatible with the anticipated survival times based on calibration plots (Figure 3(h)).
3.4. Correlation Between TTS and Tumor Immune Microenvironment
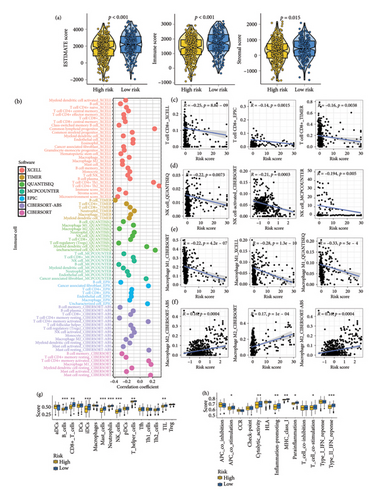
In SKCM, a low TTS score suggested a greater stromal score, immune score, and ESTIMATE score (Figure 4(a), all p < 0.05). The overall relationships between TTS and immune cell abundance are displayed in Figure 4(b). We discovered that the TTS score exhibited a negative correlation with the quantity of immune-activated cells, such as CD8+ T cells (Figure 4(c)), NK cells (Figure 4(d)), and macrophage M1 (Figure 4(e)), and a positive link with the abundance of macrophage M2 (Figure 4(f)). The results of ssGSEA analysis are shown in Figure 4(g), suggesting a larger abundance of CD8+ T cells, B cells, iDCs, mast cells, neutrophils, NK cells, and Tumor Infiltrating Lymphocytes in SKCM with low TTS score. Moreover, a low TTS score indicated gene set score correlated with antigen-presenting cell (APC) co-stimulation, cytolytic activity, promoting inflammation, and T cell co-stimulation (Figure 4(h)).
3.5. TTS as an Indicator for Predicting Immunotherapy Response in SKCM
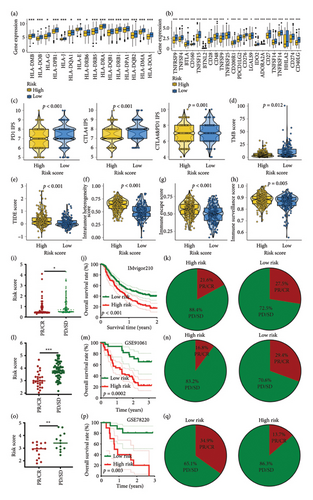
Elevated expressions of HLA-related genes predicted a higher chance of immunotherapy benefits [20]. Most HLA-related gene expressions were higher in SKCM patients with low TTS scores (Figure 5(a), all p < 0.05). A higher expression of immunological checkpoints suggested a higher likelihood of benefiting from immunotherapy. Low TTS score in SKCM was associated with increased expression of many immunological checkpoints, as Figure 5(b) illustrated (all p < 0.05). Increased TMB score and IPS score suggested a greater likelihood of benefiting from immunotherapy. In Figures 5(c) and 5(d) of our study, low TTS scores indicated higher scores of PD1 and CTLA4 IPS and TMB scores in SKCM (all p < 0.05). A stronger response to immunotherapy was indicated by low TIDE and immune escape scores [16, 21]. Additional investigation revealed that SKCM patients with low TTS scores had lower TIDE scores, ITH scores, immune escape scores, and immune surveillance scores (Figures 5(e), 5(f), 5(g), and 5(h), all p < 0.05). Thus, patients with SKCM who have a low TTS score may therefore benefit more from immunotherapy. Three immunotherapy cohorts, including IMvigor210 (urothelial carcinoma), GSE91061 (SKCM), and GSE78220 (SKCM), were used to further verify our results. In IMvigor210 cohorts, the TTS score of nonresponders in SKCM was substantially greater than that of responders, as Figure 5(i) illustrates. Subsequent investigation revealed a better clinical outcome and higher immunotherapy response rate in the low TTS score group (Figures 5(j) and 5(k), p < 0.05). Similar results were obtained in GSE91061 and GSE78220 cohorts (Figures 5(l), 5(m), 5(n), 5(o), 5(p), and 5(q), all p < 0.05). In the treatment of SKCM, chemotherapy and targeted therapy were also essential components. We discovered that SKCM patients with higher TTS scores had lower IC50 values for 5-fluorouracil, camptothecin, epirubicin, gemcitabine, paclitaxel, oxaliplatin, nilotinib, axitinib, crizotinib, erlotinib, savolitinib, and foretinib (Figures 6(a), and 6(b), all p < 0.05), indicating that patients with SKCM who scored highly on the TTS responded better to targeted treatment and chemotherapy.


3.6. Gene Sets Score of the TTS Score Group
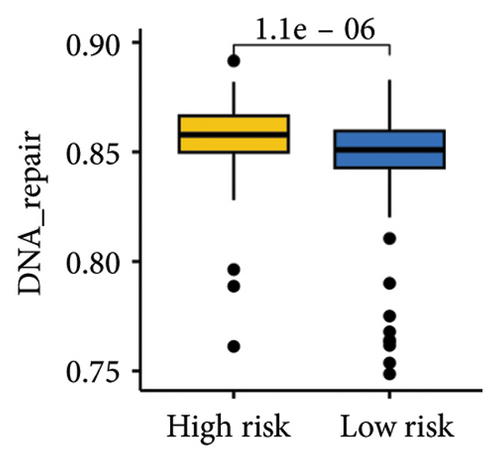
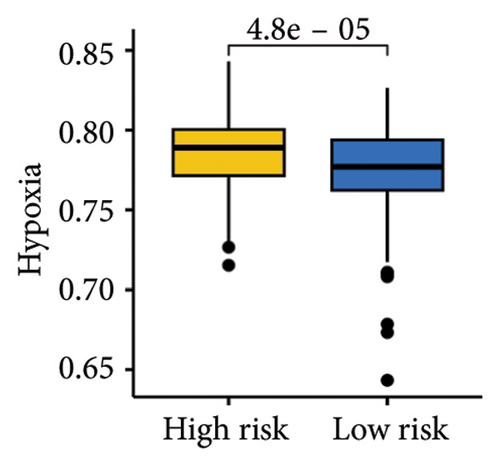
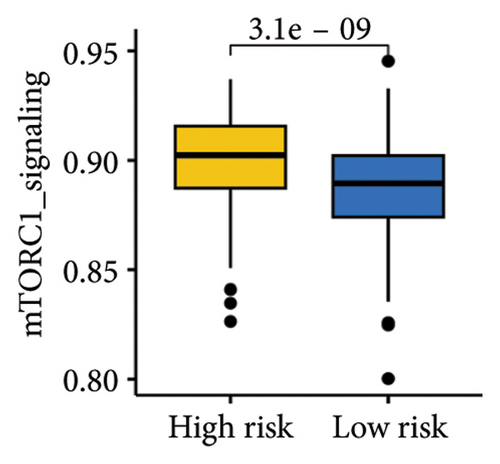
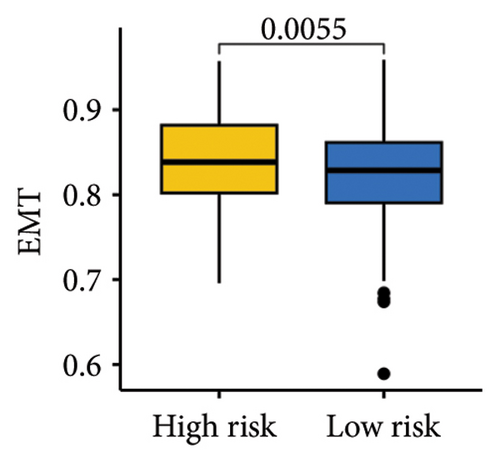
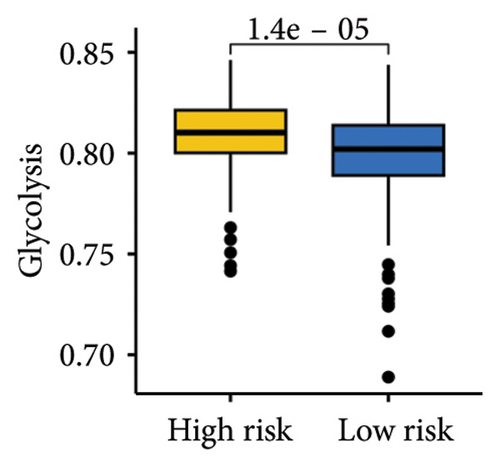
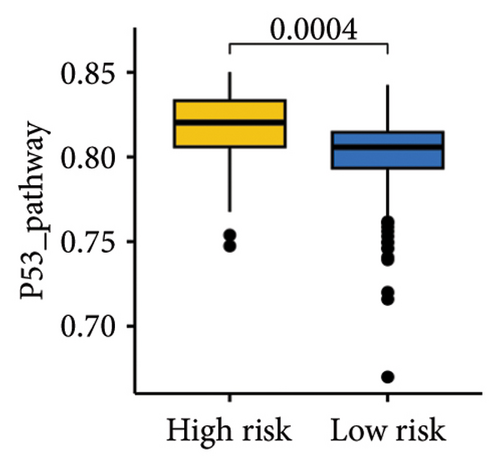
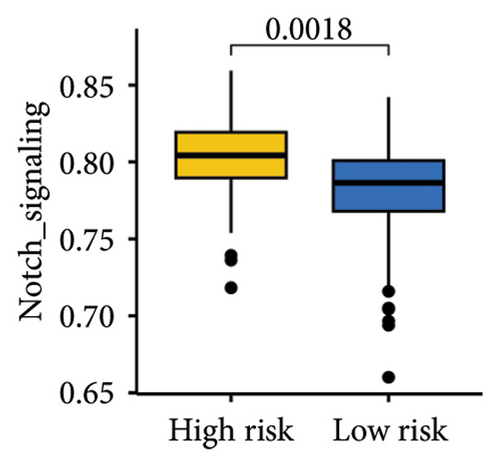
The gene sets scoring for angiogenesis, DNA repair, hypoxia, mTORC1 signaling, epithelial–mesenchymal transition signaling, glycolysis, P53 pathway, and NOTCH signaling was lower in SKCM patients with low TTS scores (Figures 7(a), 7(b), 7(c), 7(d), 7(e), 7(f), 7(g), and 7(h), all p < 0.05).
3.7. Biological Functions of the Selected Gene
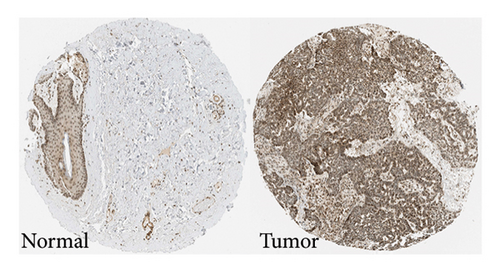
We chose FOXM1, which made the largest contribution to TTS, for additional examination in order to confirm the effectiveness of TTS even more. Our first analysis of FOXM1 expression in SKCM cell lines revealed that it was expressed more often in these lines (Figure 8(a)). Figure 8(b) displays the typical immunohistochemistry of FOXM1 in both normal and SKCM tissues. The CCK-8 assay results in the follow-up investigation demonstrated that overexpression of FOXM1 clearly suppressed the proliferation of A375 and MV3 (Figures 8(c) and 8(d)).
4. Discussion
In our study, we developed a TTS for SKCM using 10 integrated machine learning procedures. In the TCGA, GSE54467, GSE59455, and GSE65904 cohorts, the TTS developed using the LASSO algorithm served as an independent risk factor for SKCM and showed consistent and strong performance in forecasting the overall survival rate of SKCM cases. In addition, we discovered that TTS served as a predictor of the advantages of immunotherapy.
The optimal TTS contains seven potential prognostic biomarkers (TFAP2C, KLF9, CDK2, CEBPB, HDAC8, FOXM1, and EPC1). These biomarkers also play a vital role in the development of SKCM. TFAP2C is involved in the melanoma tumor progression [22]. KLF9-dependent ROS regulates the progression of SKCM in a stage-specific manner [23]. Upregulation of KLF9 promotes the antitumor properties of paclitaxel in SKCM lines [24]. Targeting CDK2 overcomes SKCM resistance against BRAF and Hsp90 inhibitors [25]. CEBPB is associated with a positive prognosis for metastatic SKCM and an active tumor immune environment. [26]. In our study, we also find that FOXM1 is upregulated in SKCM, and the knockdown of FOXM1 inhibits the proliferation of SKCM cells, which is similar to the previous study [27]. Melanoma brain metastasis is increased by a transcriptional state driven by HDAC8-mediated suppression of EP300 [28]. Studies about EPC1 in SKCM are limited. However, previous studies showed that EPC1 played a vital role in the development of other types of cancer. Knockdown of EPC1 inhibited the growth and metastasis of nasopharyngeal carcinoma [29]. EPC1 served as a prognostic biomarker in head and neck squamous cell carcinoma [30].
One of the most promising treatment approaches for cancer, including SKCM, has been proposed to be immunotherapy [31]. A higher TMB suggests an improved immunotherapy response [32, 33]. A lower TIDE score suggests a lower chance of immunological escape [16]. A higher immunophenoscore suggests a greater likelihood of benefiting from immunotherapy. In our study, SKCM patients with low TTS scores exhibit a lower TIDE score, lower immune escape score, lower intratumor heterogeneity score and higher TMB score, and higher PD1 and CTLA4 immunophenoscore. Therefore, TTS may serve as a predictor of the benefits of immunotherapy for patients with SKCM, and a lower TTS score indicates a better prognosis for immunotherapy. By calculating the TTS score of SKCM patients in real-world clinical situations, we can predict the possible benefits of immunotherapy by considering the expression of each gene in TTS. However, in SKCM patients, the expression of several TTS genes may not be recognized, which has an impact on the TTS score computation and clinical use of TTS.
The gene sets scoring for angiogenesis, DNA repair, hypoxia, mTORC1 signaling, epithelial–mesenchymal transition signaling, glycolysis, P53 pathway and NOTCH signaling are all lower in SKCM patients with low TTS scores. A crucial stage in the formation of SKCM is angiogenesis [34]. In SKCM, the glycolysis regulator PFKP may have aided tumor development and cell proliferation [35]. In SKCM, hypoxia has been proposed as a factor in both treatment resistance and tumor growth [36]. Through controlling TGF-β1, NOTCH signaling in SKCM facilitated tumor-induced immunosuppression [37]. A poor clinical outcome could result from SKCM patients with high TTS scores being more active in these cancer-related characteristics.
There were certain limitations to our investigation. The TTS in testing and training cohorts were retrieved from several databases. Heterogeneity could still exist even if the data were standardized before analysis. There was no internal clinical cohort to validate the TTS. To make sure that our findings are reliable, it would be preferable to carry out research in additional cell lines or to confirm the roles of additional genes of TTS. The roles and possible processes of TTS genes in SKCM could be the subject of future research.
5. Conclusion
The current study constructed a novel TTS in SKCM, which acted as an indicator for predicting clinical outcomes and immunotherapy responses of SKCM patients, supporting its potential application value in the stratified management of SKCM patients. Further study should be focused on the potential molecular mechanism of FOXM1 SKCM.
Conflicts of Interest
The authors declare no conflicts of interest.
Author Contributions
Zhaosheng Sun and Yanyun Wu contributed equally.
Funding
The authors received no specific funding for this work.
Acknowledgments
The authors have nothing to report.
Supporting Information
Additional supporting information can be found online in the Supporting Information section.
Open Research
Data Availability Statement
Data and materials are available from the TCGA dataset (https://tcga-data.nci.nih.gov/tcga/) and GEO (https://www.ncbi.nlm.nih.gov/gds).


