RWP-NSGA II: Reinforcement Weighted Probabilistic NSGA II for Workload Allocation in Fog and Internet of Things Environment
Abstract
The explosion of the IoT and the immense increase in the number of devices around the world, as well as the desire to meet the quality of service in the best way possible, have challenged cloud computing. Fog computing has been introduced to reduce the distance between the IoT and the cloud and to process time-sensitive tasks in an efficient and speedy manner. IoT devices can process a portion of the workload locally and offload the rest to the fog layer. This workload is then allocated to the fog nodes. The distribution of workload between IoT devices and fog nodes should account for the constrained energy resources of the IoT device, while still prioritizing the primary objective of fog computing, which is to minimize delay. This study investigates workload allocation in the IoT node and the fog nodes by optimizing delay and energy consumption. This paper proposes an improved version of NSGA II, namely, reinforcement weighted probabilistic NSGA II, which uses weighted probabilistic mutation. This algorithm replaces random mutation with probabilistic mutation to enhance exploration of the solution space. This method uses domain-specific knowledge to improve convergence and solution quality, resulting in reduced delay and better energy efficiency compared to traditional NSGA II and other evolutionary algorithms. The results demonstrate that the proposed algorithm reduces delay by nearly 2 s while also achieving an improvement in energy efficiency, surpassing the state of the art by nearly 3 units.
1. Introduction
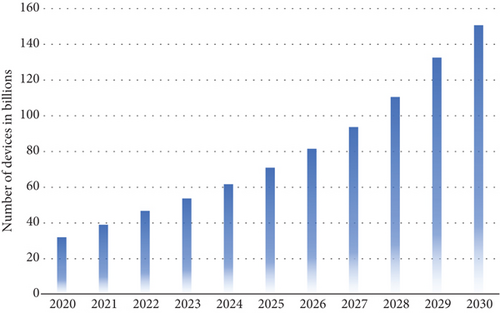
The Internet of Things (IoT) has led to a surge in the number of devices globally. Wearable devices, sensors in smart cities, and smart vehicles have all contributed to reaching 50 billion devices in 2020 [1], with projections estimating 150 billion by 2030. Figure 1 illustrates the forecasted growth of devices from 2020 to 2030 [2]. These devices generate substantial computational demands, which are typically handled by cloud servers [3, 4]. However, the cloud struggles to meet the needs of delay-sensitive applications due to the multiple hops a packet must traverse to and from the cloud server [5–7].
Previous studies and challenges in workload allocation for IoT devices have utilized various optimization techniques [8, 9]. These approaches are aimed at enhancing computational efficiency by minimizing the number of hops and reducing latency through fog computing [10, 11]. However, effectively managing the substantial workload from IoT devices at the fog layer remains a critical challenge [12, 13]. Efficient allocation of this workload to fog nodes is essential for achieving both low delay and optimal energy consumption [14, 15]. Despite advancements, previous research has struggled to strike a balance between these dual objectives, highlighting the complexity and importance of optimizing workload allocation strategies in fog computing environments.
This paper bases on nondominated sorting genetic algorithm II (NSGA II) and proposes an improved version, namely, reinforcement weighted probabilistic NSGA II (RWP-NSGA II). The decision to enhance NSGA II with RWP-NSGA II was driven by several factors. NSGA II is renowned for its effectiveness in multiobjective optimization and has been tested in state-of-the-art workload allocation in fog computing [14, 16, 17]. This established track record provided a solid foundation for improvement. By introducing probabilistic mutation in RWP-NSGA II, we aim to refine the algorithm’s ability to balance objectives like minimizing delay and reducing energy consumption.
- •
Introduced RWP-NSGA II, an enhanced version of the traditional NSGA II algorithm
- •
Developed a probabilistic mutation approach that ranks gene importance and determines mutation probabilities
- •
Prioritized gene mutations based on importance to balance exploration and exploitation effectively
- •
Conducted a comprehensive performance evaluation, comparing RWP-NSGA II against original NSGA II and benchmarking it against RNSGA II, NSGA III, RNSGA III, and CTAEA
- •
Demonstrated significant improvements in minimizing delay and reducing energy consumption in workload allocation tasks
- •
Showed that the proposed algorithm maintains a lower delay and energy consumption with increasing amounts of workload compared to other evolutionary algorithms
2. Related Work
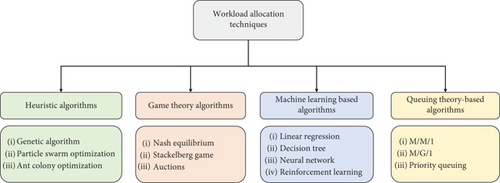
The workload allocation optimization scheme has been covered in previous studies using a variety of algorithms [18, 19] that can be categorized into four categories: heuristic algorithms, game theory–based algorithms, machine learning (ML)–based algorithms, and queuing theory–based algorithms. The taxonomy is shown in Figure 2. Table 1 presents a summary of the state of the art covered.
| Ref # | Year | Algorithm | Optimization metric | Adv/Dis | |
|---|---|---|---|---|---|
| Heuristic | This work | 2024 | RWP-NSGA II |
|
+Outperforms the work proposed in [16, 20] that uses similar approaches and the same optimization metrics |
| [20] | 2023 |
|
|
+Compared several evolutionary algorithms | |
| [16] | 2021 | NSGA II |
|
+Took both energy consumption and delay into consideration | |
| [21] | 2023 | AI based meta heuristic |
|
+Integrated AI and blockchain | |
| [22] | 2020 | ACO | Execution time | −Performance might be subject to the parameter set | |
| Game theory | [23] | 2022 | Proposed game theory approach | Response time | −Optimization has been done considering a single optimization metric |
| [10] | 2021 | Game theory |
|
−Assumptions that all fog nodes have the same processing capability and that the workload arrival rate is known in advance | |
| ML | [24] | 2024 | Deep reinforcement learning |
|
|
| [25] | 2021 | Proposed reinforcement learning–based algorithm |
|
−Requires a large dataset for training | |
| [26] | 2021 | Linear regression, decision tree, neural network, and a proposed model |
|
−The model is tested according to the dataset instances only, so generalization might be an issue | |
| Queuing theory | [27] | 2022 | Queuing theory | Response time | −Optimization has been done considering a single optimization metric |
| [28] | 2021 | Queuing theory | Resource utilization | +Considers the resource utilization | |
Heuristic algorithms are problem-solving methods that use practical, efficient, and intuitive approaches to find good solutions to complex problems. These algorithms provide a practical solution rather than an optimal one. In the context of workload allocation for fog computing, heuristic algorithms can be used to find a trade-off between several optimization metrics. Examples of these algorithms include the genetic algorithm (GA), ant colony optimization (ACO), and particle swarm optimization (PSO). Some of the previous work has used traditional algorithms to optimize the workload, while others have combined more than one algorithm [29]. In the work proposed in [16], the authors used NSGA II to allocate the workload that comes from IoT devices to the fog nodes. The authors in [8] used the PSO algorithm to allocate tasks in the fog nodes. The study in [22] combined GA and ACO. Although these algorithms provide an acceptable solution, they are sensitive to the parameter set. Optimizing these parameters in a dynamic way is yet to be investigated.
Game theory is a mathematical framework for analyzing decision-making processes in which multiple parties interact with each other, and it is particularly useful for modeling situations in which the decisions made by one party affect the decisions made by other parties. In the fog environment, game theory algorithms model the interactions among fog nodes as a noncooperative game, where each fog node acts selfishly to maximize its own payoff. The goal of the algorithm is to achieve a fair and efficient allocation of workload among the fog nodes. The research conducted in [23] has proposed a framework based on the game theory approach to optimize the resource utilization of fog nodes and the communication cost. The authors in [10] used a game theory algorithm to model the vehicle IoT. The proposed game theory algorithms are computationally intensive and require significant processing power, making them unsuitable for low-power fog nodes with limited resources.
ML algorithms can be powerful in these problems and adapt to changing network conditions [25], especially with deep learning and reinforcement learning algorithms that can provide good solutions to complex problems. However, the main limitations of these algorithms are that they require the availability of large datasets. In addition, the experiments are conducted on a limited dataset, and it remains to be seen how the algorithm will perform in a real-world deployment [26].
Queuing theory is a mathematical approach used to study systems that involve the arrival, service, and departure of customers [30]. It is used to model the behavior of systems where customers arrive randomly and are served based on some priority or scheduling rule. The authors in [27, 28] have used queuing theory to model workload allocation in the fog environment. However, these papers have used a single optimization parameter, while the workload allocation paradigm in fog computing is a multiobjective problem.
3. System Modeling
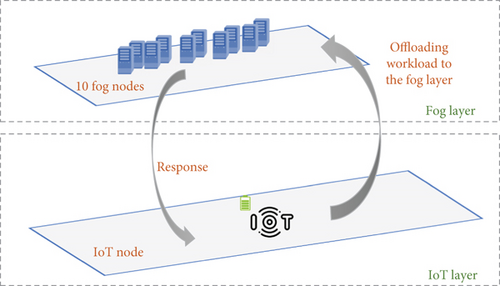
The system considered consists of 10 fog nodes and a single IoT device. The system is represented in Figure 3. Table 2 presents the notations used throughout this study. Please note that the system modeling equations follow the work in [16, 20] in order to compare the end results.
| Notation | Description |
|---|---|
| l | Overall workload |
| lmin | Minimum size of the workload processed by the terminal node |
| lmax | Maximum size of the workload processed by the terminal node |
| lf | Workload offloaded to be processed in the fog node |
| lt | Workload processes at the terminal node |
| Bi | Spectral efficiency of the link between the terminal and fog |
| Bw | Bandwidth between fog and terminal nodes |
| γi | The loss of the path |
| ki | The wireless link shadowing factor |
| Ii | The power of the interference |
| N0 | Noise spectral density |
| prf | The probability that a fog node is available |
| Pi | Transmission power between terminal and fog |
| nt | Cycle per bit in the CPU of the terminal node |
| nf | Cycle per bit in the CPU of the fog node |
| ft | The frequency of the terminal node CPU |
| ff | The frequency of the fog node CPU |
| θt | Energy consumed for a cycle of CPU of the terminal node |
| θf | Energy consumed for a cycle of CPU of the fog node |
| df | Delay of processing workload in the fog node |
| dt | Delay of processing workload in the terminal node |
| dtrans | Delay of transmitting the workload between the fog and the terminal |
| dtotal | Total delay of workload processing and transmission |
| Ef | Energy consumed in the fog node |
| Et | Energy consumed in the terminal node |
| Etrans | Energy consumed in transmission between fog and terminal |
3.1. Workload
The entire workload is referred to as l, and it is given that ([lminlmax]ϵl). This workload arrives first to the terminal node. The terminal node then, if enough resources are available, processes a part of it that is denoted by lt and transmits the rest to the fog node to be processed there. We denote the workload processed by the fog node as lf. Note that l = lf + lt.
3.2. Delay
3.3. Power Consumption
4. Problem Formulation
- •
Workload size: This is the total number of computational tasks generated by the IoT device referenced as the workload l.
- •
IoT and fog energy capacity: This is given through the necessary parameters to calculate the energy consumption as detailed in the equations.
- •
Network characteristics: This includes the parameters such as bandwidth and link efficiency as detailed in the equations of transmission.
- •
Workload allocation ratio: This is the portion of each task to be processed locally by the IoT device and the portion to be offloaded to the fog nodes while minimizing delay and energy consumption.
- •
Optimized workload allocation: This is the optimal proportion of tasks to be processed locally on the IoT device and the portion offloaded to the fog nodes, achieving minimum delay and energy consumption.
5. Proposed Framework
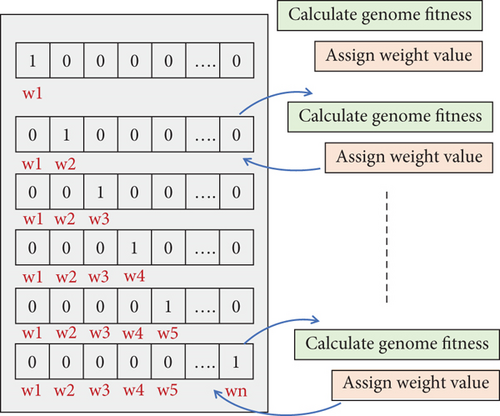
The allocation of workload to the terminal or fog nodes is a multiobjective problem that requires adequate optimization methods. The NSGA II algorithm has been widely and successfully used in many optimization problems [16, 20]. This algorithm starts with a random allocation of resources and then performs a set of genetic operations to generate new generations that improve the allocation model until a nearly optimal solution is reached. Genetic operations include crossover and mutation. The mutation operation takes place after the crossover, which crosses the genes of two parents. Mutation then changes random genes from 1 to 0 or from 0 to 1. This is aimed at increasing the diversity of genes from one generation to another. This study proposes an improvement on the NSGA II algorithm, which is a probabilistic mutation. This means that instead of mutating a random gene, we intend to follow a probabilistic rule for choosing the gene to mutate. This approach is based on weighing the genes to give them probability values for mutation. The first step starts with ranking the genes to assign weight values to them. We define a genome that takes 1 in the first position while the rest of the positions are set to 0. Then, the ranking of this genome is done by calculating its fitness value and assigning a weight value to it. In the second round, the second position is set to 1 and the rest of the positions are set to 0. Then, the fitness is calculated, and the weight of the second gene is assigned, and so on, until every position possesses a weight value. Figure 4 shows the process of ranking the genes and assigning weights to them.
- •
The gene weight is above the threshold: If the gene weight is above the threshold which signifies a high rank, meaning the gene is likely to have an impact on the result if mutated, we increase the probability of this gene’s mutation in the future.
- •
The gene weight is below the threshold: If the gene weight is below the threshold, this means that the gene tends to have less impact on the results. Hence, we decrease the probability of this gene’s mutation in the future.
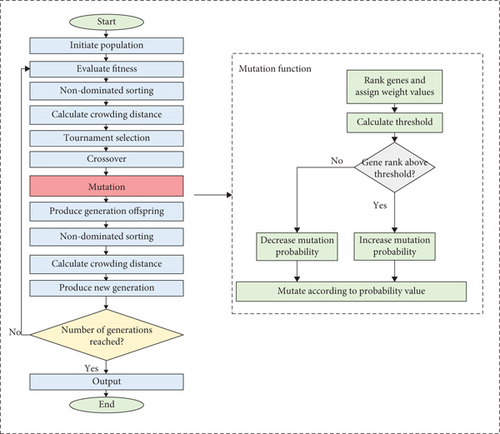
Figure 5 shows the flowchart of the proposed improvement on NSGA II. The left side of the figure shows the main flow of the algorithm, while the right side presents the details of the proposed probabilistic mutation. The mutation starts with ranking genes and assigning weight values to them. Then, the threshold value is calculated to define the genes with high weight values and those with low weight values. Next, the probabilities of mutation are either increased or decreased according to the rank value. A high probability means that the gene has a high likelihood of being mutated. On the other hand, a low probability indicates that the gene is less likely to be mutated. The initial probability of any gene being mutated is 0.5. A high probability and a low probability are expressed by increasing or decreasing the value of the initial probability by a value of ε. We initially set ε = 0.01; however, this value shall be tuned experimentally.
6. Implementation and Evaluation
6.1. Simulation Parameters
The simulation parameters follow the work done in [16, 20]. The load l that is coming to the IoT and fog devices varies from 2 to 8 MB. The IoT device takes a load lt that is executed locally. Then, the rest of the load that is lf where lf = l − lt is transferred to the fog nodes. The lt and lf variables are not fixed, rather they are optimized by the RWP-NSGA II algorithm that chooses the allocation solution that will minimize the delay and the energy consumption. Table 3 shows the simulation parameters.
| Parameter | Value |
|---|---|
| lmin | 2 |
| lmax | 8 |
| l | lmin − lmax |
| nt | 1000 |
| ft | 2 |
| nf | Between 200 and 2000 |
| ff | Between 1 and 15 |
| W | Between 10 and 90 |
| ki | −5 |
| Ii | 43 |
| n0 | 173 |
| θf | Between 1 × 10⁻¹⁰ and 10 × 10−10 |
| θt | 5 × 10⁻¹⁰ |
The simulation considers a scenario with a single IoT device and 10 fog nodes. The fog nodes have different specifications in terms of CPU frequency and computational capabilities.
6.2. RWP-NSGA II Implementation
- i.
Gene ranking
- ii.
Calculating threshold
- iii.
Modifying the probability value of mutation
6.2.1. Gene Ranking
This study uses the Python Pymoo package to implement RWP-NSGA II. This package is open source, which allows for modifying the mutation function without implementing NSGA II from scratch and thereby eliminating the possibility of having different implementations of the algorithm and eventually providing a fair comparison. In the Pymoo coding, the genes to be mutated are chosen using the random function. This function generates a set of floats in the half open interval [0 1). These generated floats are used as reference to the genes that will be mutated. In order to make the implemented solution clear and not computationally expensive, we divide the interval [0 1) into portions and rank each portion. This means that we are seeking the portions that, when mutated, give good performance. We shall identify these portions and increase their probability of being mutated.
In order to be able to slice the interval [0 1) of float values into smaller intervals, we should first identify how many floating values this interval has. A float is composed of a sign bit, 23 mantissa bits, and 8 exponent bits. Since we are interested in the interval [0 1), the sign bit can be ignored since it will be fixed to 0. There are 223 floating points because the mantissa has 23 bits. However, to be able to neatly slice the interval to smaller intervals, we can pick an integer value between 0 and 224 and divide it by 224 to obtain the corresponding floating point number. Hence, the interval [0 1) can be rewritten as [0 224/224). In this way, picking any number in this interval will give us a float value in the interval [0 1). Therefore, we can neatly slice this interval into 24 slices as shown in Example 1.
Example 1. We rewrite [0, 1) as [0, (224/224.) )
We can produce 24 slices of this interval as follows:
Portion 1: [0, 2/224 )
Portion 2: [2/224, 22/224 )
Portion 3: [22/224, 23/224 )
Portion 4: [23/224, 24/224 )
⋮
Portion 24: [223/224, 224/224 )
Now that we have 24 portions of the interval, we mutate each portion individually while fixing the other portions to obtain a rank for each portion when mutated. Since our optimization has two functions, delay and energy consumption, mutating each portion yields a result for both delay and energy consumption. Figure 6 shows the delay, and Figure 7 shows the energy consumption when each portion is mutated.
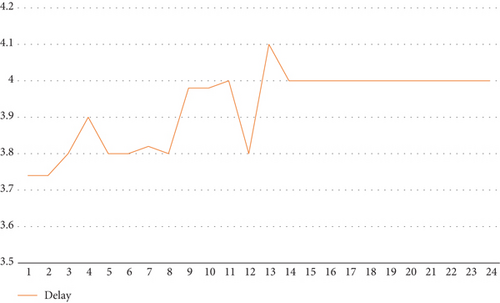
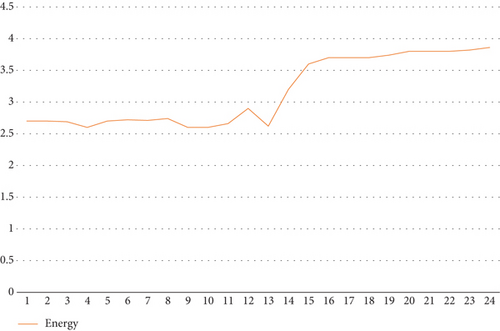
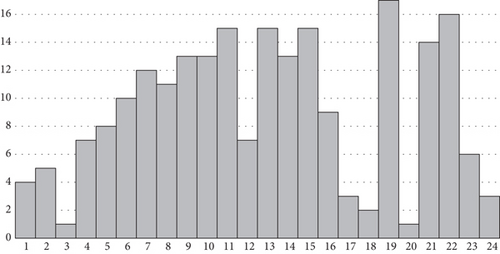
As can be seen in Figures 6 and 7, some portions exhibit better performance when mutated than others. For the delay, portions from 14 to 24 have a fixed delay. Portion 13, in particular, when mutated gives both low delay and energy consumption. To obtain a single value that is considered a rank for the portion, we take the average value of the delay and energy consumption and rank all portions. Figure 8 shows the rank of the portions.
6.2.2. Calculating Threshold
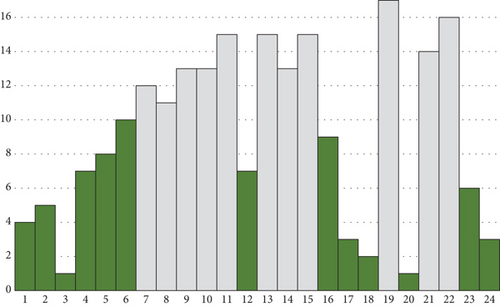
To distinguish between the portions of the genes that should have a higher probability of being mutated and those that should have a lower probability of being mutated, we need to calculate the threshold of the ranked values and then label each portion as “high rank” if above the threshold or “low rank” if below it. In Figure 9, the portions that are above the threshold are shown with a patterned fill, while the portions that are below the threshold are shown in plain color.
6.2.3. Modifying the Probability of Mutation
Based on the ranking discussed in the previous section, the portions that have a high rank should have a higher probability to be mutated. The probability of mutation is increased by ε. The value of ε should be tuned experimentally.
Similarly, we tuned ε to different values and obtained the following results. We consider values of epsilon that are between 0.01 and 0.4. Figures 10 and 11 show the delay and the energy consumption with different values of ε.
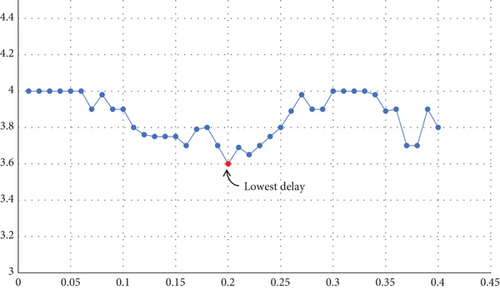
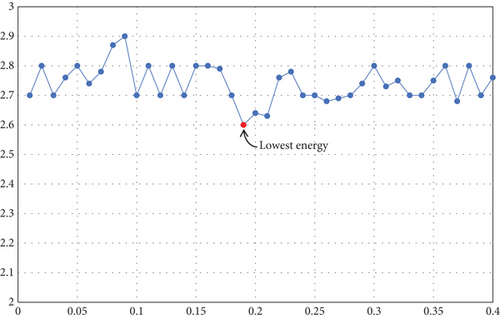
From Figures 10 and 11, we analyzed that the lowest delay was obtained with a value of ε = 0.2. For the energy consumption, the lowest energy consumption value was obtained with ε close to 0.2. This suggests that taking ε = 0.2 would be a good choice.
6.3. Time Complexity Analysis of RWP-NSGA II
- •
Dividing M genes into 24 slices involves iterating over the genes, which operates in O(M) time complexity. For each slice, setting one gene to 1 and the rest to 0 requires iterating through the genes in the slice, resulting in O(M) operations per slice. Since there are 24 slices, this step contributes O(24 × M) = O(M) time complexity.
- •
Computing fitness values to rank genes involves evaluating the algorithm’s performance for each gene setting, likely requiring O(24 × N) operations, where N is the population size.
- •
Determining the threshold to sort gene importance typically involves sorting fitness values, which takes O(M log M) time complexity. Tuning the ε value involves testing different values to find an optimal one, which generally adds a constant overhead, O(1), as it is an iterative process independent of gene count.
Mutating genes based on the determined ε value and sorted gene importance involves iterating over each gene, resulting in O(M) operations.
Combining these steps, the overall time complexity of the mutation process in RWP-NSGA II can be summarized as O(M + M + 24 × N + M log M + 1 + M) = O(M log M + N). Here, M represents the number of genes per individual, N is the population size, and 24 accounts for the number of slices used in the initial gene setting phase. Therefore, in the worst-case scenario, the mutation process in RWP-NSGA II is dominated by the sorting operation and the fitness evaluation across the population.
7. Results and Comparison
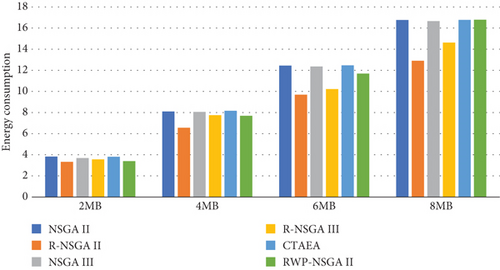
As discussed in the previous sections, the RWP-NSGA II employed a probabilistic mutation where the probabilities of some genes to be mutated are increased by an ε value that was experimentally set to 0.2. We compare the proposed algorithm with the multiobjective evolutionary algorithms. Figures 12 and 13 show the delay and energy consumption of each algorithm.
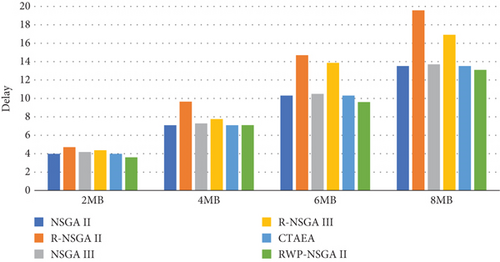
As can be seen in Figure 12, the delay of the algorithms differs slightly with 2 MB load. As the load increases, the difference grows. With 8 MB load, NSGA II, NSGA III R, and CTAEA show comparable results. The proposed RWP-NSGA II, however, outperforms the other algorithms with a slightly lower delay.
Figure 13 shows that the algorithms that had the lowest delay in Figure 12 now have the highest energy consumption. Similarly, R-NSGA II and R-NSGA III that have the highest delay in Figure 12 have the lowest energy consumption as shown in Figure 13.
This observed performance can be attributed to inherent optimization strategies and trade-offs of the algorithms. NSGA II, NSGA III, and CTAEA likely prioritize minimizing delay by efficiently allocating workload, leveraging their robust performance for exploring solutions that prioritize shorter processing times. On the other hand, R-NSGA II and R-NSGA III, which exhibit higher delay, may do so by conserving energy through less intensive computation or conservative allocation strategies. This trade-off between delay and energy consumption is a classic challenge in multiobjective optimization, where algorithms must strike a balance according to application-specific priorities and constraints. The results suggest that while some algorithms prioritize faster processing times, others opt for energy conservation. Following [20], we consider plotting the sum of the two objectives (delay + energy consumption), to get to see which algorithms really outperform the others for the two objectives. Figure 14 shows the sum of the delay and the energy consumption for all the algorithms.
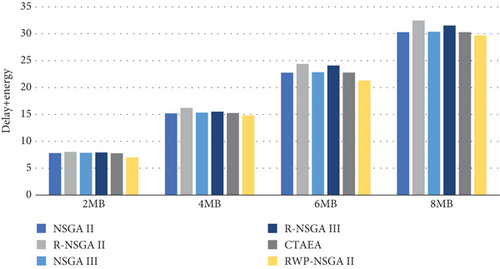
Figure 14 shows that the six algorithms with 2 MB load have comparable results with RWP-NSGA II having a slightly lower delay and energy consumption. With 4 MB load, we see that R-NSGA II has slightly higher delay and energy consumption than the other algorithms. With 6 MB load, the gap between the performance of the algorithms starts to grow and R-NSGA II and R-NSGA III have the highest delay and energy. NSGA II, NSGA III, and CTAEA have comparable results, and the proposed RWP-NSGA II has lower delay and energy consumption. For 8 MB load, the gap grows further, and the R-NSGA II shows the highest delay and energy consumption. NSGA II, NSGA III, and CTAEA still have comparable results. The proposed RWP-NSGA II outperforms the five other algorithms with the lowest delay and energy consumption by almost 3 units.
The results indicate that NSGA II, NSGA III, and CTAEA consistently maintain similar values of delay + energy consumption across all workload sizes (2, 4, 6, and 8 MB), suggesting their ability to balance both objectives effectively. This balanced performance implies that these algorithms achieve competitive solutions that optimize both delay reduction and energy consumption simultaneously. In contrast, R-NSGA II begins to exhibit higher delay + energy consumption starting from the 4 MB workload, indicating potential inefficiencies in managing heavier computational loads. This could stem from its optimization strategy, which may prioritize other objectives over minimizing delay and energy consumption under increasing workloads. Similarly, R-NSGA III shows higher delay + energy consumption from the 6 MB workload onwards, suggesting challenges in maintaining efficient workload allocation as computational demands escalate. This could be due to the algorithm’s design or parameter settings, which may not adapt optimally to larger workloads. The proposed RWP-NSGA II consistently outperforms all other algorithms from the 2 MB workload onwards, maintaining a better balance between the reduction of both delay and energy consumption. This superior performance is likely attributed to the integration of probabilistic mutation, which enhances the algorithm’s ability to explore and exploit the solution space effectively, adapting well to varying workload sizes. As the workload increases, RWP-NSGA II may continue to optimize workload allocation strategies more efficiently than its counterparts, leading to progressively better results as workload size grows.
8. Conclusion
This study addressed the workload allocation problem by introducing RWP-NSGA II, an advanced variant of NSGA II featuring an updated weighted probabilistic mutation. Through comprehensive experiments involving workload sizes ranging from 2 to 8 MB, RWP-NSGA II consistently demonstrated superior performance compared to the original NSGA II and other state-of-the-art multiobjective evolutionary algorithms. The integration of probabilistic mutation allowed RWP-NSGA II to adaptively optimize mutation probabilities, thereby enhancing its ability to achieve better solutions in varying workload scenarios. These findings underscore the effectiveness of incorporating dynamic parameter adjustments within evolutionary algorithms for improving optimization outcomes in complex, real-world applications. The findings highlighted that the proposed algorithm exhibits a delay and energy consumption that are consistently 3 units lower compared to the majority of other evolutionary algorithms under 2 and 4 MB loads. It maintains this superior performance even under heavier workloads of 6 and 8 MB, where many other algorithms experience a decline in performance.
Future research could focus on advancing parameter optimization strategies tailored specifically for RWP-NSGA II. This includes exploring methods for learning and adapting mutation probabilities dynamically based on real-time performance metrics. Additionally, investigations into extending RWP-NSGA II to handle more complex optimization problems or integrating it with ML techniques could further enhance its applicability and effectiveness in practical scenarios.
Conflicts of Interest
The authors declare no conflicts of interest.
Funding
The authors would like to thank Qatar National Library, QNL, for the support in publishing the paper.
Acknowledgments
The authors would like to thank Qatar National Library, QNL, for the support in publishing the paper.
Open Research
Data Availability Statement
Data are available on request from the authors.


